. 2024 Apr 15;10(8):e29504.
doi: 10.1016/j.heliyon.2024.e29504. eCollection 2024 Apr 30.

An integrated analysis revealing the angiogenic function of TP53I11 in tumor microenvironment

Affiliations

An integrated analysis revealing the angiogenic function of TP53I11 in tumor microenvironment

Wen Bai et al. Heliyon. .

Abstract

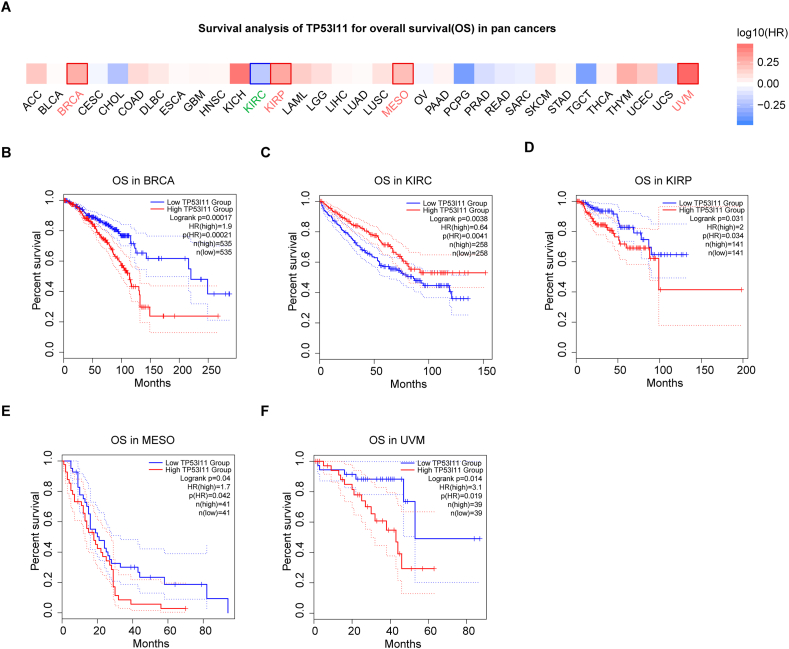
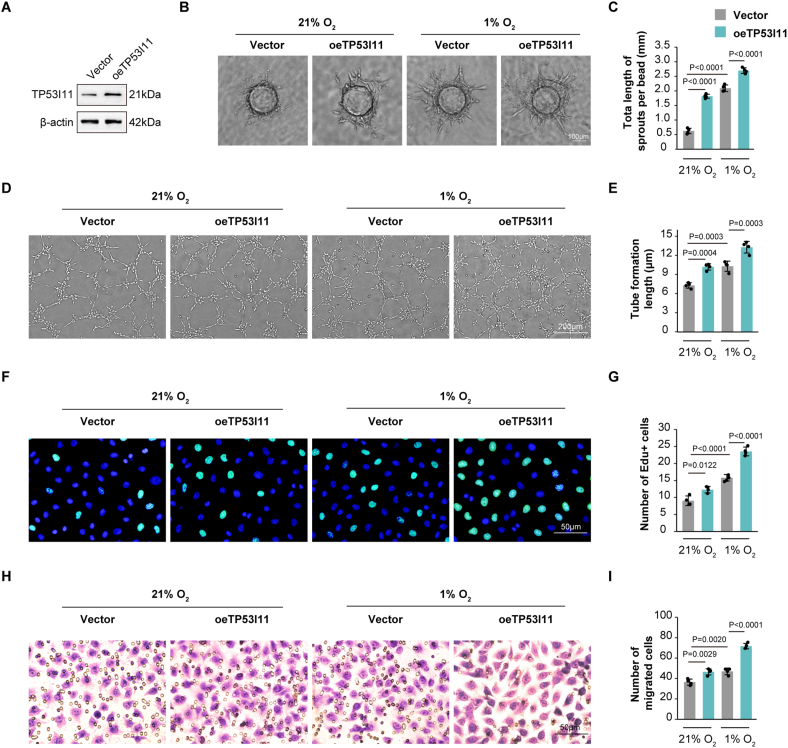
Despite growing evidence suggesting an important contribution of Tumor Protein P53 Inducible Protein 11 (TP53I11) in cancer progression, the role of TP53I11 remains unclear. Our first pan-cancer analysis of TP53I11 showed some tumor tissues displayed reduced TP53I11 expression compared to normal tissues, while others exhibited high TP53I11 expression. Meanwhile, TP53I11 expression carries a particular pan-cancer risk, as high TP53I11 expression levels are detrimental to survival for BRCA, KIRP, MESO, and UVM, but to beneficial survival for KIRC. We demonstrated that TP53I11 expression negatively correlates with DNA methylation in most cancers, and the S14 residue of TP53I11 is phosphorylated in several cancer types. Additionally, TP53I11 was found to be associated with endothelial cells in pan-cancer, and functional enrichment analysis provided strong evidence for its role in tumor angiogenesis. In vitro angiogenesis assays confirmed that TP53I11 can promote angiogenic function of human umbilical vein endothelial cells (HUVECs) in vitro. Mechanistic investigations reveal that TP53I11 is transcriptionally up-regulated by HIF2A under hypoxia.

Keywords: Angiogenesis; Endothelial cells; Immune infiltration; Prognosis; TP53I11.


Conflict of interest statement

The authors declare that they have no known competing financial interests or personal relationships that could have appeared to influence the work reported in this paper.

Figures

Fig. 1
Fig. 1
The pan-cancer landscape of TP53I11 expression. (A) Using data from the HPA dataset, we analyzed the mRNA expression of TP53I11 across various human tissues. (B) The GTEx dataset provided us with information on the mRNA expression of TP53I11 in different human tissues. (C) Using the GEPIA2 web tool, we examined the mRNA expression of TP53I11 in multiple normal tissues and cancers. Columns labeled with colors signify statistically significant differences compared to normal tissues, with red indicating upregulation and green indicating downregulation.
Fig. 2
Fig. 2
Association of TP53I11 mRNA expression with overall survival (OS) in pan-cancer. (A) The GEPIA2 web tool was used to assess the prognostic significance of TP53I11 across several types of human cancers. (B–F) Kaplan-Meier survival curves were generated to compare the overall survival (OS) rates between TP53I11 high- and low-expression groups in five different types of cancers: breast invasive carcinoma (BRCA), kidney renal clear cell carcinoma (KIRC), kidney renal papillary cell carcinoma (KIRP), mesothelioma (MESO), and uveal melanoma (UVM).
Fig. 3
Fig. 3
Analysis of protein phosphorylation of TP53I11 in pan-caner. (A–F) The UALCAN web tool, using the CPTAC dataset, was utilized to investigate protein phosphorylation of TP53I11 across multiple cancers. Box plots were generated to display the variations in SHROOM4 phosphoprotein (specifically, phosphorylation sites S14) between normal tissue and primary tumor for (A) GBM, (B) LIHC, (C) HNSC, (D) LUAD, (E) OV, and (F) PAAD. P-values were determined via unpaired t-tests. (G) The ARCHS4 database was utilized for Kinase Enrichment Analysis (KEA) to predict the upstream kinases involved in the phosphorylation of TP53I11 protein.
Fig. 4
Fig. 4
TP53I11 is associated with vascular endothelial features in cancer. (A) The heatmap illustrates the correlation between TP53I11 expression and the level of immune infiltration in various cancer types, as determined by XCELL algorithms. (B) Using TIMER2 web tool based on EPIC, MCPCOUNTER, and XCELL algorithms, the heatmap displays the correlation between SHROOM4 expression and the infiltration of immune cells in ECs across different types of cancer. (C) Using TIMER2 web tool, the heatmap shows the expression correlation between TP53I11 and several known markers of vascular ECs (including ANGPT1, ANGPT2, CD34, CDH5, ERG, ESAM, ETS1, FLT1, KDR, MMRN2, PDGFB, PECAM1, RHOJ, TEK, and TIE1) in diverse cancer types.
Fig. 5
Fig. 5
Single-cell analysis of TP53I11 expression pattern in pan-cancer. (A) Single-cell analysis of TP53I11 subcellular localization in tumor microenvironment (TME) using the MMUcan database. (B–D) Clustering is conducted based on cell type (B), sources (C), and tumor types (D), visualized using the UMAP algorithm from the Lung Tumor ECTax database through the Seurat package. (E) Validation of PECAM1, VWF, CXCR4 and TP53I11 in the UMAP projection. (F) Grouped bar chart shows the expression of TP53I11 in endothelial cells across total and different lung cancer types. (G) Stacked bar chart shows the expression pattern of TP53I11 in distinct lung cancer types and varied endothelial cell subtypes.
Fig. 6
Fig. 6
TP53I11-related enrichment analysis. (A–C) We obtained the top 100 genes related to TP53I11 using the GEPIA2 web tool and conducted GO analysis on these genes for (A) biological processes, (B) molecular functions, (C) cellular components, and. (D) HUVECs were fluorescence stained for TP53I11(turquoise), F-Actin/phalloidin (red) and DAPI (blue). (E) CoIP experiments using F-actin as the bait. Representative gel of one out of three independent experiments. Protein lysates were treated with actin stabilizing buffer prior to CoIP. (F) Based on the differentially expressed genes between TP53I11 high- and low-expression groups across 33 cancers from the TCGA database, GSEA analysis shows the top 25 upregulated enriched biological processes. The enriched biological processes, ranked based on normalized enrichment score (NES), are shown in a heatmap.
Fig. 7
Fig. 7
Validation of angiogenic function of TP53I11 in vitro. (A) Western blot of TP53I11 in HUVECs transfected with TP53I11 overexpression plasmids (oeTP53I11) and a mock control (vector). (B–I) The micro-vessel sprouting, tube formation, proliferative, and migratory abilities of cells in each group were evaluated using the fibrin bead angiogenesis assay, tube formation assay, EdU assay, and Transwell assay, respectively (n = 4 samples for each group). Error bars represent mean ± SEM; One-way ANOVA with Bonferroni's post hoc test (C, E, G, I).
Fig. 8
Fig. 8
HIF-2α upregulates TP53I11 expression upon hypoxia in ECs. (A) TP53I11 mRNA levels were assessed in endothelial cells (ECs) subjected to hypoxic conditions (1 % O2) for the specified durations (n = 4 independent experiments). (B–E) Western blot analysis and the quantitation of TP53I11, HIF-1α, and HIF-2α proteins was conducted in ECs exposed to hypoxia (1 % O2) for the indicated time points (n = 4 independent experiments). (F–G) Volcano plots for the overexpression of either HIF-1α or HIF-2α in HUVECs. (H–I) Western blot analysis and quantitation of TP53I11, HIF-1α, and HIF-2α proteins were conducted in ECs either untreated or exposed to hypoxia (1 % O2) for 4 h, along with transfection using siNC, siHIF-1α, or siHIF-2α (n = 4 independent experiments). (J) Luciferase reporter assays were performed to evaluate TP53I11 promoter activity in HEK293T cells transfected with control vector, HIF-1α overexpression, or HIF-2α overexpression plasmids (n = 3 independent experiments). (K) A diagrammatic representation of hypoxia response element (HRE) sequences in the human TP53I11 promoter was derived from the JASPAR database. (L) A schematic diagram depicting mutated HRE (mHRE) introduced into the human TP53I11 promoter. (M) Luciferase reporter assays were conducted to assess TP53I11 promoter activity in HEK293T cells following transfection of wild-type HRE (wHRE) or mHRE vectors under HIF-2α overexpression (n = 3 independent experiments). Error bars represent mean ± SEM; One-way ANOVA with Bonferroni's post hoc test (A, C, D, E, I, J, M). TSS, transcription start site.

References

    1. Collins F.S., McKusick V.A. Implications of the human genome project for medical science. JAMA. 2001;285:540–544. - PubMed
    1. Wheeler D.A., Wang L. From human genome to cancer genome: the first decade. Genome Res. 2013;23:1054–1062. - PMC - PubMed
    1. Cancer Genome Atlas Research N., Weinstein J.N., Collisson E.A., Mills G.B., Shaw K.R., Ozenberger B.A., Ellrott K., Shmulevich I., Sander C., Stuart J.M. The cancer genome atlas pan-cancer analysis project. Nat. Genet. 2013;45:1113–1120. - PMC - PubMed
    1. I.T.P.-C.A.o.W.G. Consortium Pan-cancer analysis of whole genomes. Nature. 2020;578:82–93. - PMC - PubMed
    1. Lloyd J.P., Soellner M.B., Merajver S.D., Li J.Z. Impact of between-tissue differences on pan-cancer predictions of drug sensitivity. PLoS Comput. Biol. 2021;17 - PMC - PubMed