

Isoniazid urine spectrophotometry for prediction of serum pharmacokinetics in adults with TB
- PMID: 38655375
- PMCID: PMC11037464
- DOI: 10.5588/ijtldopen.23.0361
Isoniazid urine spectrophotometry for prediction of serum pharmacokinetics in adults with TB
Abstract
Background: Isoniazid (INH) is an important drug in many TB regimens, and unfavorable treatment outcomes can be caused by suboptimal pharmacokinetics. Dose adjustment can be personalized by measuring peak serum concentrations; however, the process involves cold-chain preservation and laboratory techniques such as liquid chromatography (LC)/mass spectrometry (MS), which are unavailable in many high-burden settings. Urine spectrophotometry could provide a low-cost alternative with simple sampling and quantification methods.
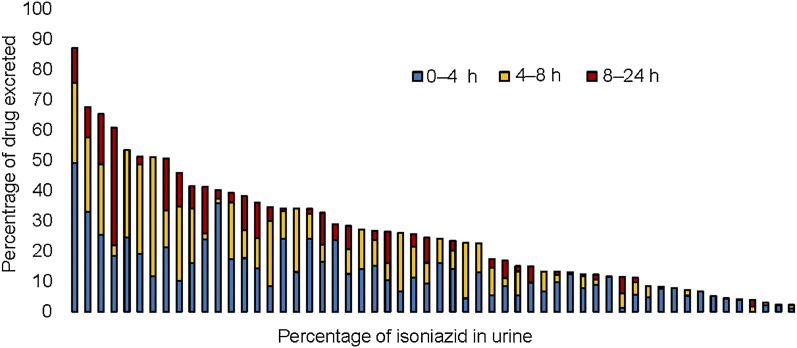
Methods: We enrolled 56 adult patients on treatment for active TB. Serum was collected at 0, 1, 2, 4, 6, and 8 h for measurement of INH concentrations using validated LC-MS/MS methods. Urine was collected at 0-4, 4-8, and 8-24 h intervals, with INH concentrations measured using colorimetric methods.
Results: The median peak serum concentration and total serum exposure over 24 h were 4.8 mg/L and 16.4 mg*hour/L, respectively. Area under the receiver operator characteristic curves for urine values predicting a subtherapeutic serum concentration (peak <3.0 mg/L) were as follows: 0-4 h interval (AUC 0.85, 95% CI 0.7-0.96), 0-8 h interval (AUC 0.85, 95% CI 0.71-0.96), and 0-24 h urine collection interval (AUC 0.84, 95% CI 0.68-0.96).
Conclusion: Urine spectrophotometry may improve feasibility of personalized dosing in high TB burden regions but requires further study of target attainment following dose adjustment based on a urine threshold.
Contexte: L’isoniazide (INH) est un médicament important dans de nombreux schémas thérapeutiques contre la TB, et des résultats thérapeutiques défavorables peuvent être dus à une pharmacocinétique sous-optimale. L’ajustement de la dose peut être personnalisé en mesurant les concentrations sériques maximales ; cependant, le processus implique la conservation de la chaîne du froid et des techniques de laboratoire telles que la chromatographie liquide (LC)/spectrométrie de masse (MS), qui ne sont pas disponibles dans de nombreuses régions à forte charge de morbidité. La spec-trophotométrie urinaire pourrait constituer une alternative peu coûteuse avec des méthodes d’échantillonnage et de quantification simples.
Méthodes: Nous avons recruté 56 patients adultes sous traitement pour une TB active. Le sérum a été prélevé à 0, 1, 2, 4, 6 et 8 h pour mesurer les concentrations d’INH à l’aide de méthodes LC-MS/MS validées. L’urine a été prélevée à des intervalles de 0–4, 4–8 et 8–24 h, et les concentrations d’INH ont été mesurées à l’aide de méthodes colorimétriques.
Résultats: La concentration sérique maximale médiane et l’exposition sérique totale sur 24 h étaient respectivement de 4,8 mg/L et de 16,4 mg*heure/L. L’aire sous les courbes caractéristiques de l’opérateur récepteur a été mesurée à l’aide de méthodes color-imétriques. Les aires sous les courbes caractéristiques des récepteurs pour les valeurs urinaires prédisant une concentration sérique sous-thérapeutique (pic <3,0 mg/L) étaient les suivantes : intervalle 0–4 h (AUC 0,85 ; IC 95% 0,7–0,96), intervalle 0–8 h (AUC 0,85 ; IC 95% 0,71–0,96), et intervalle de collecte d’urine 0–24 h (AUC 0,84 ; IC 95% 0,68–0,96).
Conclusion: La spectrophotométrie urinaire peut améliorer la faisabilité d’un dosage personnalisé dans les régions à forte charge de TB, mais nécessite une étude plus approfondie de l’atteinte de la cible après l’ajustement de la dose sur la base d’un seuil urinaire.
Keywords: INH; LC-MS/MS; PK; tuberculosis.
Figures


References
-
- Sterling TR, et al. . Three months of rifapentine and isoniazid for latent tuberculosis infection. N Engl J Med 2011;365(23):2155–2166. - PubMed
-
- Mitchison DA. Role of individual drugs in the chemotherapy of tuberculosis. Int J Tuberc Lung Dis 2000;4(9):796–806. - PubMed
-
- Weiner M, et al. . Low isoniazid concentrations and outcome of tuberculosis treatment with once-weekly isoniazid and rifapentine. Am J Respir Crit Care Med 2003;167(10):1341–1347. - PubMed
-
- Weiner M, et al. . Association between acquired rifamycin resistance and the pharmacokinetics of rifabutin and isoniazid among patients with HIV and tuberculosis. Clin Infect Dis 2005;40(10):1481–1491. - PubMed
Grants and funding
LinkOut - more resources
Full Text Sources