. 2023:17:59-71.
doi: 10.1609/icwsm.v17i1.22126. Epub 2023 Jun 2.

Followback Clusters, Satellite Audiences, and Bridge Nodes: Coengagement Networks for the 2020 US Election

Affiliations

Followback Clusters, Satellite Audiences, and Bridge Nodes: Coengagement Networks for the 2020 US Election

Andrew Beers et al. Proc Int AAAI Conf Weblogs Soc Media. 2023.

Abstract

The 2020 United States (US) presidential election was - and has continued to be - the focus of pervasive and persistent mis- and disinformation spreading through our media ecosystems, including social media. This event has driven the collection and analysis of large, directed social network datasets, but such datasets can resist intuitive understanding. In such large datasets, the overwhelming number of nodes and edges present in typical representations create visual artifacts, such as densely overlapping edges and tightly-packed formations of low-degree nodes, which obscure many features of more practical interest. We apply a method, coengagement transformations, to convert such networks of social data into tractable images. Intuitively, this approach allows for parameterized network visualizations that make shared audiences of engaged viewers salient to viewers. Using the interpretative capabilities of this method, we perform an extensive case study of the 2020 United States presidential election on Twitter, contributing an empirical analysis of coengagement. By creating and contrasting different networks at different parameter sets, we define and characterize several structures in this discourse network, including bridging accounts, satellite audiences, and followback communities. We discuss the importance and implications of these empirical network features in this context. In addition, we release open-source code for creating coengagement networks from Twitter and other structured interaction data.


Figures

Figure 1:
Figure 1:
Directed retweet networks with typical node layout algorithms. Here, each node is an account, an edge represents a directed retweet, and edge weights represent the number of retweets. Edges with fewer than 50 retweets have been filtered out to aid visualization. The following layout algorithms as implemented in the software package Gephi are used from left to right: ForceAtlas2, YifanHu, OpenOrd. The bottom row contains close-ups of the same figures in the top row, highlighting dense node formations which obscure cluster interpretability. Dataset derived from Twitter data on the 2020 presidential election (size = 142K nodes, 424K edges).
Figure 2:
Figure 2:
Schematic representation of coengagement visualizations. Panel 1) of this figure shows a schematic for transforming A) a unipartite directed graph into B) a bipartite directed graph, and then into C) a coengagement network. The blue node is linked to the yellow node because of their shared engaging node in red, and the blue node is linked to the green node because of their shared engaging node in yellow. Panel 2) shows the effect of the node filtering parameters on an example graph. Engaging nodes, colored grey, are sized by their average out-degree. Under different combinations of the filtering parameters n and s, different edges will result.
Figure 3:
Figure 3:
Case 1, election discourse for large audiences (s=1, n = 10,000). A coengagement visualization of retweet relationships in a collection of tweets related to the US presidential election. Each node represents a Twitter account, and two nodes are linked if at least 10,000 users retweeted them both nodes at least once. Edges are undirected and weighted according to how many users retweeted both nodes. Nodes are sized according to their weighted degree, i.e. the sum of the weights of their incoming edges. Highlighted nodes represent nodes with connections to both pro-Trump and pro-Biden clusters.
Figure 4:
Figure 4:
Fig. 4. Example accounts with bipartisan engagement in Case 1. Plots of partisan retweets of four different bridging accounts labeled in Figure 3. Tweet dates are marked by the first time they were retweeted in our dataset. “Pro-Trump Only” partisan retweets indicate users who only tweeted accounts labeled in the pro-Trump cluster in Figure 3. “Pro-Biden Only” signifies the same totals for the pro-Biden cluster. Retweets of bridging nodes themselves are excluded in both retweet totals.
Figure 5:
Figure 5:
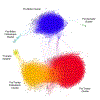
Case 2, Election discourse for medium audience sizes (s = 5, n = 100). A coengagement visualization of retweet relationships in a collection of tweets related to the US presidential election. Each node represents a Twitter account, and two nodes are linked if at least 100 users retweeted them both nodes at least five times. Edges are undirected and weighted according to how many users retweeted both nodes. Nodes are sized according to their weighted degree, i.e. the sum of the weights of their incoming edges. Nodes bridging between the pro-socialist and other clusters are labelled, as well as what we term satellite audiences: clusters of nodes with low-degree representing audiences with only tangential connection to mainstream US election discourse.
Figure 6:
Figure 6:
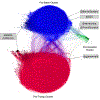
Case 3, Election discourse for small but active audiences (s = 25, n = 25). A coengagement visualization of retweet relationships in a collection of tweets related to the US presidential election. Each node represents a Twitter account, and two nodes are linked if at least 25 users retweeted them both nodes at least 25 times. Edges are undirected and weighted according to how many users retweeted both nodes. Nodes are sized according to their weighted degree, i.e. the sum of the weights of their incoming edges. Followback clusters, comprising nodes which retweet and follow other accounts to a relatively extreme degree, are labeled (Pro-Biden Followback Cluster, Pro-Trump Followback Cluster, “Trump’s Italians”).
Figure 7:
Figure 7:
Follower to following ratios for Case 3 clusters. Scatter plots of the number of followers and the number of accounts followed for each Twitter account visualized in Figure 6 (n = 25, s = 25). Follower and following totals are counted at the time of the latest tweet recorded in the dataset. Plots are separated and colored according to cluster membership, and both axes are on logarithmic scale.
Figure 8:
Figure 8:
Existence map for clusters across filtering values n, s. For each cluster identified in these three case studies, we determine the maximum parameter values at which these clusters can be identified. Clusters are labeled at each (n, s) parameter value if they contain specific high-degree landmark nodes identified in the previous case studies. In the shaded regions, individual clusters are salient to the clustering algorithm. Outside of the shaded regions, these clusters cannot be identified either because their constituent nodes are not present or because they have been subsumed into other clusters.
Figure 9:
Figure 9:
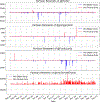
Visualization of suspensions across all case studies, labeled (1–3). The original networks from all three case studies are visualized in increasing order from left-to-right. Nodes that have been suspended by Twitter as of January 6, 2021 are colored in black, otherwise coloring remain the same as in the original case studies.

References

    1. Abilov A; Hua Y; Matatov H; Amir O; and Naaman M 2021. VoterFraud2020: a Multi-modal Dataset of Election Fraud Claims on Twitter. arXiv:2101.08210 [cs].
    1. Arif A; Stewart LG; and Starbird K 2018. Acting the Part: Examining Information Operations Within #Black-LivesMatter Discourse. Proceedings of the ACM on Human-Computer Interaction, 2(CSCW): 1–27.
    1. Bastian M; Heymann S; and Jacomy M 2009. Gephi: an open source software for exploring and manipulating networks. In Third international AAAI conference on weblogs and social media.
    1. Benkler Y; Tilton C; Etling B; Roberts H; Clark J; Faris R; Kaiser J; and Schmitt C 2020. Mail-In Voter Fraud: Anatomy of a Disinformation Campaign. SSRN Scholarly Paper ID 3703701, Social Science Research Network, Rochester, NY.
    1. Brandes U 1999. Layout of graph visualizations. PhD diss., University of Konstanz.

LinkOut - more resources