. 2024 May 14;98(5):e0019524.
doi: 10.1128/jvi.00195-24. Epub 2024 Apr 24.

Japanese encephalitis virus NS1 and NS1' proteins induce vimentin rearrangement via the CDK1-PLK1 axis to promote viral replication

Affiliations

Japanese encephalitis virus NS1 and NS1' proteins induce vimentin rearrangement via the CDK1-PLK1 axis to promote viral replication

Shengda Xie et al. J Virol. .

Abstract

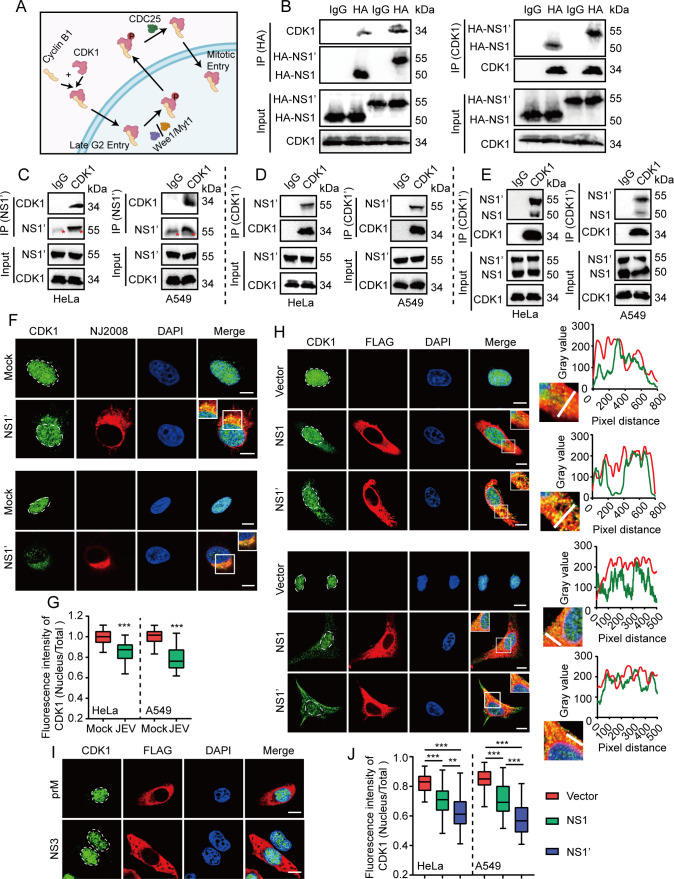
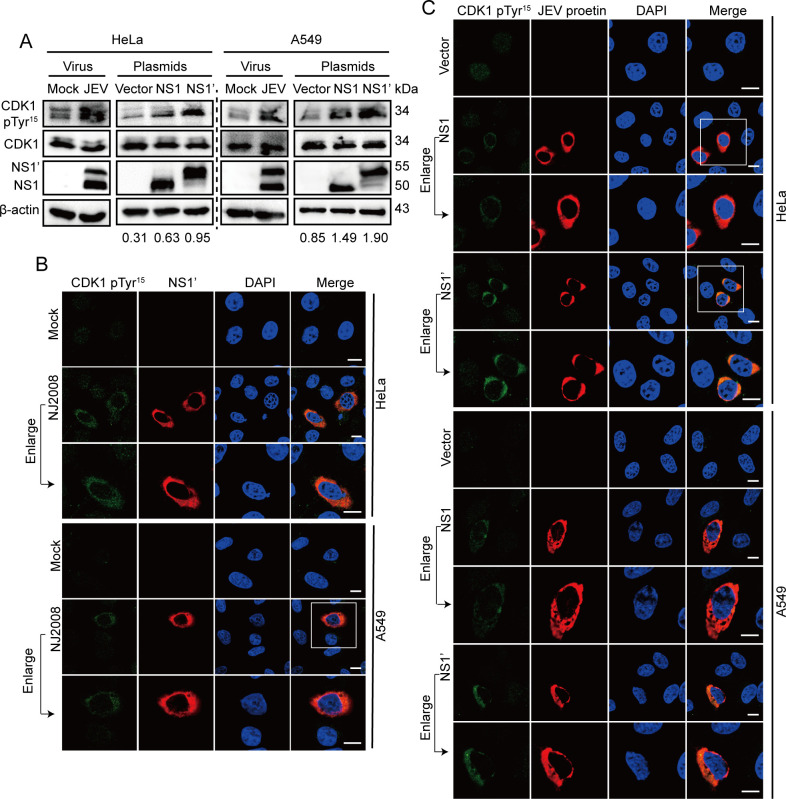
The host cytoskeleton plays crucial roles in various stages of virus infection, including viral entry, transport, replication, and release. However, the specific mechanisms by which intermediate filaments are involved in orthoflavivirus infection have not been well understood. In this study, we demonstrate that the Japanese encephalitis virus (JEV) remodels the vimentin network, resulting in the formation of cage-like structures that support viral replication. Mechanistically, JEV NS1 and NS1' proteins induce the translocation of CDK1 from the nucleus to the cytoplasm and interact with it, leading to the phosphorylation of vimentin at Ser56. This phosphorylation event recruits PLK1, which further phosphorylates vimentin at Ser83. Consequently, these phosphorylation modifications convert the typically filamentous vimentin into non-filamentous "particles" or "squiggles." These vimentin "particles" or "squiggles" are then transported retrogradely along microtubules to the endoplasmic reticulum, where they form cage-like structures. Notably, NS1' is more effective than NS1 in triggering the CDK1-PLK1 cascade response. Overall, our study provides new insights into how JEV NS1 and NS1' proteins manipulate the vimentin network to facilitate efficient viral replication.

Importance: Japanese encephalitis virus (JEV) is a mosquito-borne orthoflavivirus that causes severe encephalitis in humans, particularly in Asia. Despite the availability of a safe and effective vaccine, JEV infection remains a significant public health threat due to limited vaccination coverage. Understanding the interactions between JEV and host proteins is essential for developing more effective antiviral strategies. In this study, we investigated the role of vimentin, an intermediate filament protein, in JEV replication. Our findings reveal that JEV NS1 and NS1' proteins induce vimentin rearrangement, resulting in the formation of cage-like structures that envelop the viral replication factories (RFs), thus facilitating efficient viral replication. Our research highlights the importance of the interplay between the cytoskeleton and orthoflavivirus, suggesting that targeting vimentin could be a promising approach for the development of antiviral strategies to inhibit JEV propagation.

Keywords: CDK1; Japanese encephalitis virus; PLK1; infection; vimentin rearrangement.


Conflict of interest statement

The authors declare no conflict of interest.

Figures

Fig 1
Fig 1
JEV infection requires vimentin. (A) Vimentin knockdown HeLa and A549 cells were infected with three different JEV strains (NJ2008, HEN0701, and SA14-14-2 strains) at a multiplicity of infection (MOI) of 0.5. At 36 hpi, JEV infection was assessed using western blotting (WB). Vimentin knockdown cells (siVim#1 and siVim#2). Control knockdown cells (siCon). (B) JEV infection in WT and Vim-KO HeLa cells were assessed using WB, MOI = 0.5, 36 hpi. (C) Immunofluorescence assays were performed to detect the JEV NS1’ protein in WT and Vim-KO cells, MOI = 1, 36 hpi. Scale bar, 20 µm. (D and E) WT, Vim-KO, and KO + Vim HeLa cells were infected with the JEV NJ2008 strain for 24 or 48 h at an MOI of 0.5. The levels of JEV loads were examined by WB (D) and qRT-PCR (E). (F) Viral particles in supernatants (48 hpi) were examined by qRT-PCR. The data from the knockout (KO) group were normalized. All qRT-PCR data were expressed as the mean ± standard deviation (SD) of three independent experiments using a two-tailed t-test. **P < 0.01 and ***P < 0.001.
Fig 2
Fig 2
JEV infection induces the rearrangement of vimentin. (A and B) A549 cells were infected with JEV NJ2008 strain, MOI = 0.5, 48 hpi. Viral NS1’ (A) and E (B) proteins as well as vimentin were stained with respective antibodies. Scale bars, 20 µm. Arrows indicate mock cells and arrowheads indicate JEV-infected cells. (C) Quantification of vimentin rearrangements shown in A and B. Each point represents a cell, *** P < 0.001 (two-tailed t-test). (D) HeLa, Huh7, and Neuro-2a cells were infected with JEV NJ2008 strain for 48 h at an MOI of 0.5. The arrangements of vimentin were observed using confocal microscopy. Scale bars, 10 µm. (E) Quantification of vimentin rearrangements shown in D. Each point represents a cell, *** P < 0.001 (two-tailed t-test). (F) A schematic representation of viral infection and the analysis of peritoneal macrophages. Image created by BioRender. (G) Immunofluorescence analysis of vimentin in JEV-infected peritoneal macrophages, intraperitoneal injection (i.p.). 1  ×  107 PFU JEV per mouse (i.p. in vivo). MOI = 1 (in vitro). (H) Immunofluorescence staining of JEV-infected A549 and HeLa cells at 36 hpi, MOI = 0.5. Viral NS3 protein, dsRNA, and vimentin were stained with respective antibodies. Scale bars, 10 µm. (I) Transmission electron microscopy images of JEV-infected A549 cells at 36 hpi (MOI = 0.5). Scale bars, 200 nm. Intermediate filaments were indicated with green lines, and the viral RF was indicated with a red circle. ER, endoplasmic reticulum; Ve, virus-induced vesicles; white *, virus particles; N, nucleus. (J) A549 and HeLa cells were infected with the JEV NJ2008 strain for 48 h at an MOI of 0.5. The arrangements of vimentin and F-actin were observed using confocal microscopy. Scale bars, 10 µm. Phalloidin was used to stain F-actin.
Fig 3
Fig 3
Virus replication triggers vimentin rearrangement. (A and E) Time courses of the accumulated intracellular JEV RNA levels measured by qRT-PCR (left axis) and relative vimentin area changes in A549 cells (right axis), MOI = 0.5. JEV NJ2008 strain infection (A) and JEV SA14-14-2 strain infection (E). Data were expressed as the mean ± SD of three independent experiments. (B and F) Time courses of accumulated intracellular JEV prM, NS1, or NS1’ protein levels measured by WB in A549 cells, MOI = 0.5. JEV NJ2008 strain infection (B) and JEV SA14-14-2 strain infection (F). (C and G) A549 cells were infected with JEV NJ2008 (C) or SA14-14-2 (G) strains for indicated times, MOI = 0.5. The infected cells were analyzed using the confocal microscope. The white dotted lines indicate the outline of the cells. Scale bars, 10 µm. (D and H) Quantification of vimentin rearrangements shown in C (D) and G (H). Each point represents a cell. (I and J) HeLa and A549 cells were treated with different concentrations of acrylamide for 4 h and then infected with JEV NJ2008 strain for 24 h, MOI = 0.5. JEV infection was analyzed by WB (I) and qRT-PCR (J). qRT-PCR data were expressed as the mean ± SD of three independent experiments. (K) Cell viability was measured using CCK8 assays in HeLa and A549 cells treated with acrylamide. CCK8, Cell Counting Kit-8.
Fig 4
Fig 4
JEV NS1 and NS1’ proteins induce the rearrangement of vimentin. (A to D) HeLa cells were transfected with plasmids expressing JEV and WNV proteins, and the arrangements of vimentin were observed using the confocal microscope. FLAG-tagged plasmids expressing JEV C, prM, E, NS1, NS1’, NS2B, NS3, and NS5 proteins (A). The eGFP-tagged plasmid expressing JEV NS4A protein (B). The mCherry-tagged plasmid expressing JEV NS4B protein (C). HA-tagged plasmids expressing JEV NS2A and WNV NS1 proteins (D). Scale bars, 10 µm. (E) Quantification of vimentin rearrangements shown in A to D. Each point represents a cell.
Fig 5
Fig 5
JEV-induced vimentin rearrangement requires Ser56 and Ser83 phosphorylation. (A) A schematic representation of vimentin and its phosphorylation sites. (B) Fluorescence microscopy images of Vim-KO HeLa cells expressing WT vimentin or mutant (S39G, S56A, and S83A) plasmids that were either infected or uninfected with JEV, MOI = 0.5, 36 hpi. Scale bars, 10 µm. (C) Vim-KO HeLa cells were cotransfected with viral proteins (NS1 and NS1’) along with either WT or mutant vimentin plasmids for 36 h. Immunofluorescence staining was performed to detect the viral proteins and vimentin using specific antibodies. Scale bars, 10 µm. (D and E) Confocal (D) and immunoblot (E) analysis of Ser56 phosphorylation (pSer56) of vimentin in JEV-infected A549 and HeLa cells, MOI = 0.5. Scale bars, 10 µm. (F to H) A549 and HeLa cells were transfected with JEV NS1 or NS1’ plasmids for 36 h. The phosphorylation of vimentin at Ser56 (pSer56) was analyzed using WB (F) and confocal microscopy (G and H). Scale bars, 10 µm. Vim, vimentin; Vec, vector.
Fig 6
Fig 6
Ser56 and Ser83 sites of vimentin are essential for JEV replication. (A and B) The levels of JEV infection were measured in Vim-KO HeLa cells that were transfected with WT or mutant plasmids (S39G and S56A) using WB (A) and qRT-PCR (B), MOI = 0.5. (C and D) The levels of JEV infection were measured in Vim-KO HeLa cells that were transfected with WT or mutant plasmids (S56A and S83A) using WB (C) and qRT-PCR (D), MOI = 0.5. All qRT-PCR data were expressed as the mean ± SD of three independent experiments using a two-tailed t-test. ns, not significant; *P < 0.05, **P < 0.01, and ***P < 0.001. Vim, vimentin.
Fig 7
Fig 7
CDK1 inhibitors suppress JEV infection. (A) A schematic representation of phosphorylation of vimentin mediated by CDK1 and PLK1. (B and C) HeLa and A549 cells were treated with indicated concentrations of Roscovitine and RO3306. The infection of JEV was measured using WB (B) and qRT-PCR (C), MOI = 1, 24 hpi. (D) The schematic representation shows the treatment with Roscovitine and RO3306 and viral infection. (E and F) HeLa (E) and A549 (F) cells were treated as in D. JEV infection was analyzed using WB and qRT-PCR, MOI = 1. Inhibitor concentrations in WB were consistent with those in qRT-PCR. (G) HeLa and A549 cells were infected with the JEV NJ2008 strain at an MOI of 1. At 8 hpi, these cells were added with Roscovitine (20 µM in HeLa, 35 µM in A549) or RO3306 (6 µM in HeLa, 12 µM in A549) and maintained for 8 h. Samples were collected and analyzed at 16 hpi. All qRT-PCR data were expressed as the mean ± SD of three independent experiments.
Fig 8
Fig 8
Roscovitine and RO3306 inhibit the JEV-induced vimentin rearrangement. (A and B) WT and Vim-KO HeLa cells were incubated with JEV NJ2008 strain (MOI = 1) at 37°C. After 2 h, the medium was changed, and Roscovitine (20 µM) and RO3306 (6 µM) were added to maintain for 24 h. Samples were analyzed using WB (A) and qRT-PCR (B) to assess viral infection. Rosco, Roscovitine. (C) HeLa and A549 cells were infected with the JEV NJ2008 strain for 24 h, MOI = 1. Roscovitine (20 µM in HeLa, 35 µM in A549) and RO3306 (6 µM in HeLa, 12 µM in A549) were added at 8 or 16 hpi. Fluorescence images show vimentin in magenta, NS1’ in red, CDK1 in green, and nucleus in blue. The white circles indicate the nucleus, and the arrows indicate CDK1 outside the nucleus. Scale bars, 10 µm. (D and E) Cells were incubated with JEV (MOI = 1) at 37°C. After 2 h, the medium was changed, and BI 2536 was added to maintain for 24 h. Samples were analyzed using WB (D) and qRT-PCR (E) to assess viral infection. All qRT-PCR data were expressed as the mean ± SD of three independent experiments.
Fig 9
Fig 9
NS1 and NS1’ proteins interact with CDK1 and induce it out of the nucleus. (A) The schematic representation of the regulation of CDK1 in mitosis. Image created by BioRender. (B) HA-tagged NS1 and NS1’ plasmids were transfected into HeLa cells separately. The cell lysates (input) and immunoprecipitates (IP, with anti-HA (left) or anti-CDK1 (right) antibodies) from cells were analyzed by WB using anti-CDK1 (left) or anti-NS1 (right) antibodies. IgG was used as a negative control. (C to E) HeLa and A549 cells were infected with the JEV NJ2008 strain for 36 h, MOI = 1. Cell lysates (input) and immunoprecipitates [IP, with anti-NS1’ (C) or anti-CDK1 (D and E) antibodies] from cells were analyzed by WB using anti-CDK1 (C), anti-NS1’ (D), or anti-NS1 (E) antibodies. IgG was used as a negative control. Red * in C indicates IgG heavy chain. (F) Representative confocal microscopy images are shown to illustrate the localization of CDK1 in JEV-infected or uninfected HeLa (top) and A549 (bottom) cells, MOI = 1, 24 hpi. Scale bars, 10 µm. (G) Quantification of CDK1 distribution shown in F (n = 30), two-tailed t-test, ***P < 0.001. (H) HeLa (top) and A549 (bottom) cells were transfected with FLAG-tagged NS1 and NS1’ plasmids for 36 h. Viral protein (NS1 or NS1’) and CDK1 were stained with respective antibodies. Scale bars, 10 µm. (I) HeLa cells were transfected with FLAG-tagged prM and NS3 plasmids for 36 h. Viral protein (prM or NS3) and CDK1 were stained with respective antibodies. Scale bars, 10 µm. (J) Quantification of CDK1 distribution shown in H (n = 30), two-tailed t-test; **P < 0.01 and ***P < 0.001.
Fig 10
Fig 10
JEV infection induces CDK1 phosphorylation. (A to C) HeLa and A549 cells were either infected with JEV (MOI = 1, 24 hpi) or transfected with NS1 and NS1’ plasmids (36 h). The phosphorylation of CDK1 at Tyr15 (pTyr15) was assessed using WB (A) and confocal microscopy (B and C). Scale bars, 10 µm.
Fig 11
Fig 11
Repolymerization of vimentin needs microtubules. (A) Vim-KO HeLa cells were transfected with HA-tagged WT or mutant vimentin plasmids for 24 h. Cells were stained with anti-HA (green) or anti-vimentin (red) antibodies. Scale bars, 10 µm. (B and C) Viral proteins (NS3 or NS1’) and vimentin mutant (S56/83E) plasmids were co-transfected in Vim-KO HeLa cells for 36 h. Immunofluorescence staining was performed to detect the viral proteins and vimentin using specific antibodies. Scale bars, 10 µm. Vec, vector. (D) A549 and HeLa cells were treated with nocodazole (10 µM, 1 h at 4°C) and then transfected with the JEV NS1’ plasmid for 36 h. The viral NS1’ protein and vimentin were stained with respective antibodies, and the nucleus was stained with 4,6-diamidino-2-phenylindole (DAPI). Scale bars, 10 µm. White arrows indicate “particles” or “squiggles.” (E and F) The levels of JEV infection were measured in WT and Vim-KO HeLa cells that were transfected with ULF plasmids using WB (E) and qRT-PCR (F), MOI = 0.5. qRT-PCR data were expressed as the mean ± SD of three independent experiments.

Similar articles

Cited by

References

    1. Turtle L, Solomon T. 2018. Japanese encephalitis - the prospects for new treatments. Nat Rev Neurol 14:298–313. doi:10.1038/nrneurol.2018.30 - DOI - PubMed
    1. Campbell GL, Hills SL, Fischer M, Jacobson JA, Hoke CH, Hombach JM, Marfin AA, Solomon T, Tsai TF, Tsu VD, Ginsburg AS. 2011. Estimated global incidence of Japanese encephalitis: a systematic review. Bull World Health Organ 89:766–774, doi:10.2471/BLT.10.085233 - DOI - PMC - PubMed
    1. Xie S, Zhang H, Liang Z, Yang X, Cao R. 2021. AXL, an important host factor for DENV and ZIKV replication. Front Cell Infect Microbiol 11:575346. doi:10.3389/fcimb.2021.575346 - DOI - PMC - PubMed
    1. Barrows NJ, Campos RK, Liao K-C, Prasanth KR, Soto-Acosta R, Yeh S-C, Schott-Lerner G, Pompon J, Sessions OM, Bradrick SS, Garcia-Blanco MA. 2018. Biochemistry and molecular biology of flaviviruses. Chem Rev 118:4448–4482. doi:10.1021/acs.chemrev.7b00719 - DOI - PMC - PubMed
    1. Slon Campos JL, Mongkolsapaya J, Screaton GR. 2018. The immune response against flaviviruses. Nat Immunol 19:1189–1198. doi:10.1038/s41590-018-0210-3 - DOI - PubMed

MeSH terms

LinkOut - more resources