. 2024 May 14;24(10):2721-2735.
doi: 10.1039/d3lc01062g.

Detection and identification of single ribonucleotide monophosphates using a dual in-plane nanopore sensor made in a thermoplastic via replication

Affiliations

Detection and identification of single ribonucleotide monophosphates using a dual in-plane nanopore sensor made in a thermoplastic via replication

Chathurika Rathnayaka et al. Lab Chip. .

Abstract

We report the generation of ∼8 nm dual in-plane pores fabricated in a thermoplastic via nanoimprint lithography (NIL). These pores were connected in series with nanochannels, one of which served as a flight tube to allow the identification of single molecules based on their molecular-dependent apparent mobilities (i.e., dual in-plane nanopore sensor). Two different thermoplastics were investigated including poly(methyl methacrylate), PMMA, and cyclic olefin polymer, COP, as the substrate for the sensor both of which were sealed using a low glass transition cover plate (cyclic olefin co-polymer, COC) that could be thermally fusion bonded to the PMMA or COP substrate at a temperature minimizing nanostructure deformation. Unique to these dual in-plane nanopore sensors was two pores flanking each side of the nanometer flight tube (50 × 50 nm, width × depth) that was 10 μm in length. The utility of this dual in-plane nanopore sensor was evaluated to not only detect, but also identify single ribonucleotide monophosphates (rNMPs) by using the travel time (time-of-flight, ToF), the resistive pulse event amplitude, and the dwell time. In spite of the relatively large size of these in-plane pores (∼8 nm effective diameter), we could detect via resistive pulse sensing (RPS) single rNMP molecules at a mass load of 3.9 fg, which was ascribed to the unique structural features of the nanofluidic network and the use of a thermoplastic with low relative dielectric constants, which resulted in a low RMS noise level in the open pore current. Our data indicated that the identification accuracy of individual rNMPs was high, which was ascribed to an improved chromatographic contribution to the nano-electrophoresis apparent mobility. With the ToF data only, the identification accuracy was 98.3%. However, when incorporating the resistive pulse sensing event amplitude and dwell time in conjunction with the ToF and analyzed via principal component analysis (PCA), the identification accuracy reached 100%. These findings pave the way for the realization of a novel chip-based single-molecule RNA sequencing technology.


Conflict of interest statement

The authors have declared no conflict of interest.

Figures
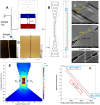
Fig. 1
Fig. 1. (A) Schematic showing the layout of the mixed-scale fluidic circuit including the microchannels and dual in-plane nanopore sensor. Also shown is a COMSOL simulation indicating the relative voltage drop throughout the fluidic circuit. There are four reservoirs (two on either side of the dual in-plane nanopore sensor) showing the sample inlet and outlet reservoirs. (B) 2D schematic of the dual in-plane nanopore sensor, which consisted of a 3D tapered input populated with pillars used to help electrokinetically shuttle single molecules into the sensor from the microchannels. There were in-plane nanopores flanking either side of the flight tube used to determine the molecular-dependent apparent electrophoretic mobility of the particular molecule translocating through the sensor. The pores had a pseudo-Gaussian shape determined by the ion beam intensity profile and the flight tube had a square shape. (C) SEM images of the Si master mold of the dual in-plane nanopore sensor (upper panel). In this SEM, the microchannels are shown as well. A high-resolution SEM of the dual in-plane nanopore sensor is shown in the middle panel with the 10 μm length flight tube. The lower panels show high resolution SEMs of the two in-plane pores that flank the flight tube. These pores are both 10 nm in length. (D) AFM images of the dual in-plane nanopores that flanked the nanometer flight tube. The AFM images are those for the resin stamp (left) and the imprinted device (right). (E) COMSOL simulation of the relative voltage drop through an in-plane pore. (F) Relative voltage drop through the sensor as a function of sensor position. The absolute voltage drop through each element of the sensor could be determined by multiplying the relative potential drop × applied voltage to the sensor. The flight tube had a length of 10 μm. Cs = capacitance of the polymer substrate (cross-hashed area; dot-dashed line shows capacitor plates, d = effective distance between plates), RNC = nanochannel flight tube resistance, and RMC = microchannel resistance.
Fig. 2
Fig. 2. Rapid scanning confocal images of dual in-plane nanopore thermoplastic devices (150× objective; λ = 405 nm). (A) Unexposed, (B) 5 min O2 plasma exposed, and (C) 10 min UV/O3 exposed COP devices. (D) Unexposed, (E) 5 min O2 plasma activated, and (F) 10 min UV/O3 exposed PMMA nanofluidic devices. Depth profile of (G) PMMA and (H) COP nanochannels (50 × 50 nm; width × depth) for different UV/O3 exposure times. UV/O3 intensity = 20 mW cm−2. For (B–F), the scale bar shown in (A) is applicable.
Fig. 3
Fig. 3. Two different dual in-plane nanopore sensor designs. COMSOL simulations showing the electric field strength distribution for; (A) blunt end input geometry and (B) taper input geometry. Label-free detection of rCMPs (10 nM) using a PMMA/COC dual in-plane nanopore sensor. A 10 s transient current trace obtained with: (C) blunt end geometry; and (D) tapered end geometry. ΔI/I0 represents the ratio of the RPS event amplitude normalized with respect to the open pore current (negative values are indicative of a negative polarity event – current value decreases for an RPS event).
Fig. 4
Fig. 4. Label-free detection and identification of rNMPs using the dual in-plane nanopore sensor. RPS trace data for three different concentrations rCMP samples with each concentration run in different device (A). The first current trace is for the blank, which contained only 1× NEBuffer 3 (pH = 7.9). The blue line represents amplitude threshold condition. (B) RPS trace of 1 nM rCMP using the dual in-plane nanopore sensor with a carrier electrolyte of 1× NEBuffer 3 (2 s; total run was 2 min). (C) Expanded view of a single paired peak (see panel (B)) for rCMP showing the ToF, peak amplitude (absolute value), and dwell time for a single event of the pair. (D–F) Histograms for the peak ΔI/I0, dwell time, and the ToF for 1 nM rCMP RPS data. (G) RPS current trace data for 2 s of a 2 min run using 10 nM rCMP in 1× NEBuffer 3. (H–J) Histograms for the peak ΔI/I0, dwell time, and ToF for 10 nM rCMP RPS data. (K) RPS current trace for a 2 min run (shows expanded view of 2 s) for 100 nM rCMP in 1× NEBuffer 3. (L–N) Histograms for the peak ΔI/I0, dwell time, and ToF for the 100 nM rCMP RPS data. In all cases, a COP/COC dual in-plane nanopore sensor was used with a 10 μm nano-flight tube length using a driving voltage of 2.5 V at the sample inlet. All data was subjected to a 100 Hz high pass filter and a 10 kHz low pass filter. The electrophoresis was operated with the sample inlet being the anode and the receiving reservoir being the cathode. Thus, the electrokinetic motion of the rNMPs was in the same direction as the EOF. The numbers shown in panels B, G and K represent the capture rate (s−1) for each rCMP concentration.
Fig. 5
Fig. 5. Label-free detection and identification of rNMPs using the dual in-plane nanopore sensor. (A) RPS trace data for an equimolar mixture of the rNMPs; total concentration = 10 nM. The blue line represents amplitude threshold condition. Even though some positive polarity events were visible, they were not scored as events because they did not exceed the time threshold condition for scoring as a RPS event, which was set at 0.1 ms (equal to the low pass filter bandwidth; 1/10 kHz). (B) RPS trace (120 ms) for a section of the data shown in (A) with the rNMPs called based on their ToF only in this case. There was a single non-paired event in this trace data. (C) Histograms of the ToFs for the rNMPs acquired using the dual in-plane nanopore sensor. In this case, each rNMP was run in a separate device. (D) Histograms of the ToFs for rNMPs acquired using the dual in-plane nanopore sensor. For this example, all rNMPs were run in a single device. (E) Identification accuracies of rNMPs calculated from Gaussian peak overlaps in the ToF data. For this data, each rNMP was run separately in a different device. (F) Identification accuracies for the rNMPs, which were run together in a single dual in-plane nanopore sensor device. In all cases, a COP/COC dual in-plane nanopore sensor was used with a 10 μm nanoflight tube length and 1× NEBuffer at pH 7.9 using a driving voltage of 2.5 V. In (E) and (F), the histograms were fit to Gaussian functions and each bin width represented 0.3 ms. All data was subjected to a 100 Hz high pass filter and a 10 kHz low pass filter.
Fig. 6
Fig. 6. Identification of rNMPs using dual in-plane nanopore sensor with a 10 μm long nano-flight tube and COP/COC device. Histograms of (A) normalized peak amplitude and (B) dwell time for the rNMPs. Scatter plots of nucleotide translocation events showing (C) normalized peak amplitudes versus ToF, and (D) normalized peak amplitude versus dwell times for the rNMPs. Data were acquired with 1× NEBuffer 3 (pH.7.9) using a bias voltage of 2.5 V and a 10 μm long flight tube. The rNMP concentration was 10 nM.
Fig. 7
Fig. 7. Principal component analysis (PCA) with K-clustering of the dual in-plane nanopore sensor data shown in Fig. 5. (A) Three-dimensional plot of K-mean clusters, which was generated using 3 variables (pore 1 dwell time, pore 2 dwell time, and ToF with 3 PCA variables (PC1 = 65.4%, PC2 = 30.2%, and PC3 = 4.4% of variance)). The accompanying table shows the 4 clusters and the classification of the 4 rNMPs into each of the four clusters. (B) Three-dimensional plot of K-mean clusters, which was generated using 5 variables including pore 1 dwell time, pore 2 dwell time, ToF, pore 1 normalized amplitude, pore 2 normalized amplitude with 3 PCA variables (PC1 = 44.0%, PC2 = 29.7%, PC3 = 18.3% variance). The table shows the classification accuracy, which in this case was 100%.

Similar articles

Cited by

References

    1. Byron S. A. Van Keuren-Jensen K. R. Engelthaler D. M. Carpten J. D. Craig D. W. Nat. Rev. Genet. 2016;17:257. doi: 10.1038/nrg.2016.10. - DOI - PMC - PubMed
    1. Ozsolak F. Milos P. M. Nat. Rev. Genet. 2011;12:87. doi: 10.1038/nrg2934. - DOI - PMC - PubMed
    1. Corney D. C. Mater. Methods. 2013;3:203.
    1. Schaefer M. Pollex T. Hanna K. Lyko F. Nucleic Acids Res. 2008;37:e12–e12. doi: 10.1093/nar/gkn954. - DOI - PMC - PubMed
    1. Ozsolak F. Platt A. R. Jones D. R. Reifenberger J. G. Sass L. E. McInerney P. Thompson J. F. Bowers J. Jarosz M. Milos P. M. Nature. 2009;461:814. doi: 10.1038/nature08390. - DOI - PubMed

Publication types