. 2024 Apr 24:13:e83641.
doi: 10.7554/eLife.83641.

Altered transcriptomic immune responses of maintenance hemodialysis patients to the COVID-19 mRNA vaccine

Affiliations

Altered transcriptomic immune responses of maintenance hemodialysis patients to the COVID-19 mRNA vaccine

Yi-Shin Chang et al. Elife. .

Abstract

Background: End-stage renal disease (ESRD) patients experience immune compromise characterized by complex alterations of both innate and adaptive immunity, and results in higher susceptibility to infection and lower response to vaccination. This immune compromise, coupled with greater risk of exposure to infectious disease at hemodialysis (HD) centers, underscores the need for examination of the immune response to the COVID-19 mRNA-based vaccines.

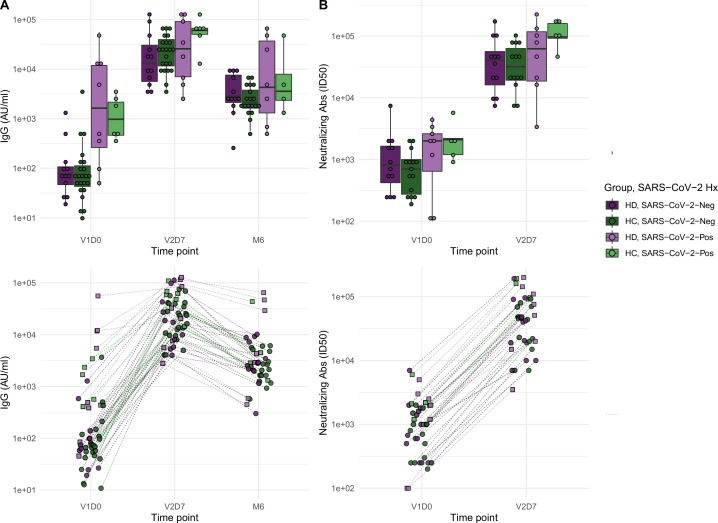
Methods: The immune response to the COVID-19 BNT162b2 mRNA vaccine was assessed in 20 HD patients and cohort-matched controls. RNA sequencing of peripheral blood mononuclear cells was performed longitudinally before and after each vaccination dose for a total of six time points per subject. Anti-spike antibody levels were quantified prior to the first vaccination dose (V1D0) and 7 d after the second dose (V2D7) using anti-spike IgG titers and antibody neutralization assays. Anti-spike IgG titers were additionally quantified 6 mo after initial vaccination. Clinical history and lab values in HD patients were obtained to identify predictors of vaccination response.

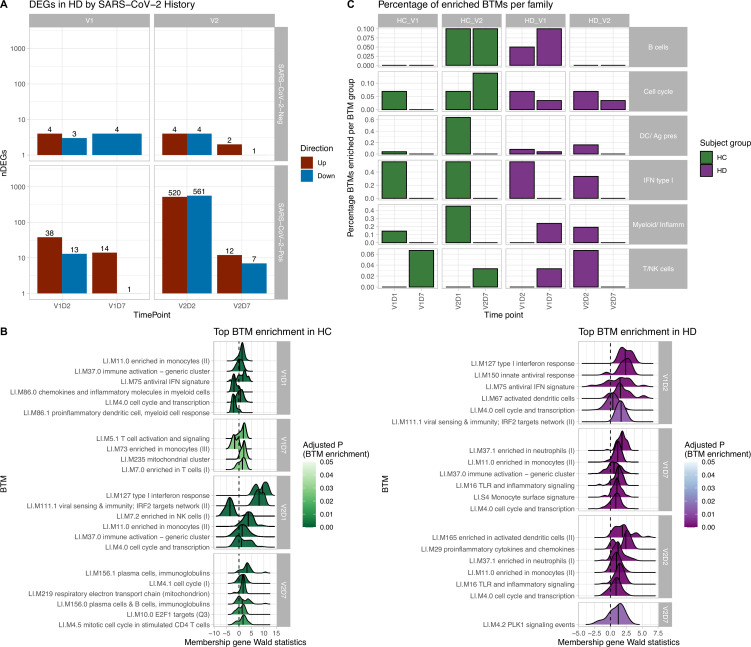
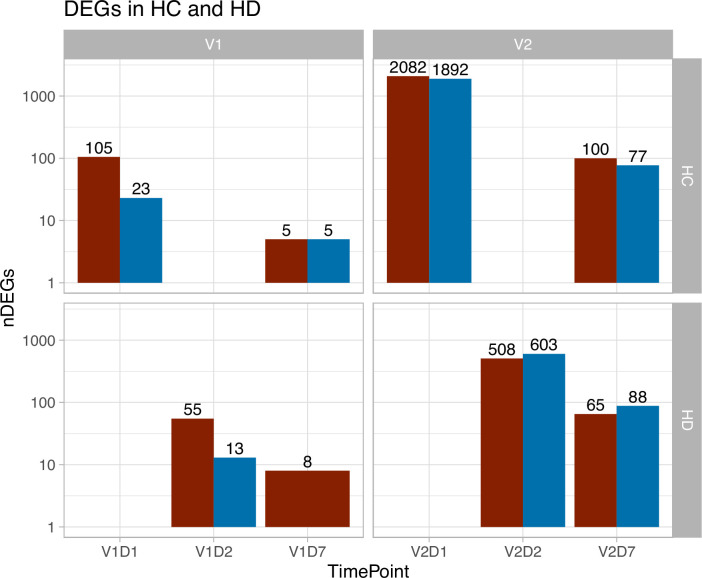
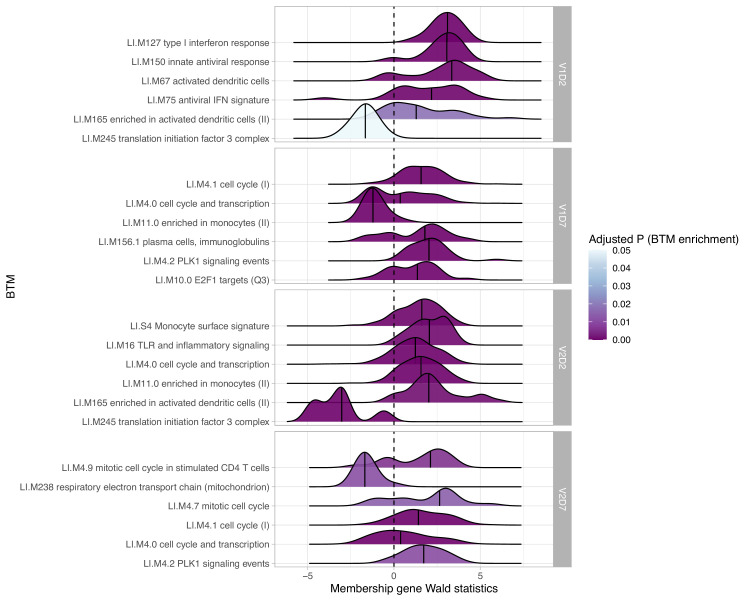
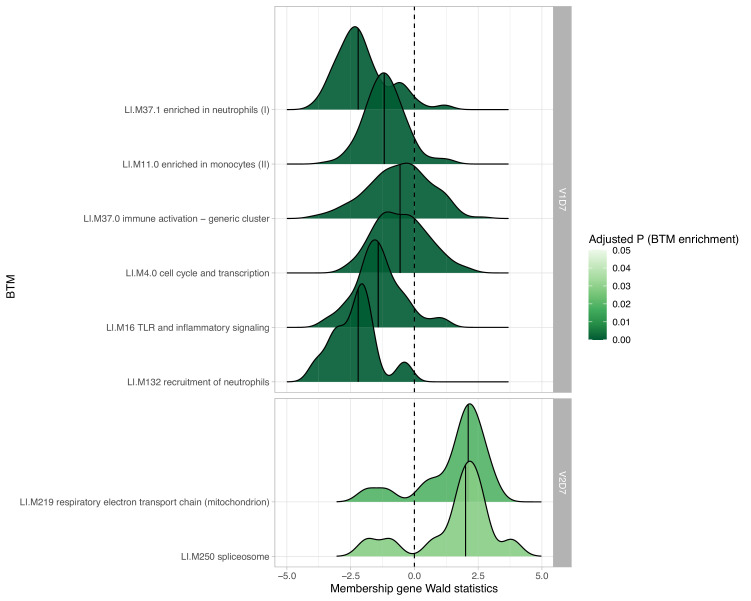
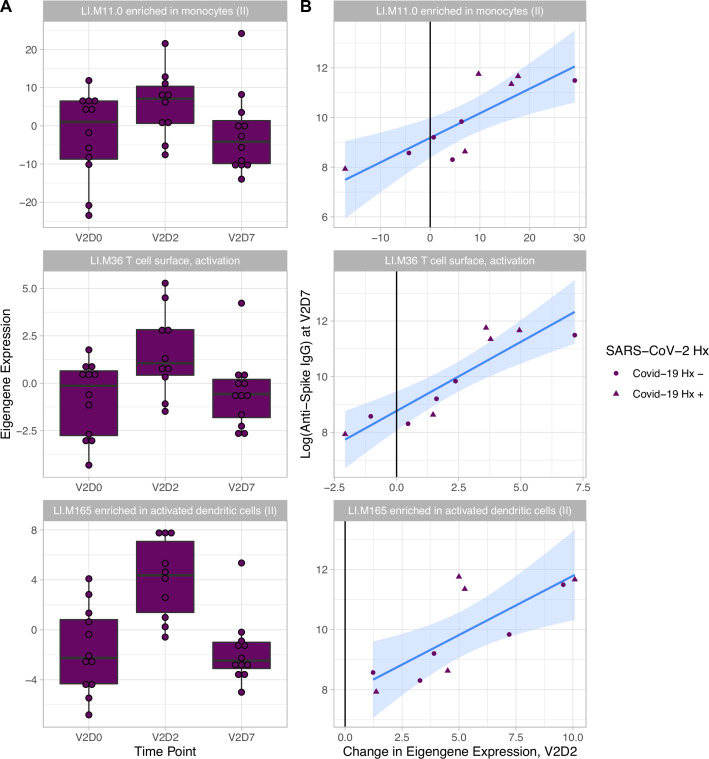
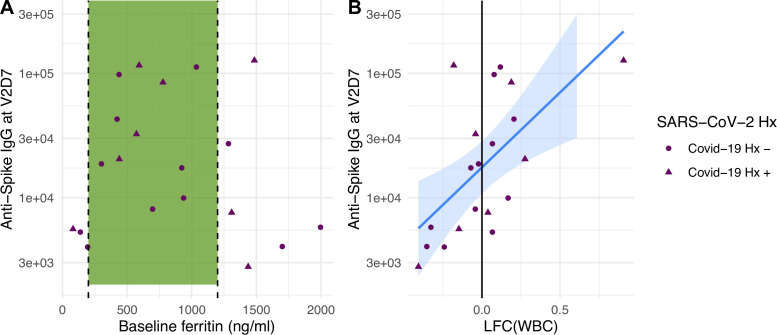
Results: Transcriptomic analyses demonstrated differing time courses of immune responses, with prolonged myeloid cell activity in HD at 1 wk after the first vaccination dose. HD also demonstrated decreased metabolic activity and decreased antigen presentation compared to controls after the second vaccination dose. Anti-spike IgG titers and neutralizing function were substantially elevated in both controls and HD at V2D7, with a small but significant reduction in titers in HD groups (p<0.05). Anti-spike IgG remained elevated above baseline at 6 mo in both subject groups. Anti-spike IgG titers at V2D7 were highly predictive of 6-month titer levels. Transcriptomic biomarkers after the second vaccination dose and clinical biomarkers including ferritin levels were found to be predictive of antibody development.

Conclusions: Overall, we demonstrate differing time courses of immune responses to the BTN162b2 mRNA COVID-19 vaccination in maintenance HD subjects comparable to healthy controls and identify transcriptomic and clinical predictors of anti-spike IgG titers in HD. Analyzing vaccination as an in vivo perturbation, our results warrant further characterization of the immune dysregulation of ESRD.

Funding: F30HD102093, F30HL151182, T32HL144909, R01HL138628. This research has been funded by the University of Illinois at Chicago Center for Clinical and Translational Science (CCTS) award UL1TR002003.

Keywords: COVID-19; RNA sequencing; binding antibodies; hemodialysis; human; infectious disease; medicine; microbiology; neutralizing antibodies; vaccine.


Conflict of interest statement

YC, KH, JL, CV, CA, MA, MG, CL, RE, YH, RC, NS, SW, SH, RG, BT, CS, MH, YC, JJ, WW, MR, PF, DP No competing interests declared, RN Received a grant from Janssen. The author has received consulting fees from Gilead and Viiv. The author has no other competing interests to declare

Figures

Figure 1.
Figure 1.. Results of differential gene expression and blood transcription module (BTM) analysis.
(A) Differentially expressed genes (DEGs) increased after second vaccination dose compared to first, and at early time points compared to day 7 (D7). DEGs are shown for maintenance hemodialysis (HD) with (n = 6) and without (n = 6) prior SARS-CoV-2 history. See Figure 1—figure supplement 1 for healthy control (HC) and HD data independent of SARS-CoV-2 history. The DESeq2 R package was used to identify genes that were differentially expressed at each time point after vaccination for each subject group (p<0.05, FDR-adjusted). (B) HC and HD with no SARS-CoV-2 history demonstrate distinct longitudinal enrichments of BTMs. Left: in HC, the most significantly enriched BTMs are shown (up to six) for day 1 (D1) and day 7 (D7) after each vaccination dose (V1, V2) (p<0.05, FDR-adjusted). Density plots for each BTM represent Wald statistics from DESeq2 analysis for each membership gene, thereby representing increased or decreased expression per gene at each time point compared to baseline (V1D0 or V2D0). Right: similarly in HD, the most significantly enriched BTMs for day 2 (D2) and day 7 (D7) are shown. (C) HD demonstrates diminished transitioning from innate to adaptive immune BTM enrichment after each vaccination dose. Percentages of BTMs in each BTM family with significant enrichment are shown at each time point after each vaccination dose (V1, V2) for day 1 (D1) and day 7 (D7) in HC, and day 2 (D2) and D7 for HD in subjects with no prior infection with SARS-CoV-2 (p<0.05, FDR-adjusted). Direction of enrichment was determined using the median Wald statistic from DESeq2 analysis for each BTM membership gene, thereby representing overall increased or decreased expression of membership genes at each time point compared to baseline (V1D0 or V2D0).
Figure 1—figure supplement 1.
Figure 1—figure supplement 1.. Differentially expressed genes (DEGs) increased after second vaccination dose compared to first, and at day 1 (D1, for healthy controls [HC]) and day 2 (D2, for maintenance hemodialysis [HD] compared to day 7 [D7]).
DEGs are shown for HC and HD regardless of SARS-CoV-2 history. Red color indicates upregulated DEGs and blue color indicates downregulated DEGs. The DESeq2 R package was used to identify genes that were differentially expressed at each time point after vaccination for each subject group (p<0.05, FDR-adjusted).
Figure 1—figure supplement 2.
Figure 1—figure supplement 2.. Hemodialysis (HD) patients without prior SARS-CoV-2 infection show increased myeloid activity at V1D7 and decreased metabolic activity at V2D7 compared to controls (HC).
The most differentially enriched blood transcription modules (BTMs) between HC and HD with no prior infection with SARS-CoV-2 are shown (p<0.05, FDR-adjusted) at V1D7 and at 1 wk after second vaccination dose (V2D7). Density plots for each BTM represent Wald statistics from DESeq2 analysis for each membership gene per BTM, with positive Wald statistics indicating increased expression in HC compared to HD.
Figure 1—figure supplement 3.
Figure 1—figure supplement 3.. Hemodialysis (HD) patients with prior SARS-CoV-2 infection show increased expression of innate and adaptive immune blood transcription modules (BTMs) post-vaccination.
The most significantly enriched BTMs are shown (up to six) for day 2 (D2) and day 7 (D7) after each vaccination dose (V1, V2) in HD with prior infection with SARS-CoV-2 (p<0.05, FDR-adjusted). Density plots for each BTM represent Wald statistics from DESeq2 analysis for each membership gene, thereby representing increased or decreased expression per gene at each time point compared to baseline (V1D0 or V2D0).
Figure 2.
Figure 2.. Antibodies significantly increasedin both healthy control (HC) and maintenance hemodialysis (HD) groups 1 wk after the second vaccination dose (p<0.001) and 6 mo after initial vaccination (p<0.001) with the BNT162b2 mRNA COVID-19 vaccine.
(A) Anti-spike IgG levels in HC and HD subjects with and without prior SARS-CoV-2 history before vaccination (V1D0), 1 wk after second vaccination dose (V2D7), and 6 mo after initial vaccination (M6). Higher anti-spike IgG at V2D7 was significantly predicted by higher pre-vaccination anti-spike IgG, being a member of HC, and younger age (p<0.01, p<0.05, p<0.05, respectively). Higher anti-spike IgG at M6 was significantly predicted by higher V2D7 anti-spike IgG (p<0.001). (B) Antibody neutralization activity (ID50) in controls and HD subjects with and without prior SARS-CoV-2 history at V1D0 and V2D7. Higher neutralization activity (ID50) at V2D7 was significantly predicted by higher pre-vaccination ID50, with no additional predictive value conferred by subject group.
Figure 3.
Figure 3.. Increased expression of multiple blood transcription modules (BTMs) at V2D2 is predictive of higher anti-spike IgG at V2D7.
Of 30 enriched BTMs at V2D2, increased expression of 18 BTMs is predictive of increased anti-spike IgG at V2D7 (p<0.05, FDR-corrected), controlling for SARS-CoV-2 history. Predictive pathways include innate immune, antigen presentation, and T cell pathways. The eigengenes (A) and linear models (B) for three example BTMs are shown.
Figure 4.
Figure 4.. Baseline ferritin level and post-V1 white blood cell count (WBC) are clinical predictors of post-V2 antibody responses in maintenance hemodialysis (HD) patients.
(A) Ferritin levels associated with lowest all-cause mortality predict the development of higher anti-spike IgG after vaccination at V2D7 (p<0.01) and M6 (not shown, p<0.05) in maintenance HD patients. Dashed vertical lines indicate the intermediate range of ferritin (200–1200 ng/ml) associated with lowest all-cause mortality (Kalantar-Zadeh et al., 2005). (B) Increased WBC after first vaccination dose is predictive of anti-spike IgG titers after vaccination at V2D7 (p<0.01) and M6 (not shown, p<0.05) in maintenance HD patients. Points with negative log-fold change of white blood cell counts (LFC(WBC)) and positive LFC(WBC) represent a decrease and increase, respectively, in WBC from baseline labs.

Update of

Similar articles

Cited by

References

    1. Agur T, Ben-Dor N, Goldman S, Lichtenberg S, Herman-Edelstein M, Yahav D, Rozen-Zvi B, Zingerman B. Antibody response to mRNA SARS-CoV-2 vaccine among dialysis patients - a prospective cohort study. Nephrology, Dialysis, Transplantation. 2021;36:1347–1349. doi: 10.1093/ndt/gfab155. - DOI - PMC - PubMed
    1. Anand S, Montez-Rath ME, Han J, Garcia P, Cadden L, Hunsader P, Kerschmann R, Beyer P, Dittrich M, Block GA, Boyd SD, Parsonnet J, Chertow GM. Antibody response to COVID-19 vaccination in patients receiving dialysis. medRxiv. 2021 doi: 10.1101/2021.05.06.21256768. - DOI - PMC - PubMed
    1. Anderson P, Nagler-Anderson C, O’Brien C, Levine H, Watkins S, Slayter HS, Blue ML, Schlossman SF. A monoclonal antibody reactive with A 15-kDa cytoplasmic granule-associated protein defines A subpopulation of CD8+ T lymphocytes. Journal of Immunology. 1990;144:574–582. - PubMed
    1. Attias P, Sakhi H, Rieu P, Soorkia A, Assayag D, Bouhroum S, Nizard P, El Karoui K. Antibody response to the BNT162b2 vaccine in maintenance hemodialysis patients. Kidney International. 2021;99:1490–1492. doi: 10.1016/j.kint.2021.04.009. - DOI - PMC - PubMed
    1. Baden LR, El Sahly HM, Essink B, Kotloff K, Frey S, Novak R, Diemert D, Spector SA, Rouphael N, Creech CB, McGettigan J, Khetan S, Segall N, Solis J, Brosz A, Fierro C, Schwartz H, Neuzil K, Corey L, Gilbert P, Janes H, Follmann D, Marovich M, Mascola J, Polakowski L, Ledgerwood J, Graham BS, Bennett H, Pajon R, Knightly C, Leav B, Deng W, Zhou H, Han S, Ivarsson M, Miller J, Zaks T. Efficacy and Safety of the mRNA-1273 SARS-CoV-2 Vaccine. New England Journal of Medicine. 2021;384:403–416. doi: 10.1056/NEJMoa2035389. - DOI - PMC - PubMed

Publication types

MeSH terms

Associated data