. 2024 Sep;124(9):2765-2775.
doi: 10.1007/s00421-024-05485-4. Epub 2024 Apr 24.

Baroreflex dynamics during the rest to exercise transient in acute normobaric hypoxia in humans

Affiliations

Baroreflex dynamics during the rest to exercise transient in acute normobaric hypoxia in humans

Anna Taboni et al. Eur J Appl Physiol. 2024 Sep.

Abstract

Purpose: We hypothesised that during a rest-to-exercise transient in hypoxia (H), compared to normoxia (N), (i) the initial baroreflex sensitivity (BRS) decrease would be slower and (ii) the fast heart rate (HR) and cardiac output (CO) response would have smaller amplitude (A1) due to lower vagal activity in H than N.

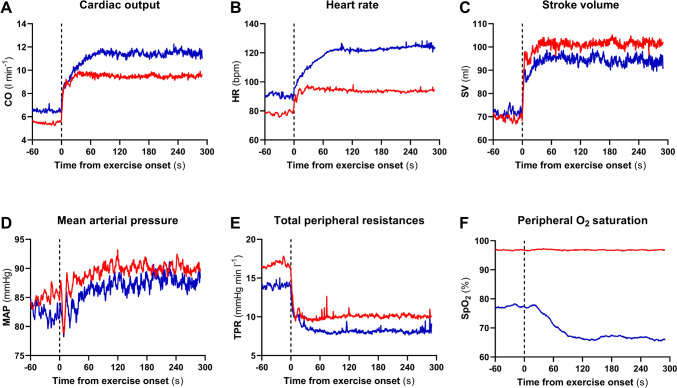
Methods: Ten participants performed three rest-to-50 W exercise transients on a cycle-ergometer in N (ambient air) and three in H (inspired fraction of O2 = 0.11). R-to-R interval (RRi, by electrocardiography) and blood pressure profile (by photo-plethysmography) were recorded non-invasively. Analysis of the latter provided mean arterial pressure (MAP) and stroke volume (SV). CO = HR·SV. BRS was calculated by modified sequence method.

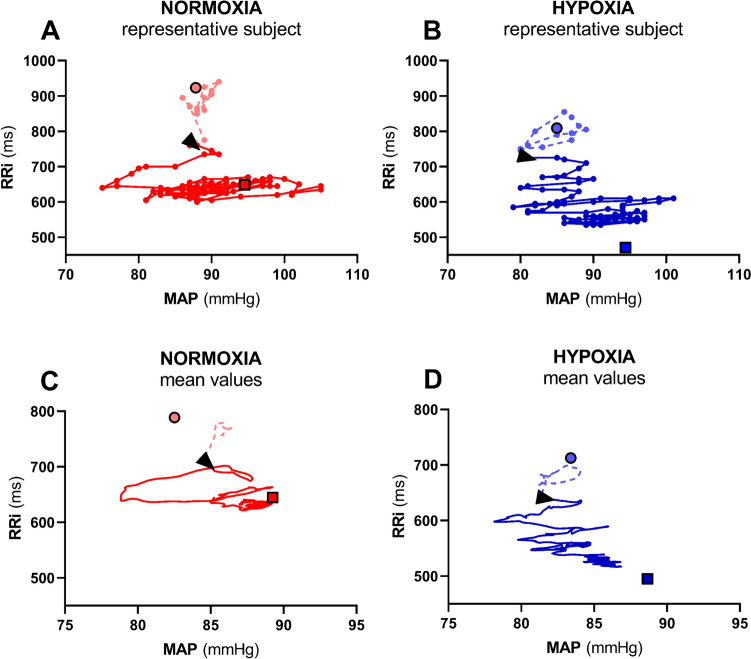
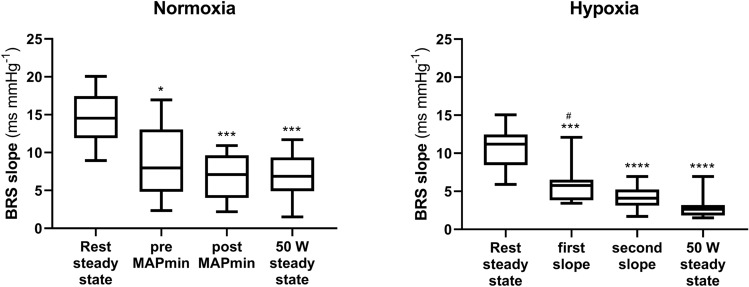
Results: Upon exercise onset in N, MAP fell to a minimum (MAPmin) then recovered. BRS decreased immediately from 14.7 ± 3.6 at rest to 7.0 ± 3.0 ms mmHg-1 at 50 W (p < 0.01). The first BRS sequence detected at 50 W was 8.9 ± 4.8 ms mmHg-1 (p < 0.05 vs. rest). In H, MAP showed several oscillations until reaching a new steady state. BRS decreased rapidly from 10.6 ± 2.8 at rest to 2.9 ± 1.5 ms mmHg-1 at 50 W (p < 0.01), as the first BRS sequence at 50 W was 5.8 ± 2.6 ms mmHg-1 (p < 0.01 vs. rest). CO-A1 was 2.96 ± 1.51 and 2.31 ± 0.94 l min-1 in N and H, respectively (p = 0.06). HR-A1 was 7.7 ± 4.6 and 7.1 ± 5.9 min-1 in N and H, respectively (p = 0.81).

Conclusion: The immediate BRS decrease in H, coupled with similar rapid HR and CO responses, is compatible with a withdrawal of residual vagal activity in H associated with increased sympathetic drive.

Keywords: Arterial baroreflex; Humans; Sequence method; Vagal withdrawal.


Conflict of interest statement

The authors declare that they have no conflict of interest.

Figures

Fig. 1
Fig. 1
Time course of the cardiac output (CO), heart rate (HR), stroke volume (SV), mean arterial pressure (MAP), total peripheral resistances (TPR), and peripheral blood oxygen saturation (SpO2) during the rest to 50 W exercise transient in normoxia (red line) and in hypoxia (blue line). Mean values from all subjects (n = 10). The time scale refers to the time elapsed from the exercise onset
Fig. 2
Fig. 2
Contour plots of the relationship between R-to-R interval (RRi) and mean arterial pressure (MAP) from 10 s before to 60 s after exercise onset (black arrowhead). Panels A and B: beat-by-beat value from a representative subject with a time shift of 1 beat applied between MAP and RRi. Panels C and D: mean values obtained from all rest-to-exercise transients (n = 30) with a time shift of 1 beat applied between MAP and RRi. In all panels, dots and squares represent, respectively, rest and 50 W steady states
Fig. 3
Fig. 3
Tukey representation of the baroreflex sensitivity (BRS) measured at different time points in normoxia and in hypoxia. *: significantly different vs. rest steady state (**: p < 0.01; ***: p < 0.001; ****: p < 0.0001); #: significantly different vs. exercise steady state (p < 0.05). MAPmin: minimum mean arterial pressure

References

    1. Adami A, Fagoni N, Ferretti G (2014) The Q-VO2 diagram: an analytical interpretation of oxygen transport in arterial blood during exercise in humans. Respir Physiol Neurobiol 193:55–61. 10.1016/j.resp.2014.01.007 10.1016/j.resp.2014.01.007 - DOI - PubMed
    1. Barstow TJ, Molé PA (1987) Simulation of pulmonary O2 uptake during exercise transients in humans. J Appl Physiol 63:2253–2261. 10.1152/jappl.1987.63.6.2253 10.1152/jappl.1987.63.6.2253 - DOI - PubMed
    1. Bertinieri G, Di Rienzo M, Cavallazzi A et al (1988) Evaluation of baroreceptor reflex by blood pressure monitoring in unanesthetized cats. Am J Physiol 254:H377–H383. 10.1152/ajpheart.1988.254.2.H377 10.1152/ajpheart.1988.254.2.H377 - DOI - PubMed
    1. Boushel R, Calbet J-AL, Rådegran G et al (2001) Parasympathetic neural activity accounts for the lowering of exercise heart rate at high altitude. Circ 104:1785–1791. 10.1161/hc4001.09704010.1161/hc4001.097040 - DOI - PubMed
    1. Bringard A, Adami A, Moia C, Ferretti G (2014) A new interpolation-free procedure for breath-by-breath analysis of oxygen uptake in exercise transients. Eur J Appl Physiol 114:1983–1994. 10.1007/s00421-014-2920-z 10.1007/s00421-014-2920-z - DOI - PubMed