. 2024 Jun 3;223(6):e202306150.
doi: 10.1083/jcb.202306150. Epub 2024 Apr 24.

Transcription factor Nrf1 regulates proteotoxic stress-induced autophagy

Affiliations

Transcription factor Nrf1 regulates proteotoxic stress-induced autophagy

Madison A Ward et al. J Cell Biol. .

Abstract

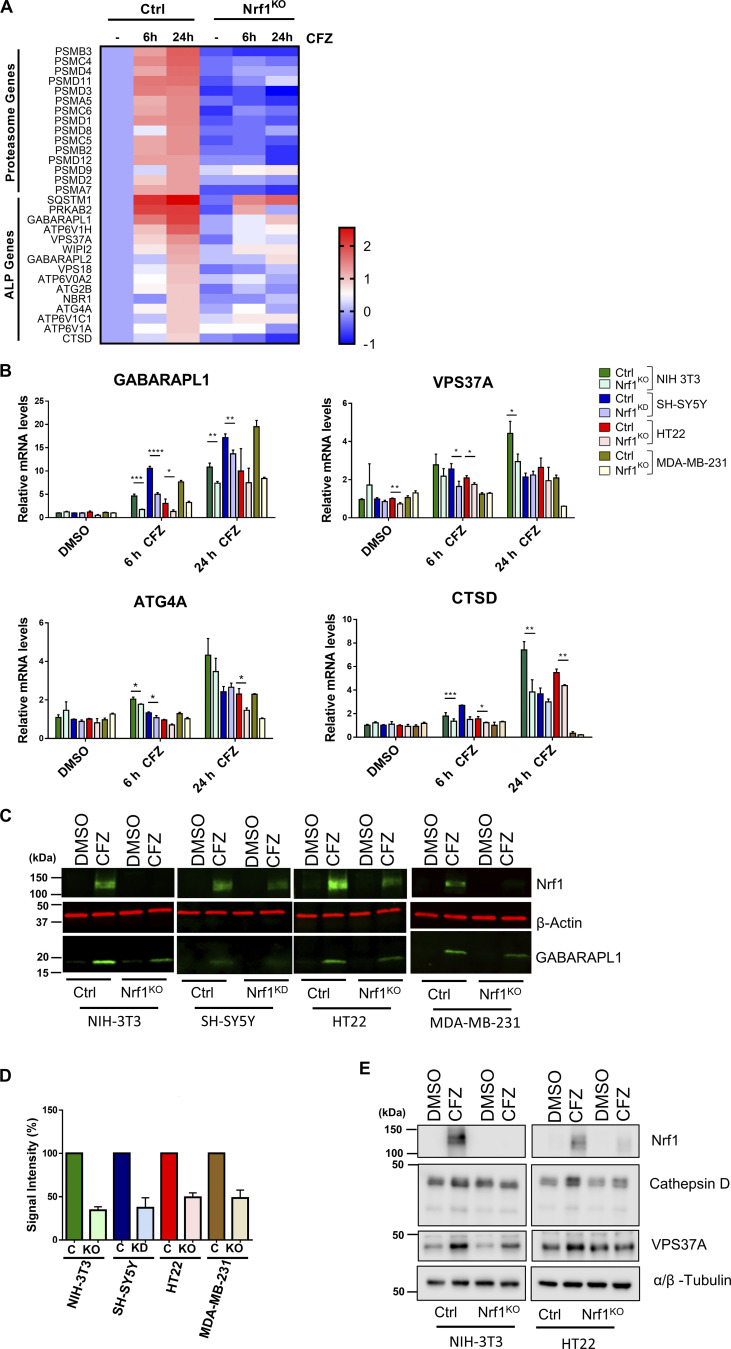
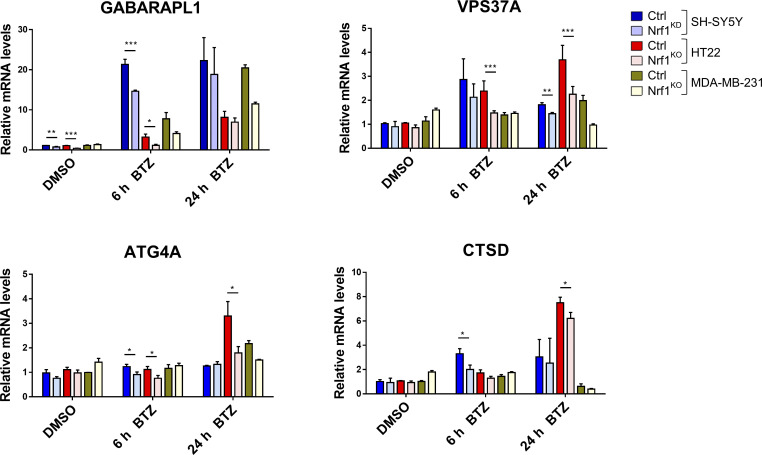
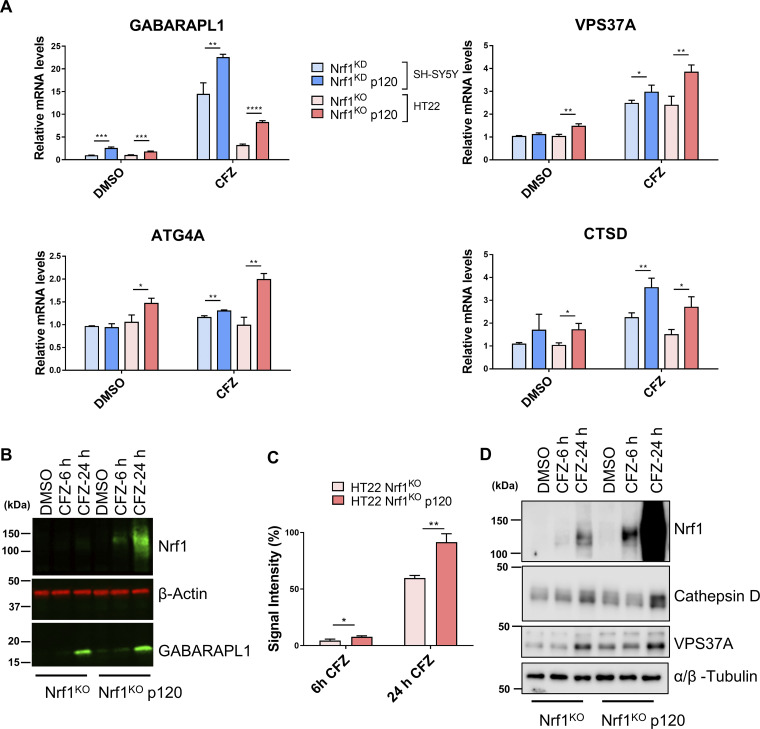
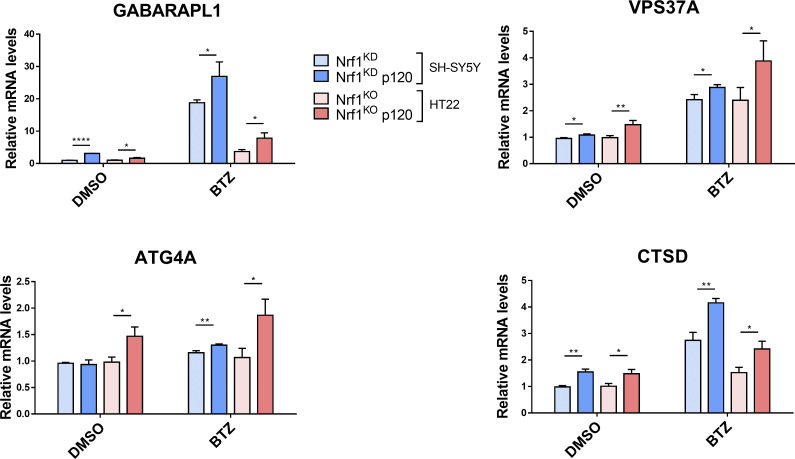
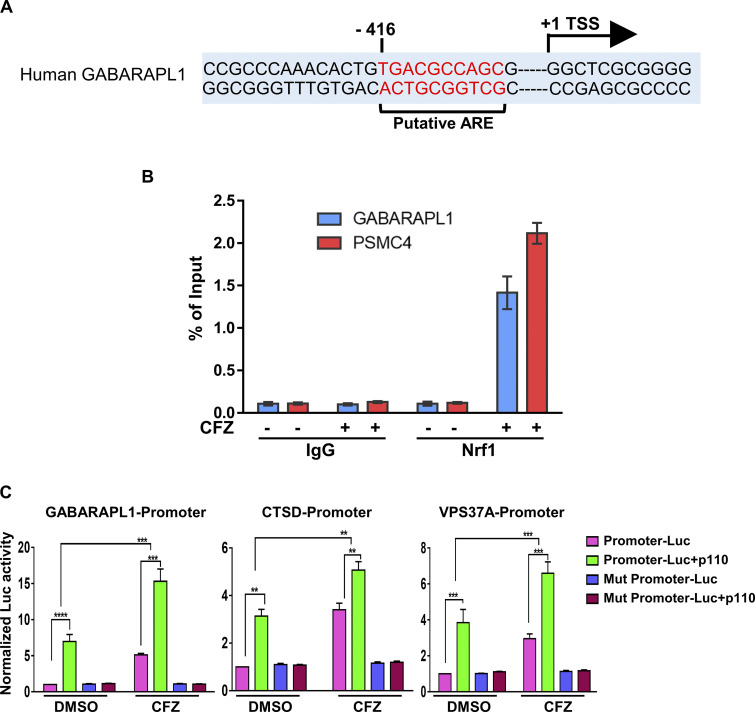
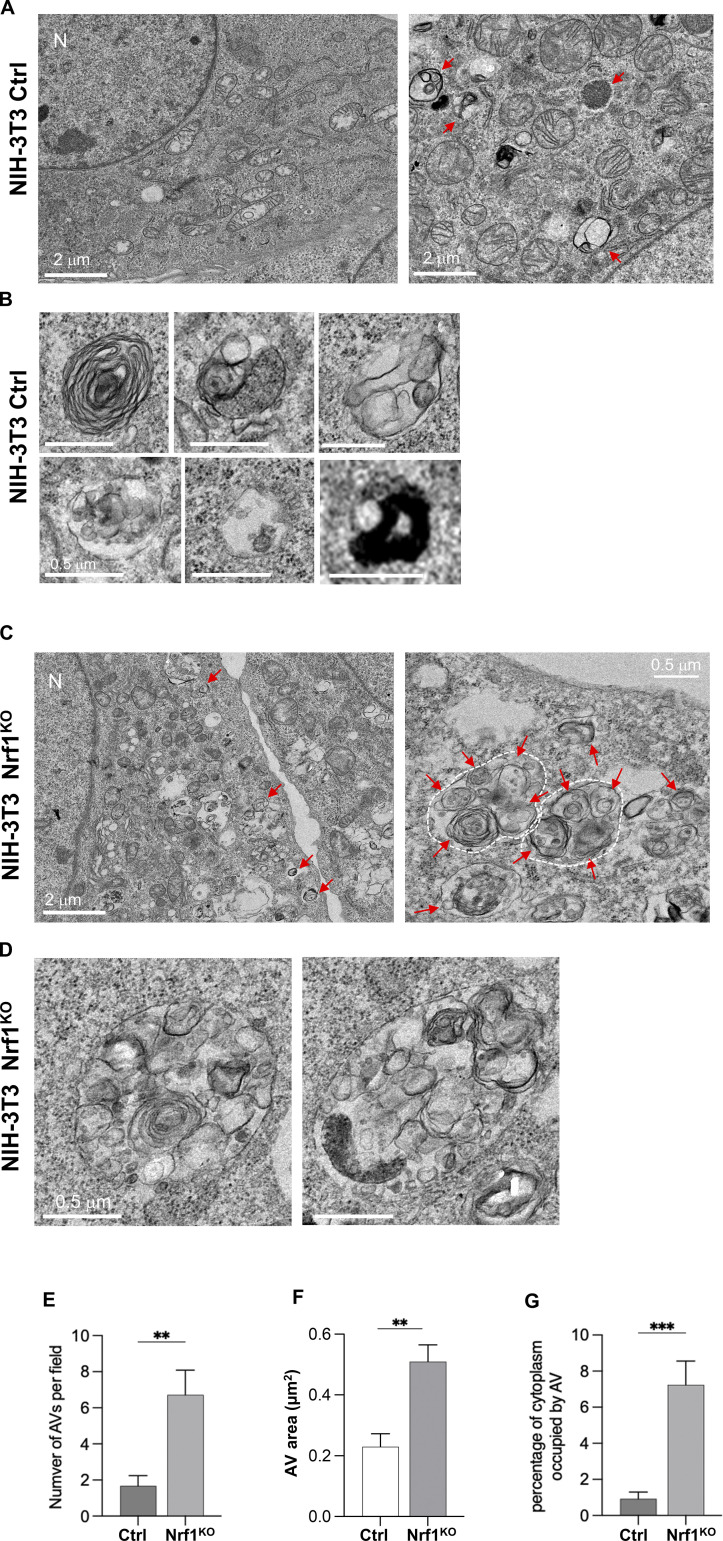
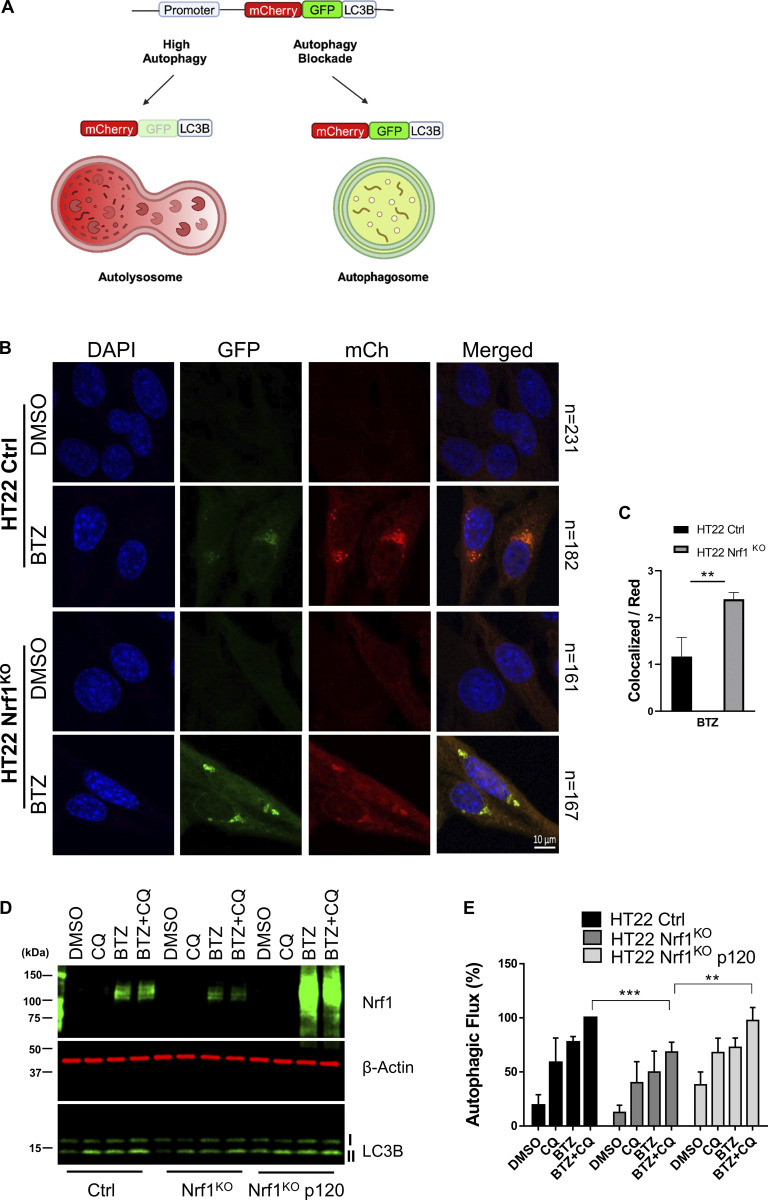
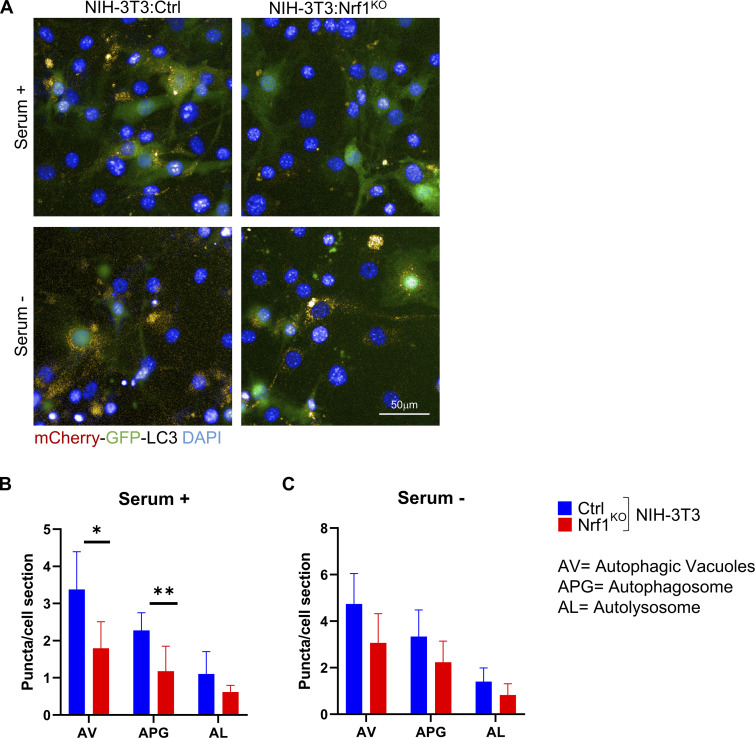
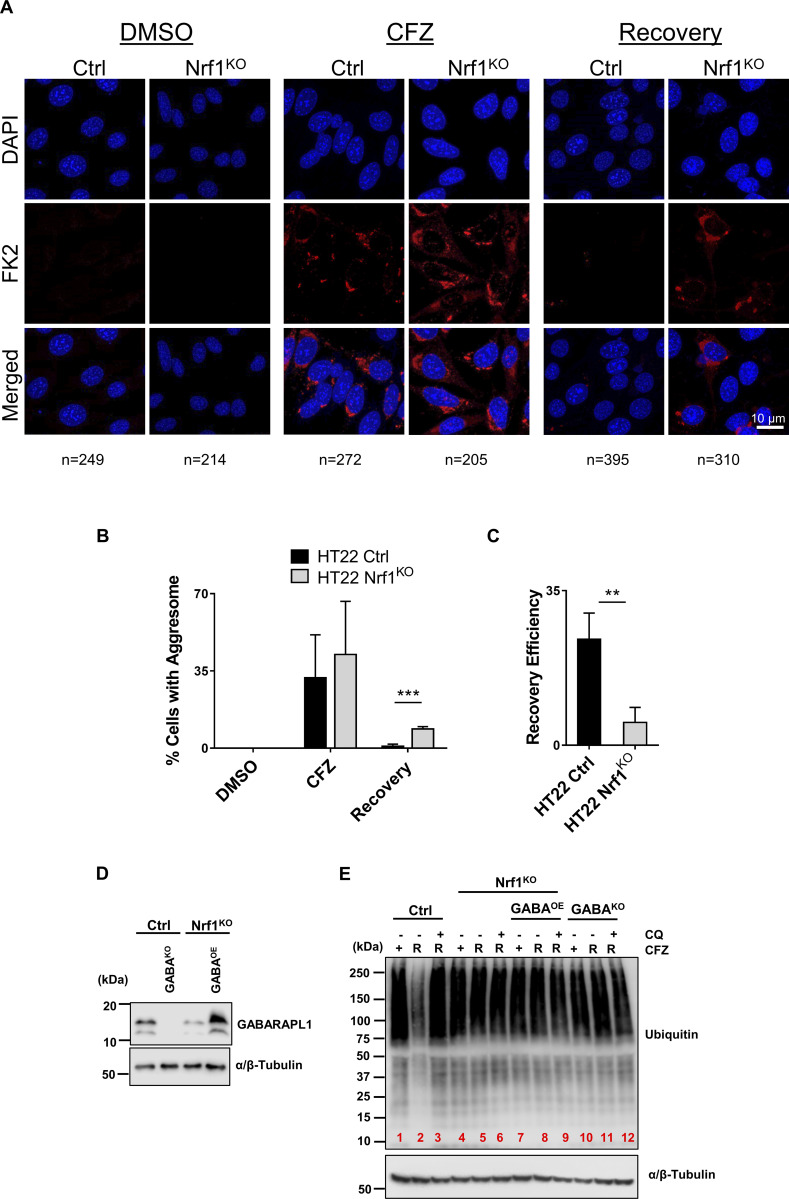
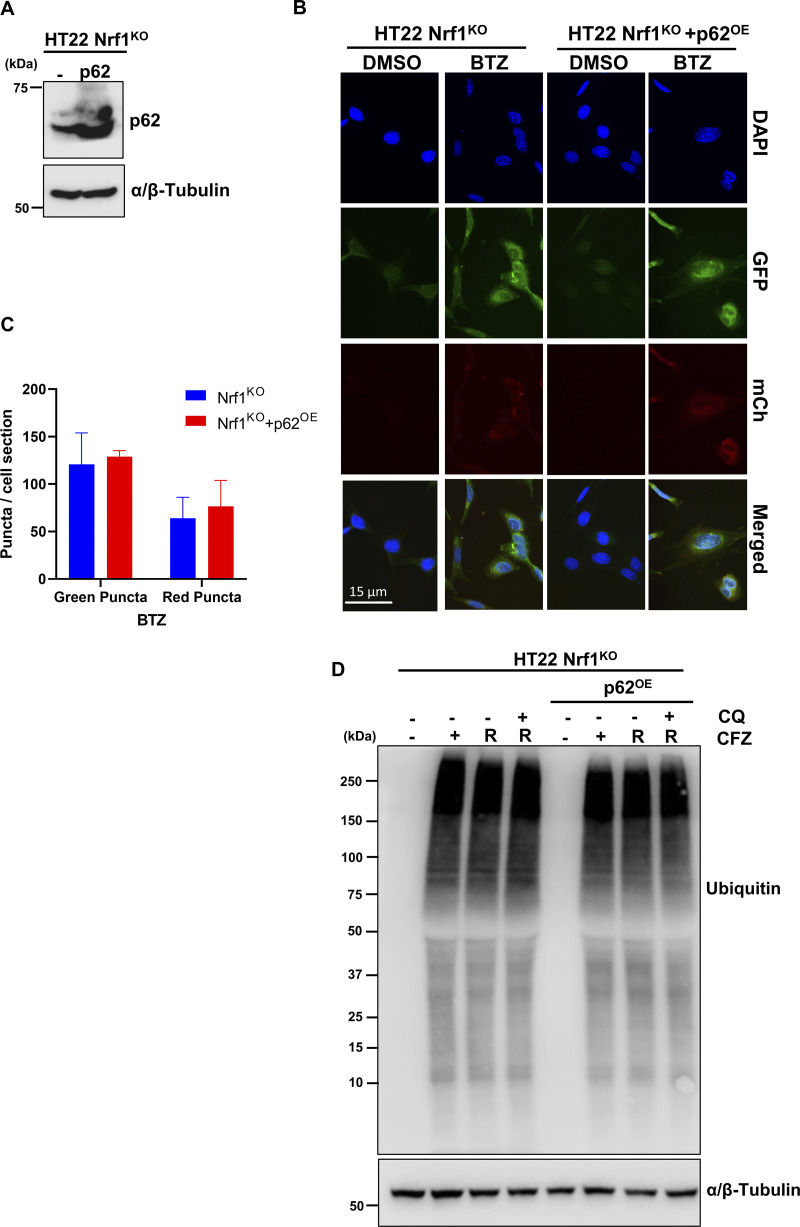
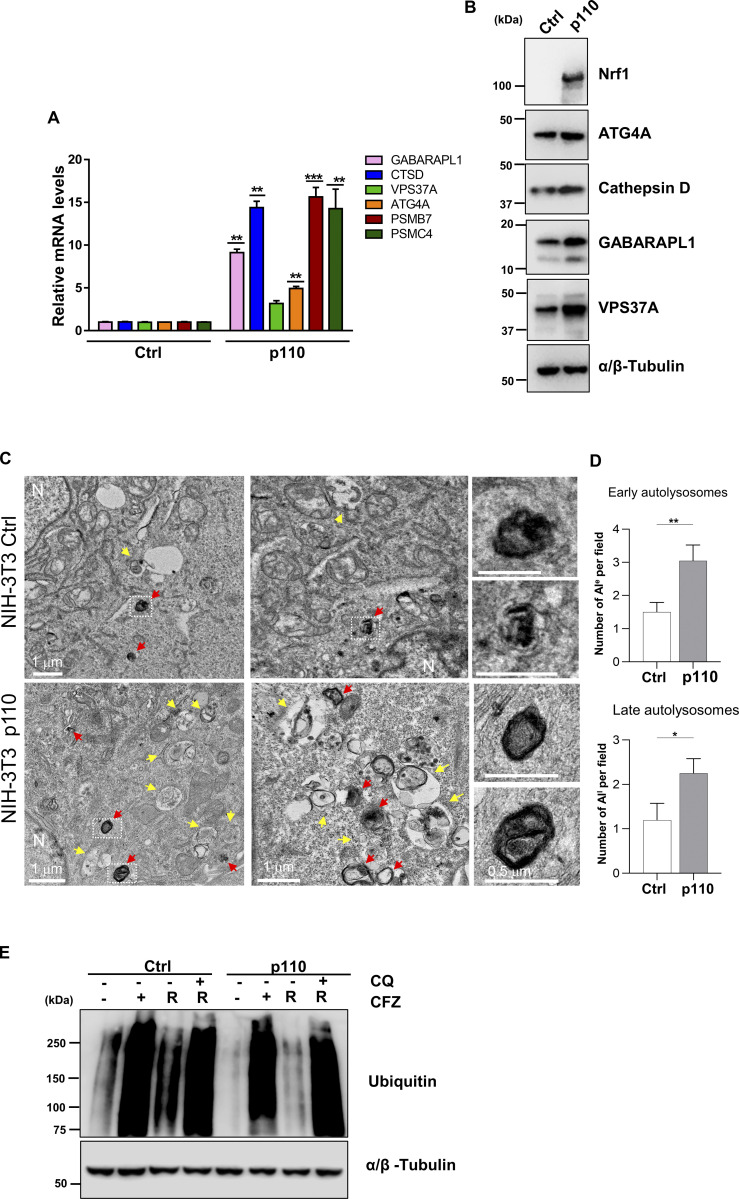
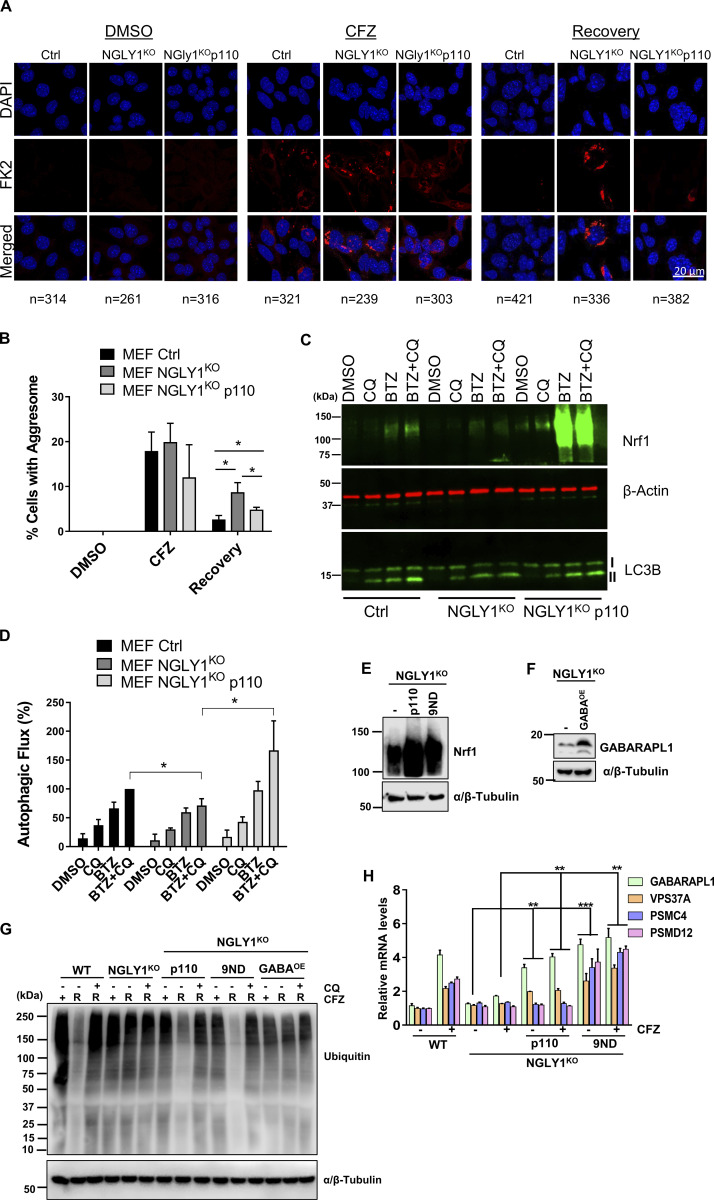
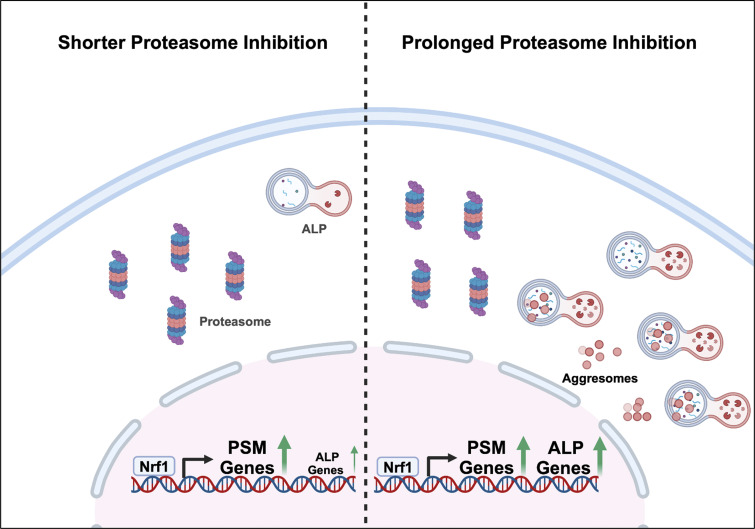
Cells exposed to proteotoxic stress invoke adaptive responses aimed at restoring proteostasis. Our previous studies have established a firm role for the transcription factor Nuclear factor-erythroid derived-2-related factor-1 (Nrf1) in responding to proteotoxic stress elicited by inhibition of cellular proteasome. Following proteasome inhibition, Nrf1 mediates new proteasome synthesis, thus enabling the cells to mitigate the proteotoxic stress. Here, we report that under similar circumstances, multiple components of the autophagy-lysosomal pathway (ALP) were transcriptionally upregulated in an Nrf1-dependent fashion, thus providing the cells with an additional route to cope with proteasome insufficiency. In response to proteasome inhibitors, Nrf1-deficient cells displayed profound defects in invoking autophagy and clearance of aggresomes. This phenomenon was also recapitulated in NGLY1 knockout cells, where Nrf1 is known to be non-functional. Conversely, overexpression of Nrf1 induced ALP genes and endowed the cells with an increased capacity to clear aggresomes. Overall, our results significantly expand the role of Nrf1 in shaping the cellular response to proteotoxic stress.


Conflict of interest statement

Disclosures: The authors declare no competing interests exist.

Figures

Figure 1.
Figure 1.
Nrf1 regulates the expression of ALP genes upon proteasome inhibition. (A) Heatmap analysis of RNA-seq data (GSE144817) obtained from wild-type (control; ctrl) and Nrf1KO NIH-3T3 cells treated with either DMSO or 200 nM CFZ for 6 or 24 h. Log2 fold changes are shown. (B) qRT-PCR analysis of NIH-3T3, SH-SY5Y, HT22, and MDA-MB-231 cells that are control (Ctrl) or Nrf1-depleted (KO or KD) were treated with either DMSO or 200 nM CFZ for 6 or 24 h. Expression levels of GABARAPL1, VPS37A, ATG4A, and CTSD were analyzed using gene-specific primers as shown. 18s rRNA or GAPDH levels were used for normalization. (C) Western blot analysis of GABARAPL1 protein in NIH-3T3, SH-SY5Y, HT22, and MDA-MB-231 cells treated with either DMSO or 200 nM CFZ for 24 h. β-Actin was used for loading control. (D) Quantification of GABARAPL1 signal intensity, normalized to β-Actin signal. (E) Western blot analysis of Cathepsin D and VPS37A proteins in control and Nrf1KO NIH-3T3 and HT22 cells treated with either DMSO or 200 nM CFZ for 24 h. α/β-Tubulin was used as the loading control. Three biological replicates for each cell line were used to perform qRT-PCR and Western blotting. P values were calculated by Student’s t test. *<0.05, **<0.005, ***<0.0005, ****<0.00005. Source data are available for this figure: SourceData F1.
Figure S1.
Figure S1.
Nrf1 regulates the expression of ALP genes upon proteasome inhibition. qRT-PCR analysis of SH-SY5Y, HT22, and MDA-MB-231 cells that are controls (Ctrl) or Nrf1-depleted (KO or KD) were treated with either DMSO or 200 nM bortezomib (BTZ) for 6 or 24 h. Expression levels of GABARAPL1, VPS37A, ATG4A, and CTSD were analyzed using gene specific primers as shown. 18S rRNA or GAPDH levels were used for normalization.
Figure 2.
Figure 2.
Adding back Nrf1 in Nrf1-deficient cells rescues suppressed expression of ALP genes upon proteasome inhibition. (A) SH-SY5Y-Nrf1KD and HT22-Nrf1KO cells were infected with Nrf1(p120). Both SH-SY5Y-Nrf1KD, p120 rescue, and HT22-Nrf1KO, p120 rescue cells were treated with 200 nM CFZ for 6 h and then analyzed by qRT-PCR to measure the expression levels of indicated genes and mRNA levels of 18s rRNA or GAPDH was used for normalization. (B) Western blot analysis of GABARAPL1 and Nrf1 in HT22-Nrf1KO p120 rescue cells treated with either DMSO or 200 nM CFZ for 6 and 24 h. β-Actin was used for loading control. (C) Quantification of GABARAPL1 signal intensity, normalized to β-Actin signal. (D) Western blot analysis of Cathepsin D and VPS37A in HT22-Nrf1KO and p120 rescue cells treated with either DMSO or 200 nM CFZ for 6 and 24 h. α/β-Tubulin was used as a loading control. Three biological replicates for each cell line were used to perform qRT-PCR and Western blotting. P values were calculated by Student’s t test. *<0.05, **<0.005, ***<0.0005, ****<0.00005. Source data are available for this figure: SourceData F2.
Figure S2.
Figure S2.
Adding back Nrf1 in Nrf1-deficient cells rescues suppressed expression of ALP genes upon proteasome inhibition. SH-SY5Y-Nrf1KD and HT22-Nrf1KO cells were infected with Nrf1(p120). Both SH-SY5Y-Nrf1KD, p120 rescue and HT22-Nrf1KO, p120 rescue cells were treated with 200 nM BTZ for 6 h and then analyzed by qRT-PCR to measure the expression levels of indicated genes, and mRNA levels of 18S rRNA levels was used for normalization.
Figure 3.
Figure 3.
Nrf1 shows binding to promoter regions of autophagy genes. (A) Putative ARE sequence close to the transcription start site (+1) of human GABARAPL1. ARE sequence and transcription start site are marked. (B) Chromatin immunoprecipitation of GABARAPL1 and PSMC4 (proteasome gene; positive control) in DMSO, CFZ (200 nM/6 h)-treated SH-SY5Y cells were carried out with IgG, Nrf1 antibodies. qPCR analysis was completed with primers flanking the putative ARE sequences (Nrf1 binding) in the promoter region. Nrf1 binding to each gene was expressed as a percentage of the input. Error bars denote mean ± SD (n = 3 biological replicates). (C) HEK293T cells were transfected with indicated promoter-Luc plasmids, pRL-TK either alone or in combination with Nrf1-p110 for 48 h, followed by CFZ treatment (200 nM; 16 h). Normalized luciferase activities relative to the promoter-luc treated with DMSO are shown. Error bars denote mean ± SD. P values were calculated by two-way ANOVA. *<0.05, **0.005, ***<0.0005, ****<0.00005. (n = 3 biological replicates).
Figure 4.
Figure 4.
Nrf1KO cells display defective autophagy in response to proteasome inhibition. (A and B) Transmission electron microscopy (TEM) images of NIH-3T3 control (ctrl) cells treated with 200 nM CFZ for 20 h with B showing zoom insets. (C and D) TEM images of Nrf1KO cells treated with 200 nM CFZ for 20 h with D showing zoom insets. Multiautophagosomal structures (white dash outlines) are visible in the Nrf1KO cells. N: nucleus; red arrows: autophagic vacuoles (AV). (E–G) Quantification shows the number of AV per field in E, the area of AV in F, and the percentage of cytoplasm occupied by AV in G. P values were calculated by Student’s t test. **P < 0.01, ***P < 0.001, n = 9–10 fields.
Figure 5.
Figure 5.
Nrf1 can induce autophagy upon proteasome inhibition. (A) Schematic representation of the mCherry-GFP-LC3B fluorescence reporters. (B) Representative confocal microscopy images of HT22 wild-type (control; ctrl) and Nrf1KO cells, stably expressing mCh-GFP-LC3B construct for detecting autophagic flux. Cells were treated either with DMSO or 200 nM BTZ for 20 h. The scale bar represents 10 μm. (C) The ratio of colocalized puncta signal to red puncta signal and normalizing this value to total cell number in each condition is shown. Number of cells analyzed in each sample is noted next to the images in B. (D) Western blot analysis of Nrf1 and LC3B in HT22-ctrl, Nrf1KO, Nrf1KO p120 cells after treatment with either DMSO, 200 nM BTZ (20 h), 60 μM CQ (3 h), or both BTZ (20 h) and CQ (3 h). β-Actin was used as a loading control. (E) Percent autophagic flux determined by normalizing LC3B-II levels to β-Actin levels from E. Three biological replicates for both microscopy and Western blotting were used, and P values were calculated by Student’s t test. **<0.05, **<0.005, ***<0.0005. Source data are available for this figure: SourceData F5.
Figure S3.
Figure S3.
Nrf1KO cells display defects in basal and starvation-induced autophagy. NIH-3T3 cells that are wild-type control (ctrl) or Nrf1KO expressing the tandem reporter mcherry-GFP-LC3B were incubated in serum-supplemented (serum +) or serum-deprived (serum −) media for 6 h. The number of red puncta (autophagic vacuoles; AV), yellow puncta (autophagosomes; APG), and red only puncta (autolysosomes; AL) were quantified as the average number of fluorescent puncta per cell. (A–C) Representative images are shown in A, and the quantification of puncta is shown in B and C. Scale bar represents 50 μm. Differences were significant for *P < 0.05 and **P < 0.001.
Figure 6.
Figure 6.
Nrf1 is required to clear aggresomes that are triggered by proteasome inhibition. (A) HT22 wild-type (control; ctrl) and Nrf1KO cells were treated with 50 nM CFZ for 20 h, then were washed and incubated with fresh media for another 20 h (Recovery period). Aggresomes were detected by confocal microscopy using FK2 stain. Scale bar represents 10 μm. (B) Percentage of cells with aggresomes under each condition (DMSO, CFZ and recovery) for both ctrl and Nrf1KO cells are plotted, based on confocal microscopy analysis. The number of cells analyzed in each sample is noted underneath the images in A. (C) Recovery efficiency of ctrl and Nrf1KO cells was calculated by dividing CFZ values by recovery values of ctrl and Nrf1KO cells in B. (D) Western blot analysis of GABARAPL1 overexpression in Nrf1KO cells. α/β-Tubulin was used as the loading control. (E) HT22 control (EV), GABAKO (GABARAPL1 knockout), Nrf1KO, Nrf1KO GABAOE (GABARAPL1 overexpression) cells were treated with 50 nM CFZ for 20 h, then washed, and either treated with 60 μM CQ or fresh complete media for a 20 h recovery (R). The samples were analyzed by immunoblotting with anti-ubiquitin antibody. α/β-Tubulin was used as the loading control. Three biological replicates were used for confocal microscopy analysis. P values were calculated by Student’s t test. **<0.05, ***<0.005. Source data are available for this figure: SourceData F6.
Figure S4.
Figure S4.
p62 over expression does not rescue aggresome clearance in Nrf1KO cells. (A) Confirmation Western blot for p62 protein expression in HT22 Nrf1KO and HT22 Nrf1KO +p62OE overexpression cells. α/β-Tubulin was used for loading control. (B) Representative images for autophagic flux in HT22 mCherry-GFP-LC3B Nrf1KO and mCherry-GFP-LC3B Nrf1KO +p62OE cells treated for 20 h with DMSO or 200 nM BTZ. Images taken at 63×. Scale bar represents 15 μm. (C) Quantification of red and green puncta from BTZ treatment in panel B, signal is normalized to total cell number for each condition (Nrf1KO n = 52 fields, Nrf1KO + p62OE n = 45 fields). (D) HT22 Nrf1KO and Nrf1KO+ p62OE cells were treated with 50 nM CFZ for 20 h, then washed and either treated with 60 μM CQ or fresh complete media for a 20 h recovery (R). Western blot analysis of Ubiquitin after treatment and recovery, α/β-Tubulin was used for loading control. (n = 3 biological replicates). Error bars denote mean ± SD. Source data are available for this figure: SourceData FS4.
Figure 7.
Figure 7.
Nrf1 is sufficient for induction of autophagy. (A) qRT-PCR analysis of GABARAPL1, CTSD, VPS37A, ATG4A, PSMB7, and PSMC4 in NIH-3T3 control (empty vector; EV) and p110 overexpressing cells. 18s rRNA level was used for normalization. (B) Western blot analysis of Nrf1, ATG4A, Cathepsin D, GABARAPL1, and VPS37A in NIH-3T3 control and p110 overexpressing cells. α/β-Tubulin was used as the loading control. (C) TEM images of NIH-3T3 control (Ctrl) and p110 overexpressing cells. N: nucleus. Yellow arrows: early autolysosomes (ALe). Red arrows: late autolysosomes (ALl). Zoom inset shows late autolysosomes. (D) Quantification shows the number of ALe and ALl per field. (E) NIH-3T3 control (EV) and p110 cells were treated with 50 nM CFZ for 20 h then washed and either treated with 60 μM CQ or fresh complete media for a 20 h recovery (R). Western blot analysis of Ubiquitin after treatment and recovery, α/β-Tubulin was used for loading control. (n = 3 biological replicates). Error bars denote mean ± SD. P values for qRT-PCR were calculated by two-way ANOVA, *<0.05, **0.005, ***<0.0005. P values for TEM were calculated by Student’s t test. *P < 0.05, **P < 0.01, n = 20 fields. Source data are available for this figure: SourceData F7.
Figure 8.
Figure 8.
Deficiency of NGLY1 causes inhibition of compensatory autophagy and aggrephagy, which can be rescued by transcriptionally active Nrf1. (A) Confocal images of FK2 labeled MEF ctrl, NGLY1KO, and NGLY1KO p110 cells after treating them with DMSO or 25 nM CFZ for 20 h. Recovery samples were washed out after CFZ treatment and incubated in fresh complete media for 20 h. Scale bar represents 20 μm. (B) Analysis of the percentage of cells with aggresomes under each condition from (5A) are plotted, based on the confocal microscopy analysis. Number of cells analyzed in each sample is noted underneath the images in B. (C) Western blot analysis of LC3B, and Nrf1 in MEF-ctrl, NGLY1KO, and NGLY1KO cells expressing p110 construct treated with DMSO, 200 nM BTZ (20 h), 60 μM CQ (3 h) or both BTZ (20 h) and CQ (3 h). β-Actin was used as a loading control. (D) Percent autophagic flux after normalizing LC3B-II levels to β-Actin levels from 8C. (E) Confirmation Western blot for Nrf1 protein expression in MEF NGLY1KO, NGLY1KO p110 overexpression, and NGLY1KO 9ND overexpression cells treated with CFZ (200 nM/4 h). α/β-Tubulin was used as the loading control. (F) Confirmation Western blot for GABARAPL1 protein expression in MEF NGLY1KO, and NGLY1KO GABARAPL1 over expression cells (GABAOE) cells. α/β-Tubulin was used for loading control. (G) MEF control (WT), NGLY1KO, NGLY1KO p110, and NGLY1KO 9ND cells were treated with 50 nM CFZ for 20 h, then washed and either treated with 60 μM CQ or fresh complete media for a 20 h recovery (R). Western blot analysis of ubiquitin after treatment and recovery, α/β-Tubulin was used for loading control. (H) MEF control (WT), NGLY1KO, NGLY1KO p110, and NGLY1KO p110-9ND cells were treated with 200 nM CFZ for 20 h. qRT-PCR analysis of ATG4A, GABARAPL1, CTSD, VPS37A, PSMD12, and PSMC4, mRNA levels were normalized to 18s rRNA. (n = 3 biological replicates). Error bars denote mean ± SD. Three biological replicates for qRT-PCR, microscopy and Western blotting were used. P values were calculated by either Student’s t test or two-way ANOVA. *<0.05, **<0.005, ***<0.0005 Source data are available for this figure: SourceData F8.
Figure 9.
Figure 9.
Dual regulation of proteasome and ALP by Nrf1. Protein degradation pathways, the ubiquitin proteasome system (UPS), and the autophagy–lysosomal pathway (ALP), are essential for maintaining proteostasis in the cell. During proteotoxic stress or when the proteasome is inhibited, Nrf1 upregulates both protein degradation pathways in a time-dependent manner. With shorter proteasome inhibition, shown on the left, proteasome (PSM) genes are robustly induced. However, after prolonged proteasome inhibition, shown on the right, there is an increase in aggresomes, which are not cleared through the UPS. This longer inhibition results in an increase in upregulation of multiple ALP genes, alongside the PSM genes, to clear the aggresomes. This allows the cell to maintain proteostasis and promote cell survival.

Similar articles

Cited by

References

    1. Bao, W., Gu Y., Ta L., Wang K., and Xu Z.. 2016. Induction of autophagy by the MG-132 proteasome inhibitor is associated with endoplasmic reticulum stress in MCF-7 cells. Mol. Med. Rep. 13:796–804. 10.3892/mmr.2015.4599 - DOI - PubMed
    1. Bard, J.A.M., Goodall E.A., Greene E.R., Jonsson E., Dong K.C., and Martin A.. 2018. Structure and function of the 26S proteasome. Annu. Rev. Biochem. 87:697–724. 10.1146/annurev-biochem-062917-011931 - DOI - PMC - PubMed
    1. Bauer, B., Martens S., and Ferrari L.. 2023. Aggrephagy at a glance. J. Cell Sci. 136:jcs260888. 10.1242/jcs.260888 - DOI - PubMed
    1. Biswas, M., and Chan J.Y.. 2010. Role of Nrf1 in antioxidant response element-mediated gene expression and beyond. Toxicol. Appl. Pharmacol. 244:16–20. 10.1016/j.taap.2009.07.034 - DOI - PMC - PubMed
    1. Dikic, I. 2017. Proteasomal and autophagic degradation systems. Annu. Rev. Biochem. 86:193–224. 10.1146/annurev-biochem-061516-044908 - DOI - PubMed

Publication types