

Development and validation of a nomogram for predicting 28-day mortality in patients with ischemic stroke
- PMID: 38656987
- PMCID: PMC11042708
- DOI: 10.1371/journal.pone.0302227
Development and validation of a nomogram for predicting 28-day mortality in patients with ischemic stroke
Abstract
Background/aim: We aimed to construct a validated nomogram model for predicting short-term (28-day) ischemic stroke mortality among critically ill populations.
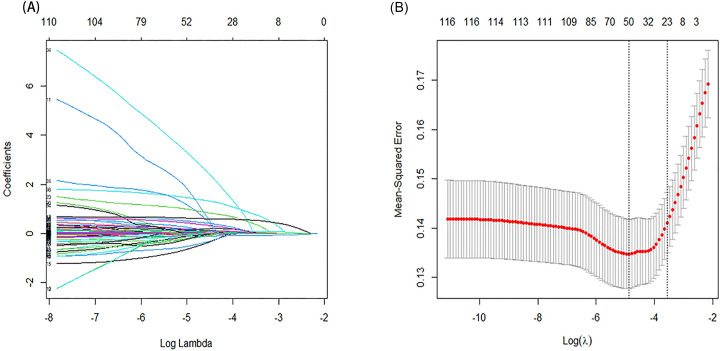
Materials and methods: We collected raw data from the Medical Information Mart for Intensive Care IV database, a comprehensive repository renowned for its depth and breadth in critical care information. Subsequently, a rigorous analytical framework was employed, incorporating a 10-fold cross-validation procedure to ensure robustness and reliability. Leveraging advanced statistical methodologies, specifically the least absolute shrinkage and selection operator regression, variables pertinent to 28-day mortality in ischemic stroke were meticulously screened. Next, binary logistic regression was utilized to establish nomogram, then applied concordance index to evaluate discrimination of the prediction models. Predictive performance of the nomogram was assessed by integrated discrimination improvement (IDI) and net reclassification index (NRI). Additionally, we generated calibration curves to assess calibrating ability. Finally, we evaluated the nomogram's net clinical benefit using decision curve analysis (DCA), in comparison with scoring systems clinically applied under common conditions.
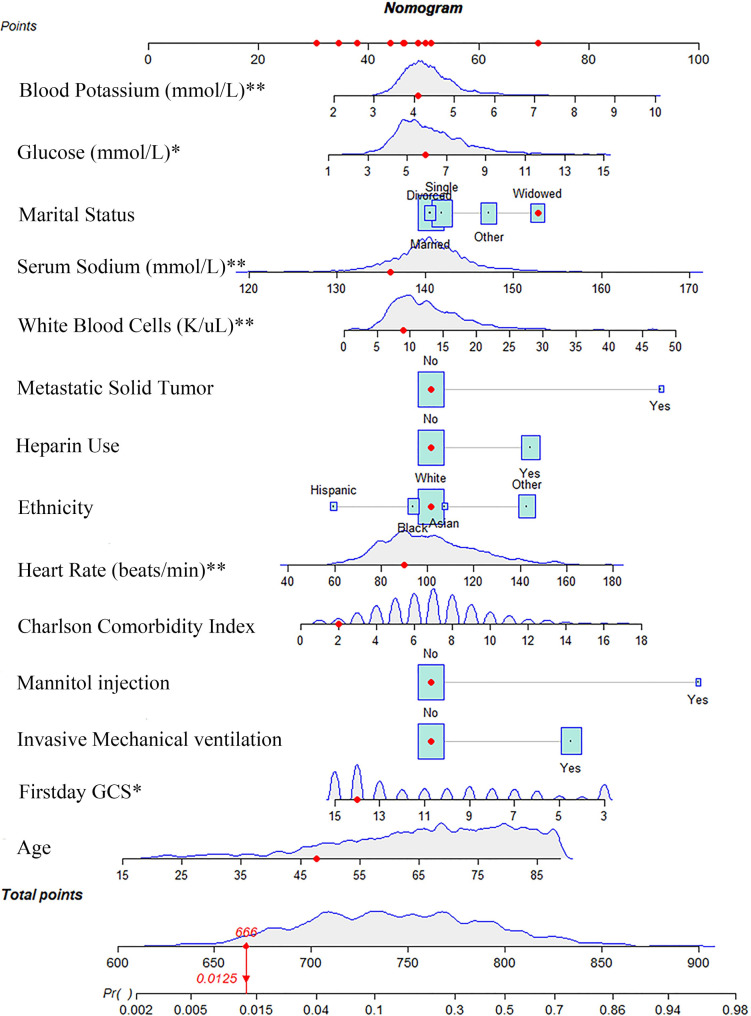
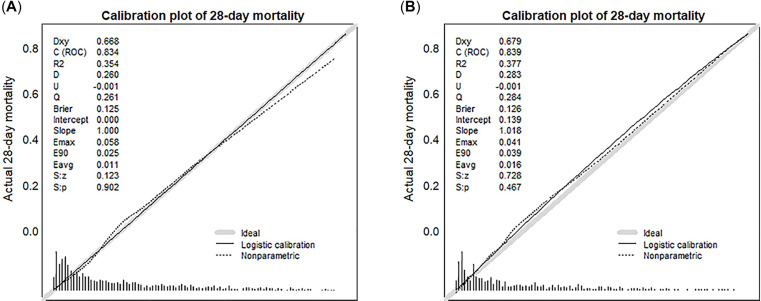
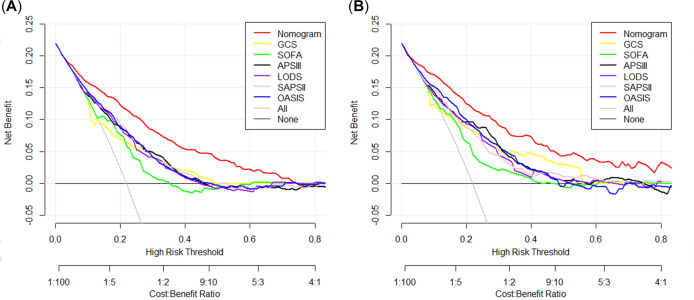
Results: A total of 2089 individuals were identified and assigned into training (n = 1443) or validation (n = 646) cohorts. Various identified risk factors, including age, ethnicity, marital status, underlying metastatic solid tumor, Charlson comorbidity index, heart rate, Glasgow coma scale, glucose concentrations, white blood cells, sodium concentrations, potassium concentrations, mechanical ventilation, use of heparin and mannitol, were associated with short-term (28-day) mortality in ischemic stroke individuals. A concordance index of 0.834 was obtained in the training dataset, indicating that our nomogram had good discriminating ability. Results of IDI and NRI in both cohorts proved that our nomogram had positive improvement of predictive performance, compared to other scoring systems. The actual and predicted incidence of mortality showed favorable concordance on calibration curves (P > 0.05). DCA curves revealed that, compared with scoring systems clinically used under common conditions, the constructed nomogram yielded a greater net clinical benefit.
Conclusions: Utilizing a comprehensive array of fourteen readily accessible variables, a prognostic nomogram was meticulously formulated and rigorously validated to provide precise prognostication of short-term mortality within the ischemic stroke cohort.
Copyright: © 2024 Fang et al. This is an open access article distributed under the terms of the Creative Commons Attribution License, which permits unrestricted use, distribution, and reproduction in any medium, provided the original author and source are credited.
Conflict of interest statement
The authors have declared that no competing interests exist.
Figures
Similar articles
-
Prediction of long-term mortality in patients with ischemic stroke based on clinical characteristics on the first day of ICU admission: An easy-to-use nomogram.Front Neurol. 2023 Apr 14;14:1148185. doi: 10.3389/fneur.2023.1148185. eCollection 2023. Front Neurol. 2023. PMID: 37122313 Free PMC article.
-
Development and verification of a nomogram for predicting short-term mortality in elderly ischemic stroke populations.Sci Rep. 2023 Aug 3;13(1):12580. doi: 10.1038/s41598-023-39781-4. Sci Rep. 2023. PMID: 37537270 Free PMC article.
-
Predictive nomogram for 28-day mortality risk in mitral valve disorder patients in the intensive care unit: A comprehensive assessment from the MIMIC-III database.Int J Cardiol. 2024 Jul 15;407:132105. doi: 10.1016/j.ijcard.2024.132105. Epub 2024 Apr 25. Int J Cardiol. 2024. PMID: 38677334
-
Nomogram predictive model for in-hospital mortality risk in elderly ICU patients with urosepsis.BMC Infect Dis. 2024 Apr 26;24(1):442. doi: 10.1186/s12879-024-09319-8. BMC Infect Dis. 2024. PMID: 38671376 Free PMC article.
-
Construction and evaluation of a mortality prediction model for patients with acute kidney injury undergoing continuous renal replacement therapy based on machine learning algorithms.Ann Med. 2024 Dec;56(1):2388709. doi: 10.1080/07853890.2024.2388709. Epub 2024 Aug 19. Ann Med. 2024. PMID: 39155811 Free PMC article.
Cited by
-
Risk prediction models for short-term mortality in ICU stroke patients: a systematic review and meta-analysis.Front Neurol. 2025 Jul 16;16:1623645. doi: 10.3389/fneur.2025.1623645. eCollection 2025. Front Neurol. 2025. PMID: 40740846 Free PMC article.
-
Machine learning-based scoring model for predicting mortality in ICU-admitted ischemic stroke patients with moderate to severe consciousness disorders.Front Neurol. 2025 Mar 18;16:1534961. doi: 10.3389/fneur.2025.1534961. eCollection 2025. Front Neurol. 2025. PMID: 40170899 Free PMC article.
-
Association of albumin-corrected anion gap with severe consciousness disorders and outcomes in ischemic stroke: a retrospective MIMIC analysis.Sci Rep. 2024 Oct 29;14(1):26006. doi: 10.1038/s41598-024-76324-x. Sci Rep. 2024. PMID: 39472602 Free PMC article.
-
Construction and validation of a predictive model for poor long-term prognosis in severe acute ischemic stroke after endovascular treatment based on LASSO regression.Front Neurol. 2025 Apr 14;16:1535679. doi: 10.3389/fneur.2025.1535679. eCollection 2025. Front Neurol. 2025. PMID: 40297852 Free PMC article.
References
-
- Kavga A, Kalemikerakis I, Faros A, Milaka M, Tsekoura D, Skoulatou M, et al.. The Effects of Patients’ and Caregivers’ Characteristics on the Burden of Families Caring for Stroke Survivors. International journal of environmental research and public health. 2021;18(14):7298. 10.3390/ijerph18147298 . - DOI - PMC - PubMed
Publication types
MeSH terms
LinkOut - more resources
Full Text Sources
Medical
