

Rabbit intakes and predictors of their length of stay in animal shelters in British Columbia, Canada
- PMID: 38657002
- PMCID: PMC11042706
- DOI: 10.1371/journal.pone.0300633
Rabbit intakes and predictors of their length of stay in animal shelters in British Columbia, Canada
Abstract
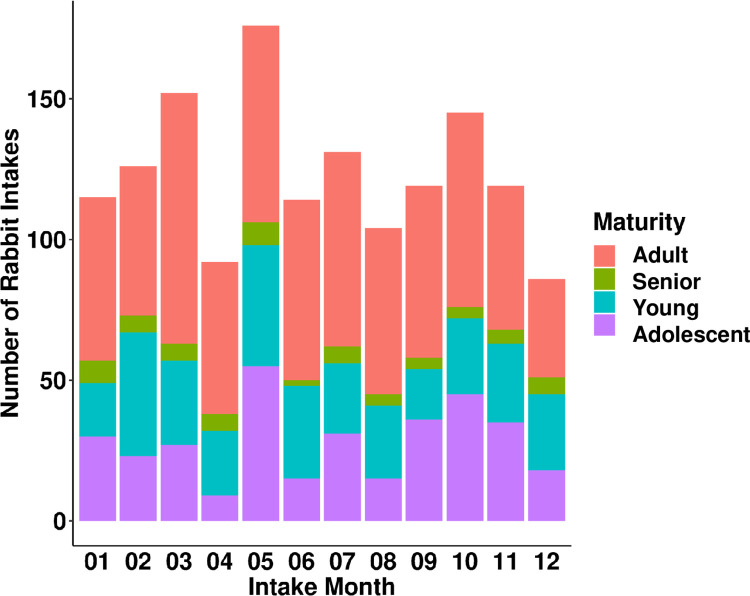
Domestic rabbits (Oryctolagus cuniculus) are the fourth most common species admitted to the British Columbia Society for the Prevention of Cruelty to Animals (BC SPCA) shelter system. However, shelter data analysis has largely focused on cats and dogs and little is known about the population dynamics of rabbits in shelters. We analyzed five years of rabbit records (n = 1567) at the BC SPCA to identify trends in intake and predictors of length of stay (LOS) of rabbits. The majority of rabbits were surrendered by their owners (40.2%), with most rabbits being surrendered for human-related reasons (96.9%). Overall, rabbit intakes decreased over the study period. When analyzing by month of intake, rabbit intakes were found to be the highest in May. Most rabbits in our data were adults (46.7%), non-brachycephalic (66.7%), erect-eared (82.5%), short-furred (76.2%), and subsequently adopted (80.3%). The median LOS of rabbits was 29 days, highlighting the pressing need to improve their time to adoption. A linear model was constructed to identify predictors of LOS of adopted rabbits (n = 1203) and revealed that intake year, intake month, source of intake, age, cephalic type, and breed size significantly predicted time to adoption for rabbits (F(37, 1165) = 7.95, p < 2.2e-16, adjusted R2 = 0.18). These findings help characterize shelter population dynamics for rabbits, shed light on the challenges associated with unwanted rabbits, and offer a foundation for animal shelters to design programs and marketing strategies tailored to reduce LOS of rabbits with particular characteristics. Shelter rabbits represent an understudied population and our study highlights the importance of further research in companion rabbits.
Copyright: © 2024 U. et al. This is an open access article distributed under the terms of the Creative Commons Attribution License, which permits unrestricted use, distribution, and reproduction in any medium, provided the original author and source are credited.
Conflict of interest statement
The authors have declared that no competing interests exist.
Figures


Similar articles
-
Quantifying the shelter rabbit population: an analysis of Massachusetts and Rhode Island animal shelters.J Appl Anim Welf Sci. 2012;15(4):297-312. doi: 10.1080/10888705.2012.709084. J Appl Anim Welf Sci. 2012. PMID: 23009621
-
Rats as pets: Predictors of adoption and surrender of pet rats (Rattus norvegicus domestica) in British Columbia, Canada.PLoS One. 2022 Feb 18;17(2):e0264262. doi: 10.1371/journal.pone.0264262. eCollection 2022. PLoS One. 2022. PMID: 35180270 Free PMC article.
-
Factors Influencing Time to Adoption for Dogs in a Provincial Shelter System in Canada.J Appl Anim Welf Sci. 2018 Oct-Dec;21(4):375-388. doi: 10.1080/10888705.2018.1436917. Epub 2018 Mar 20. J Appl Anim Welf Sci. 2018. PMID: 29557174
-
Effect of a provincial feline onychectomy ban on cat intake and euthanasia in a British Columbia animal shelter system.J Feline Med Surg. 2022 Aug;24(8):739-744. doi: 10.1177/1098612X211043820. Epub 2021 Sep 13. J Feline Med Surg. 2022. PMID: 34514907 Free PMC article.
-
Reasons for Guardian-Relinquishment of Dogs to Shelters: Animal and Regional Predictors in British Columbia, Canada.Front Vet Sci. 2022 Apr 14;9:857634. doi: 10.3389/fvets.2022.857634. eCollection 2022. Front Vet Sci. 2022. PMID: 35498734 Free PMC article.
References
-
- For shelters. In: BC SPCA [Internet]. 2023 [cited 2023 Dec 21]. Available from: https://spca.bc.ca/programs-services/leaders-in-our-field/professional-r...
-
- 2020 Canadian Pet Population Figures released: News. In: Canadian Animal Health Institute [Internet]. 2021 [cited 2023 Dec 21]. Available from: https://www.cahi-icsa.ca/news/2020-canadian-pet-population-figures-released
-
- Canadian Animal Shelter Statistics. In: Humane Canada [Internet]. 2022 [cited 2023 Dec 21]. Available from: https://humanecanada.ca/our-work/focus-areas/companion-animals/canadian-...
-
- Ledger RA. The relinquishment of rabbits to rescue shelters in Canada. Journal of Veterinary Behavior. 2010;5(1):36–7. doi: 10.1016/j.jveb.2009.10.016 - DOI
Publication types
MeSH terms
LinkOut - more resources
Full Text Sources
Miscellaneous
