. 2024 Apr 30;121(18):e2311028121.
doi: 10.1073/pnas.2311028121. Epub 2024 Apr 24.

Senolytic and senomorphic agent procyanidin C1 alleviates structural and functional decline in the aged retina

Affiliations

Senolytic and senomorphic agent procyanidin C1 alleviates structural and functional decline in the aged retina

Yidan Liu et al. Proc Natl Acad Sci U S A. .

Abstract

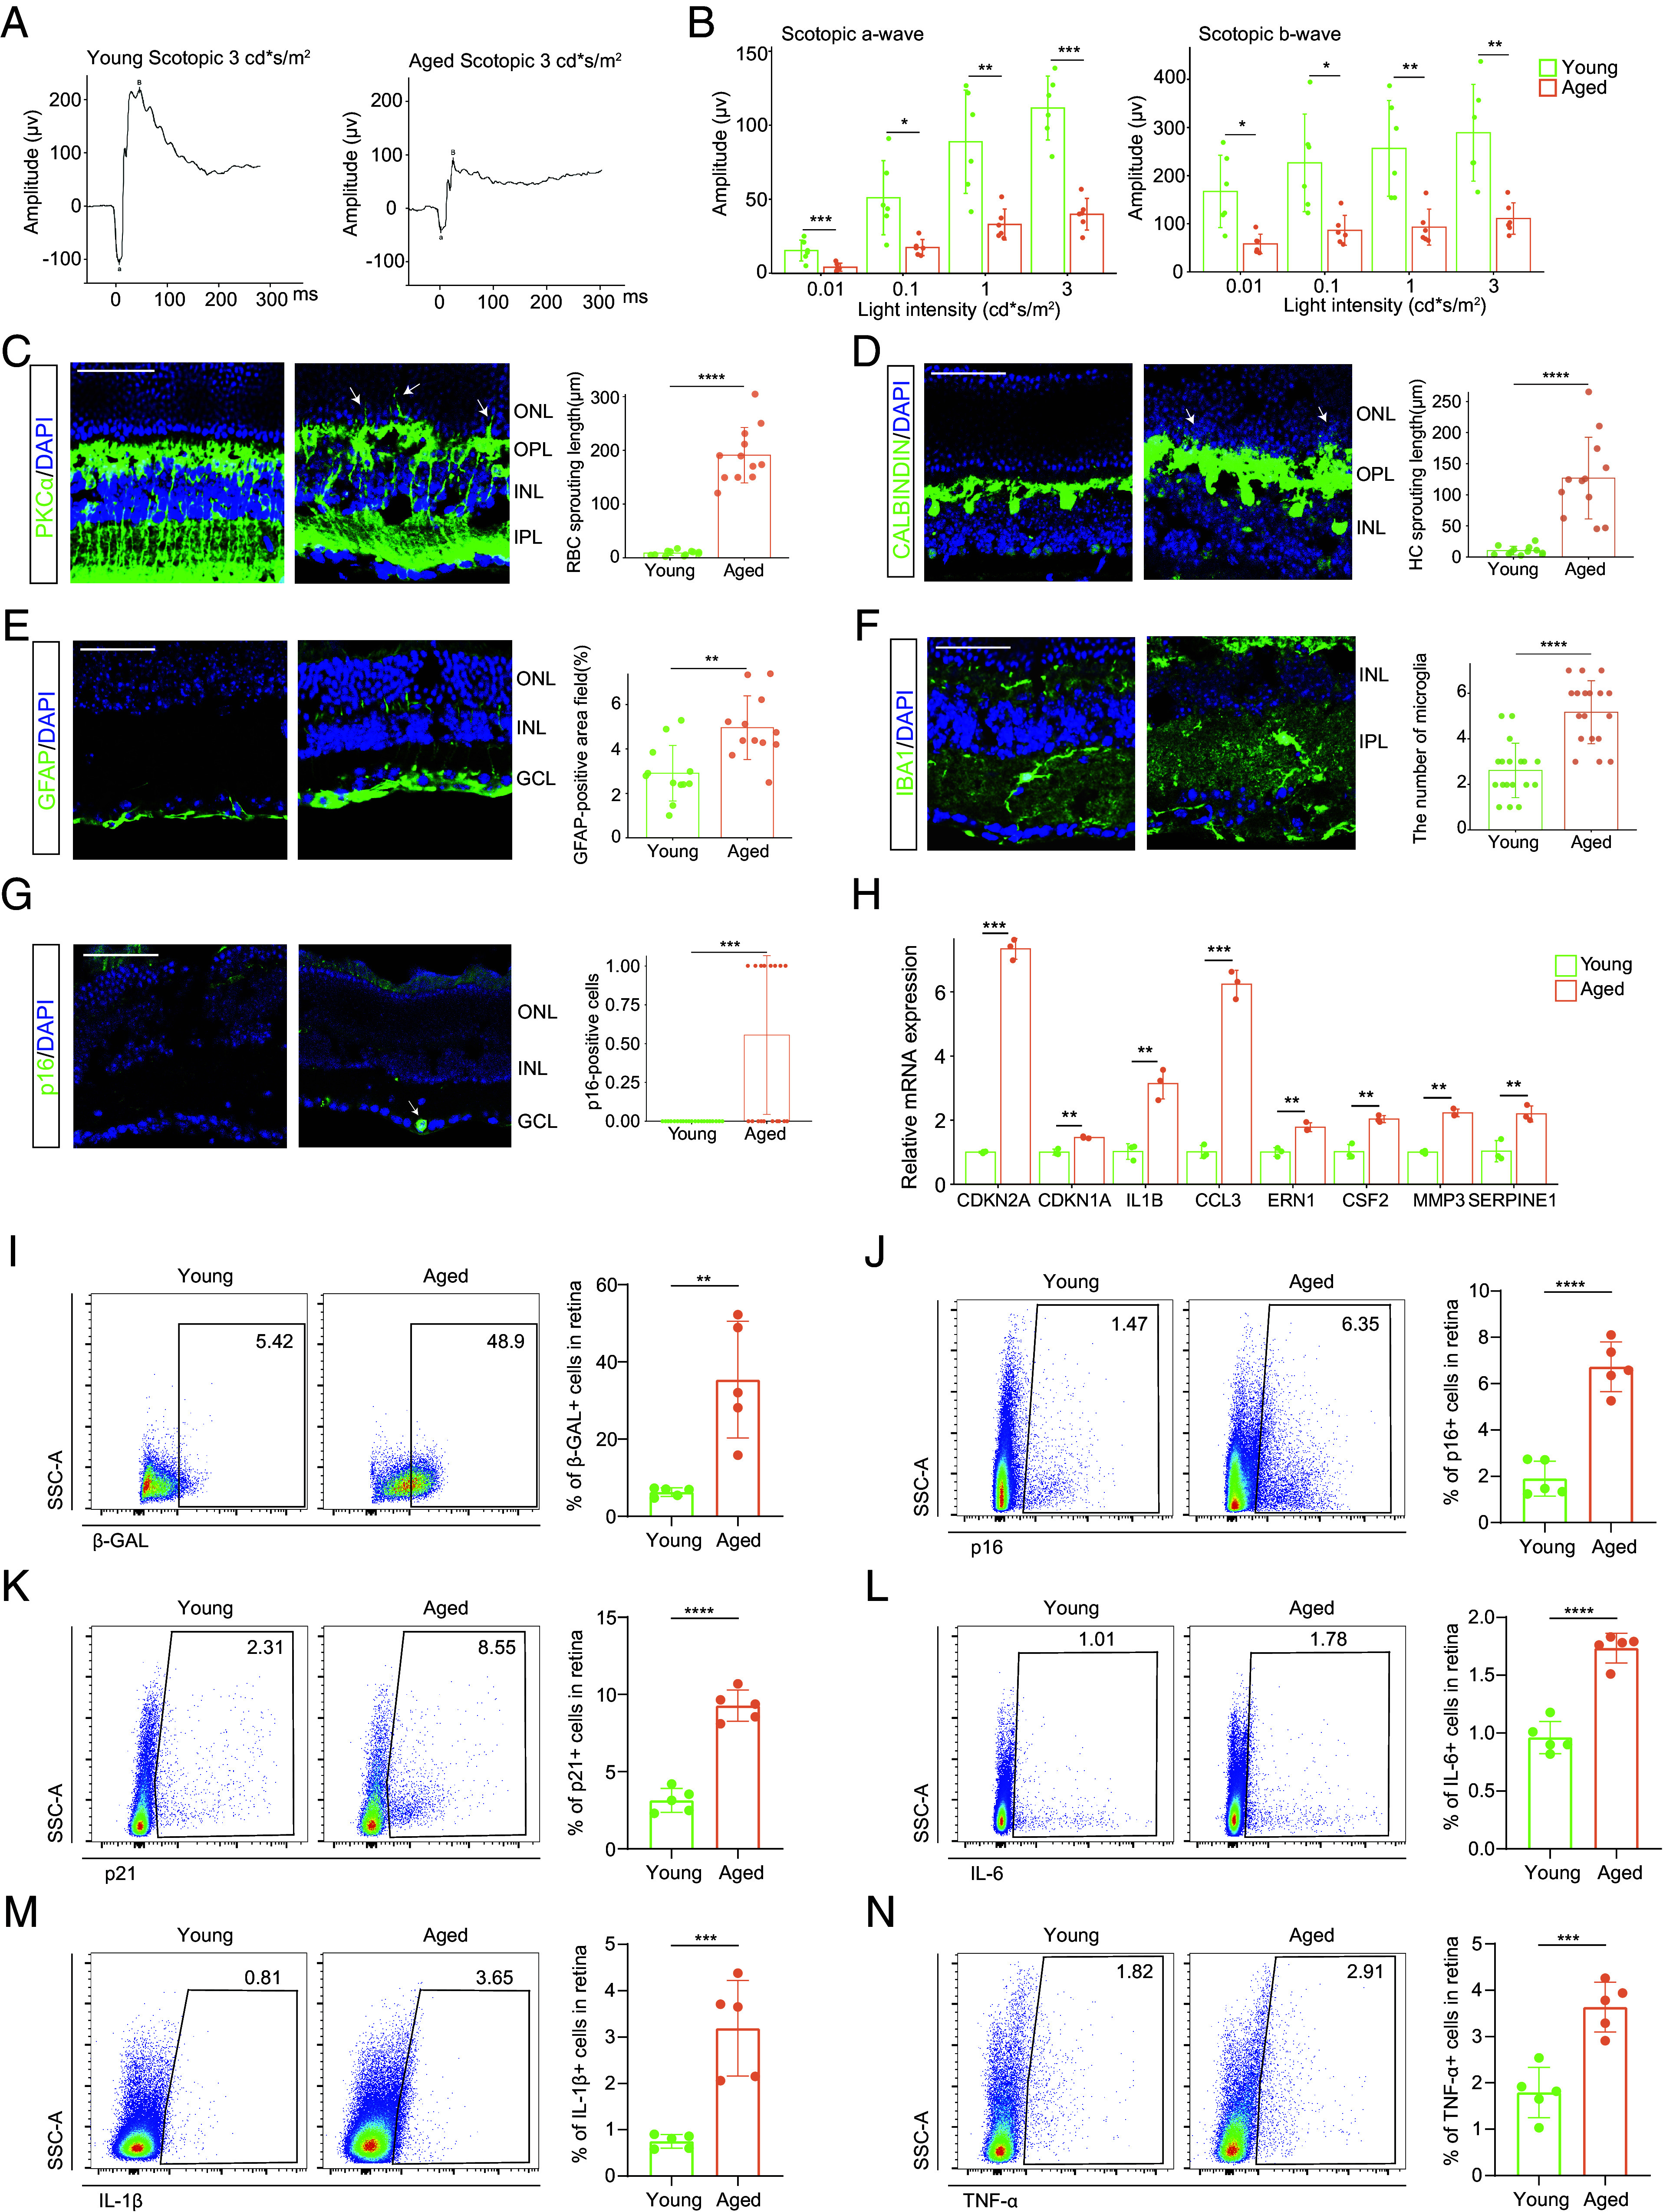
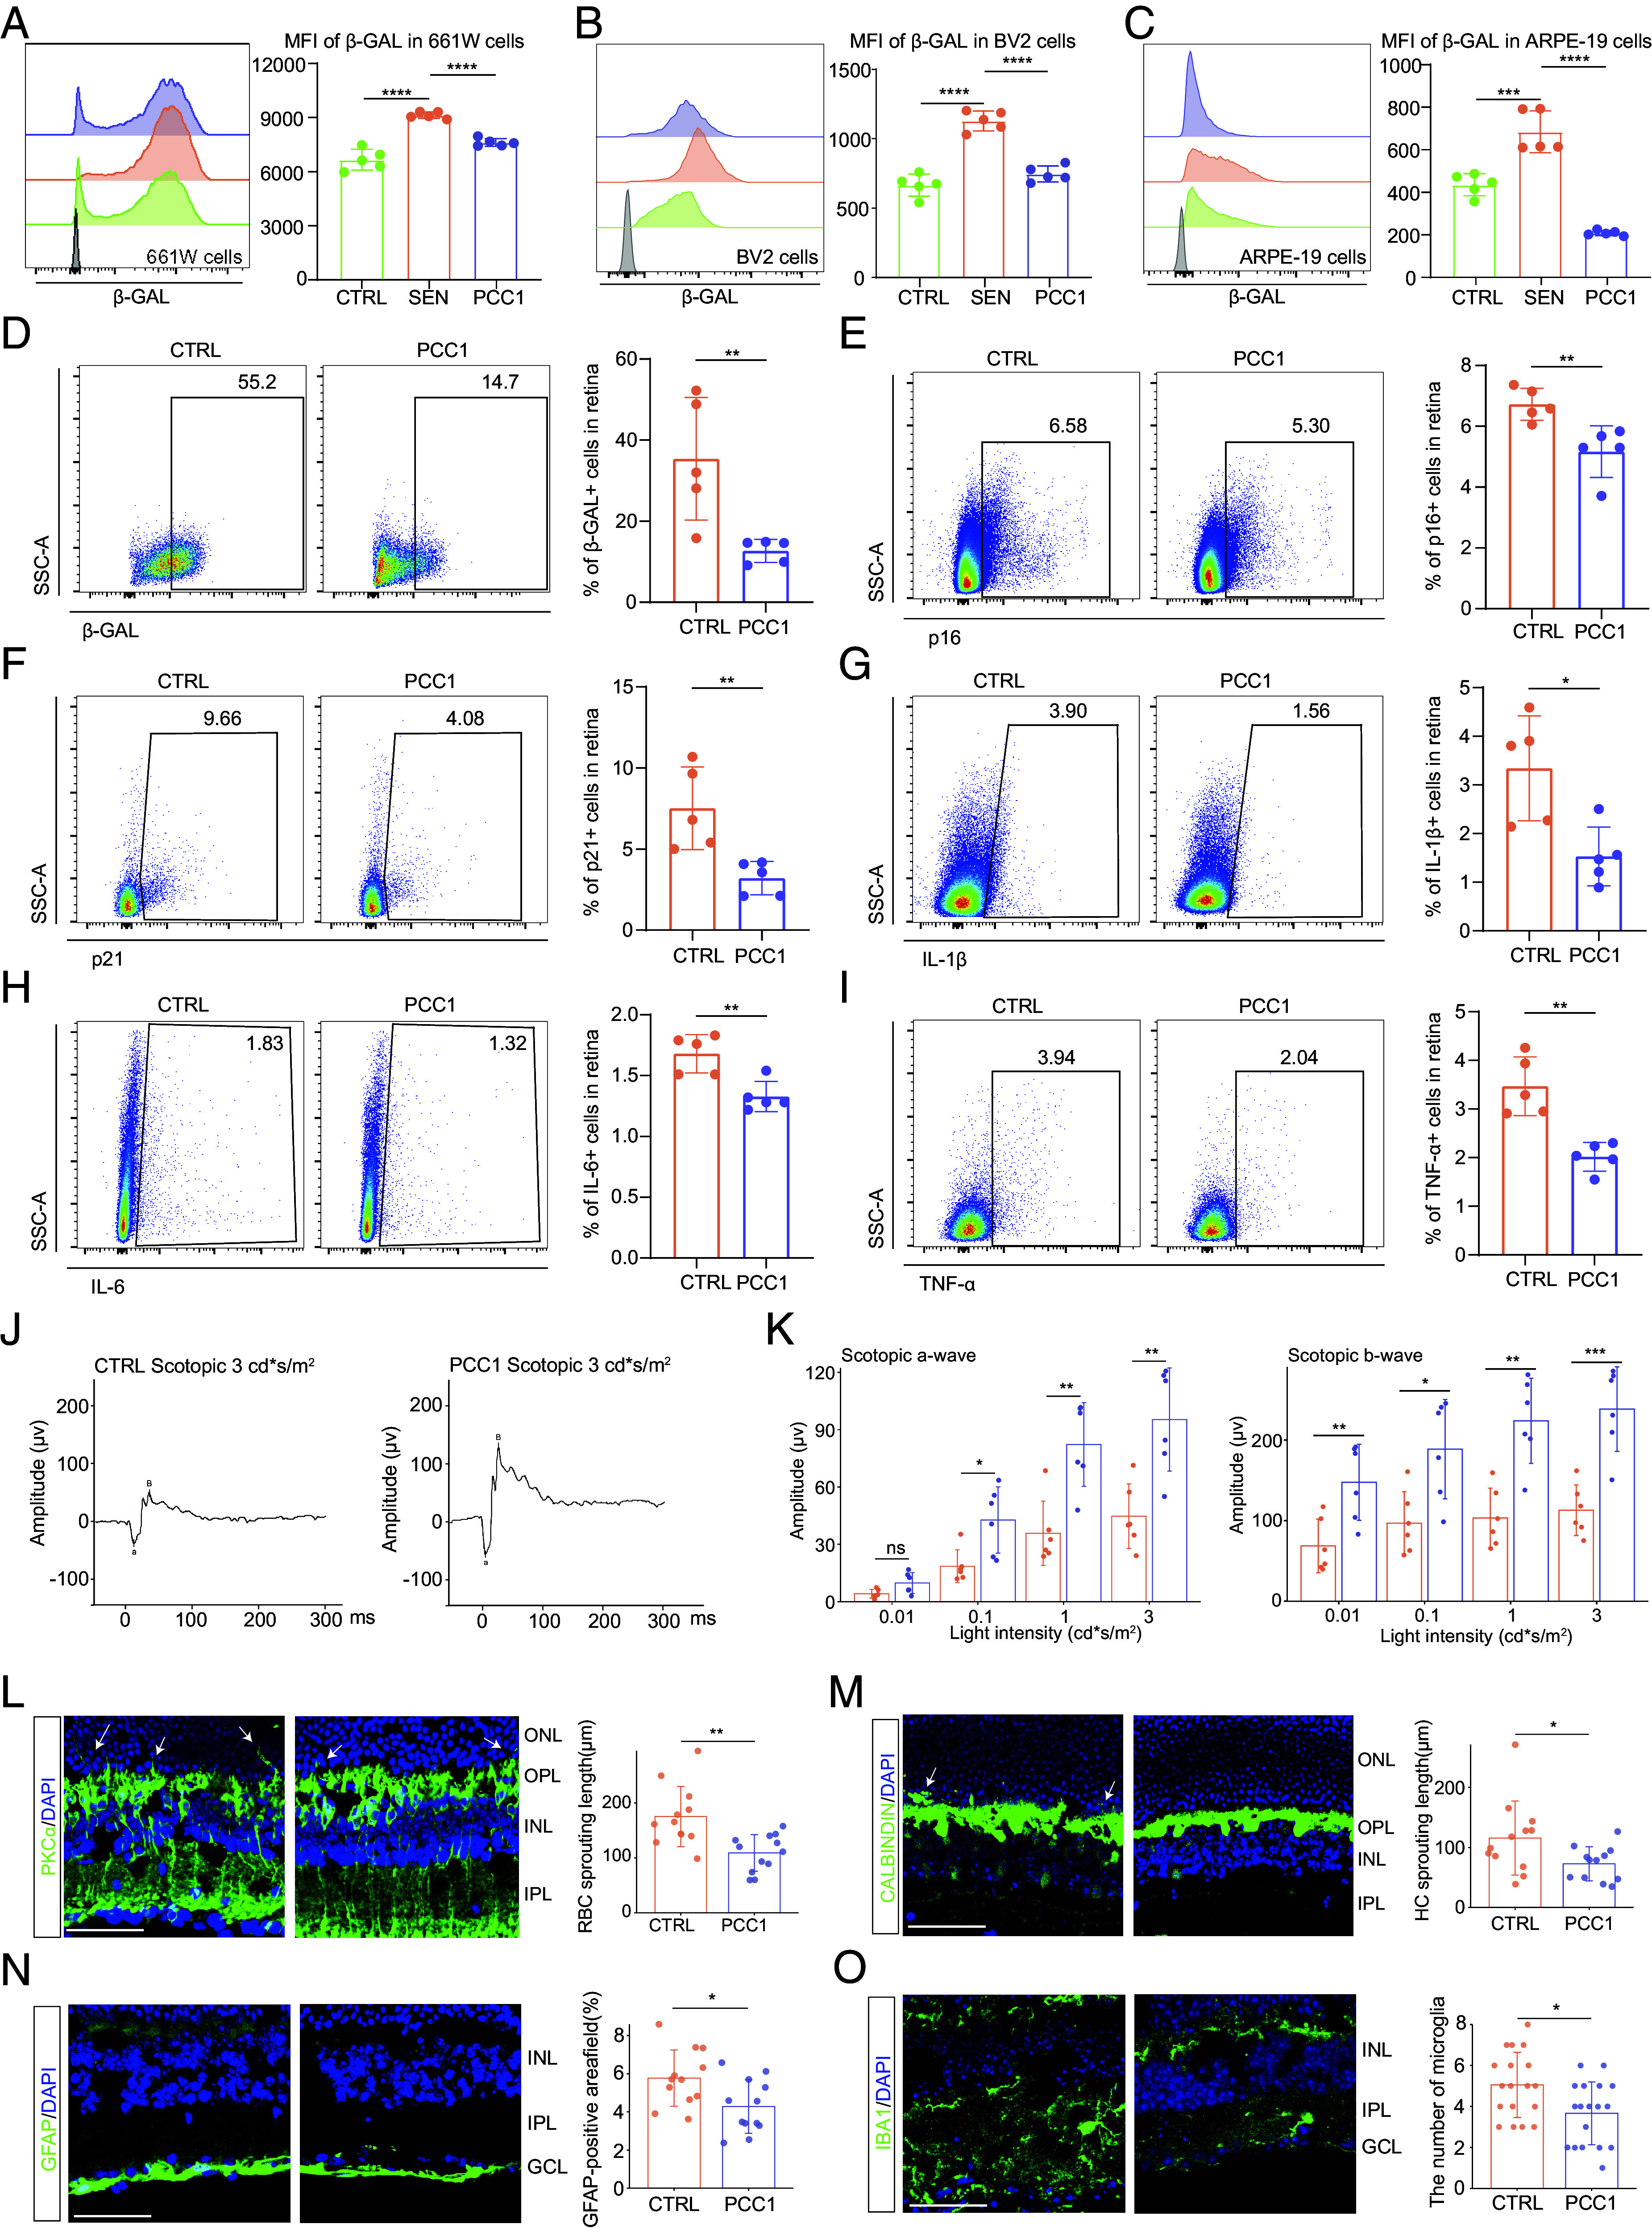
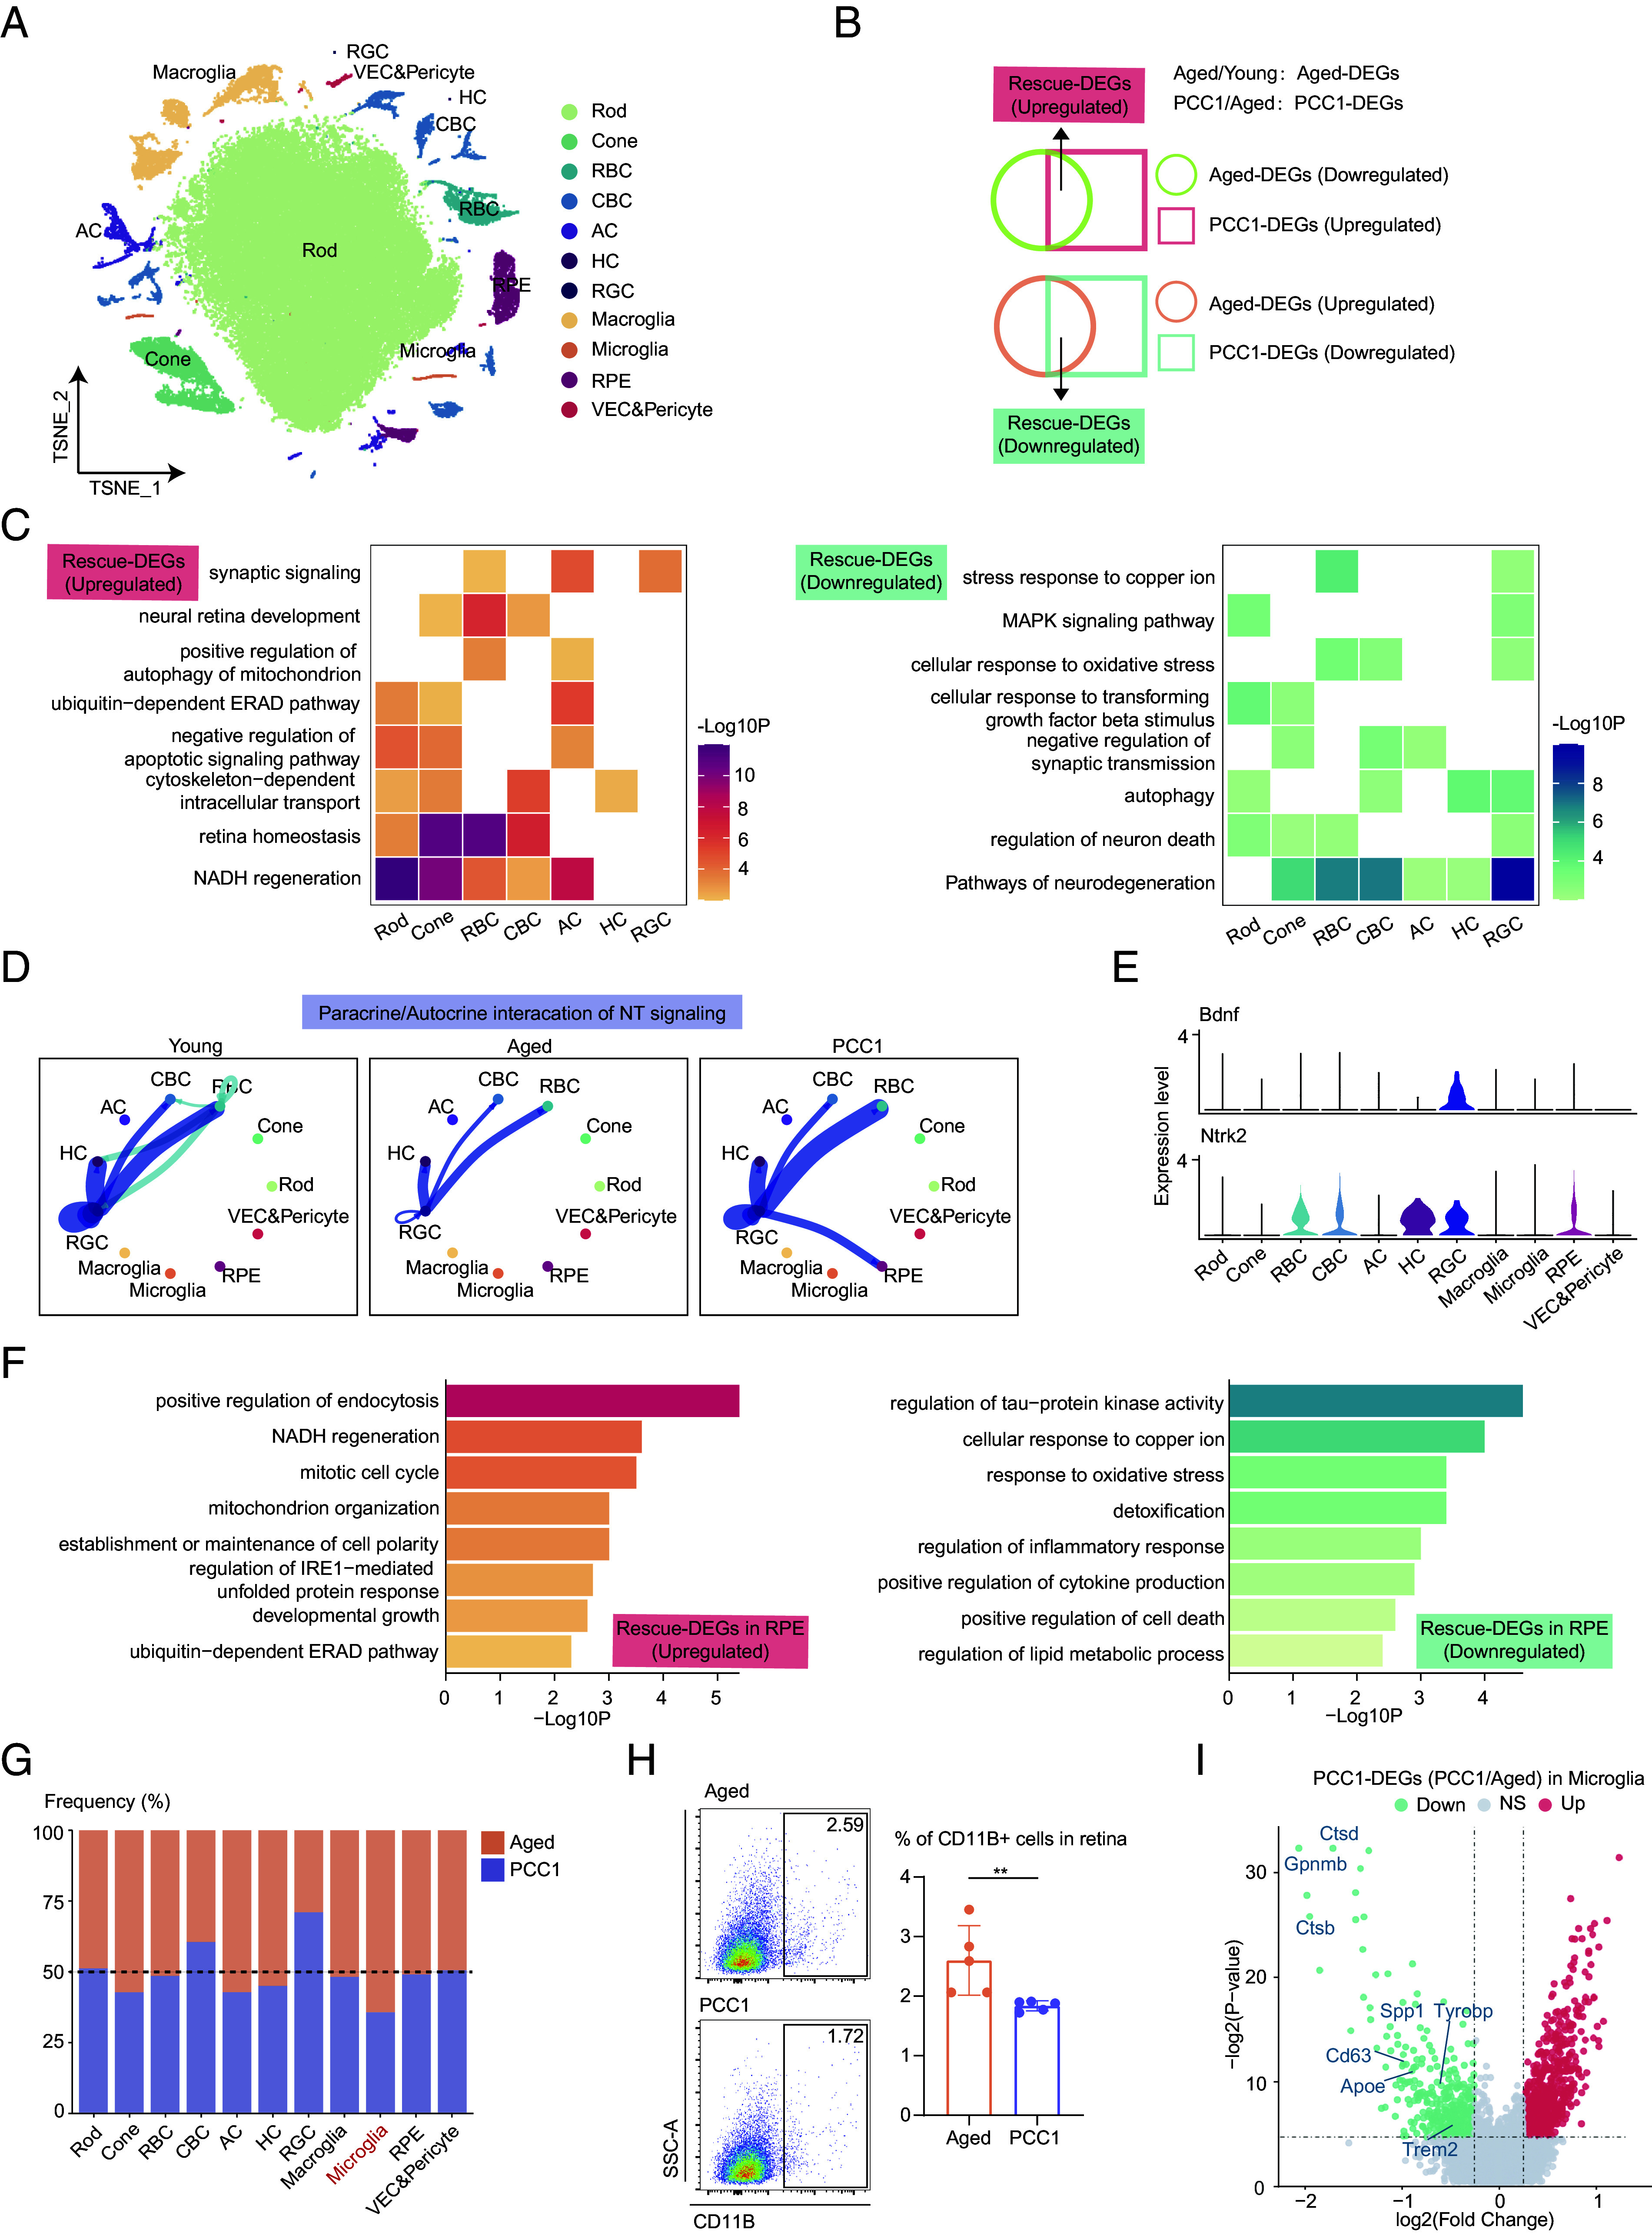
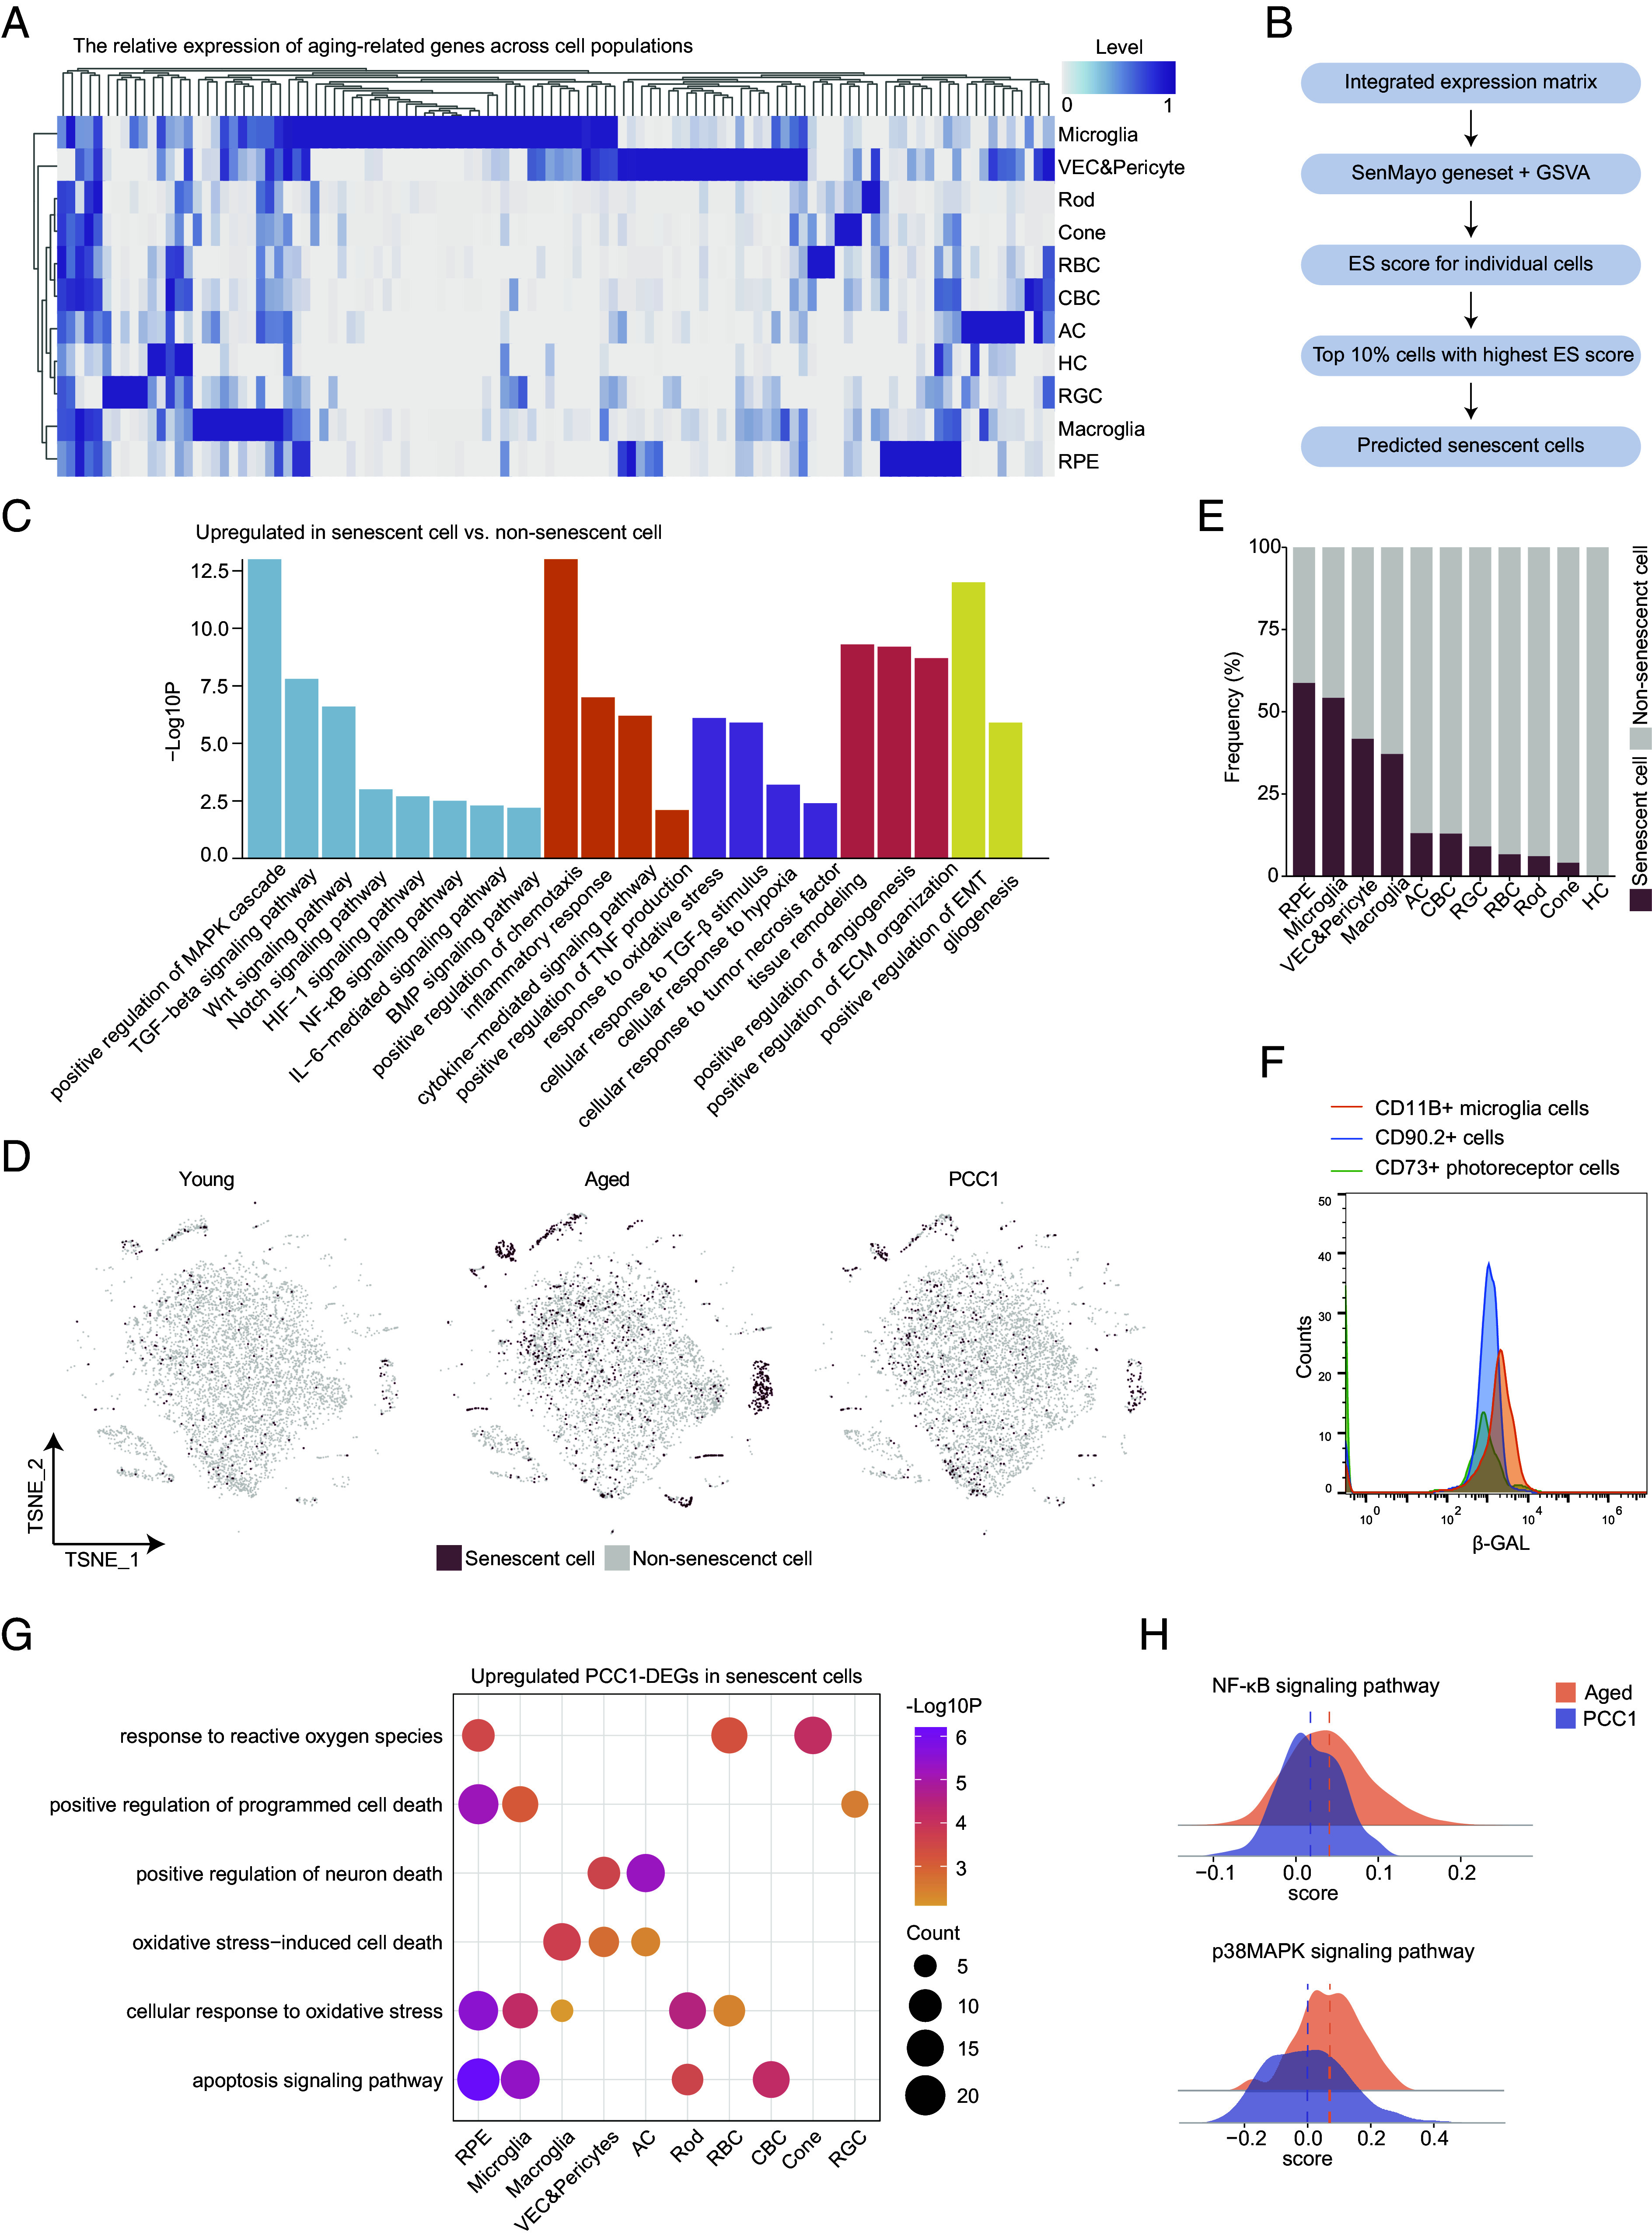
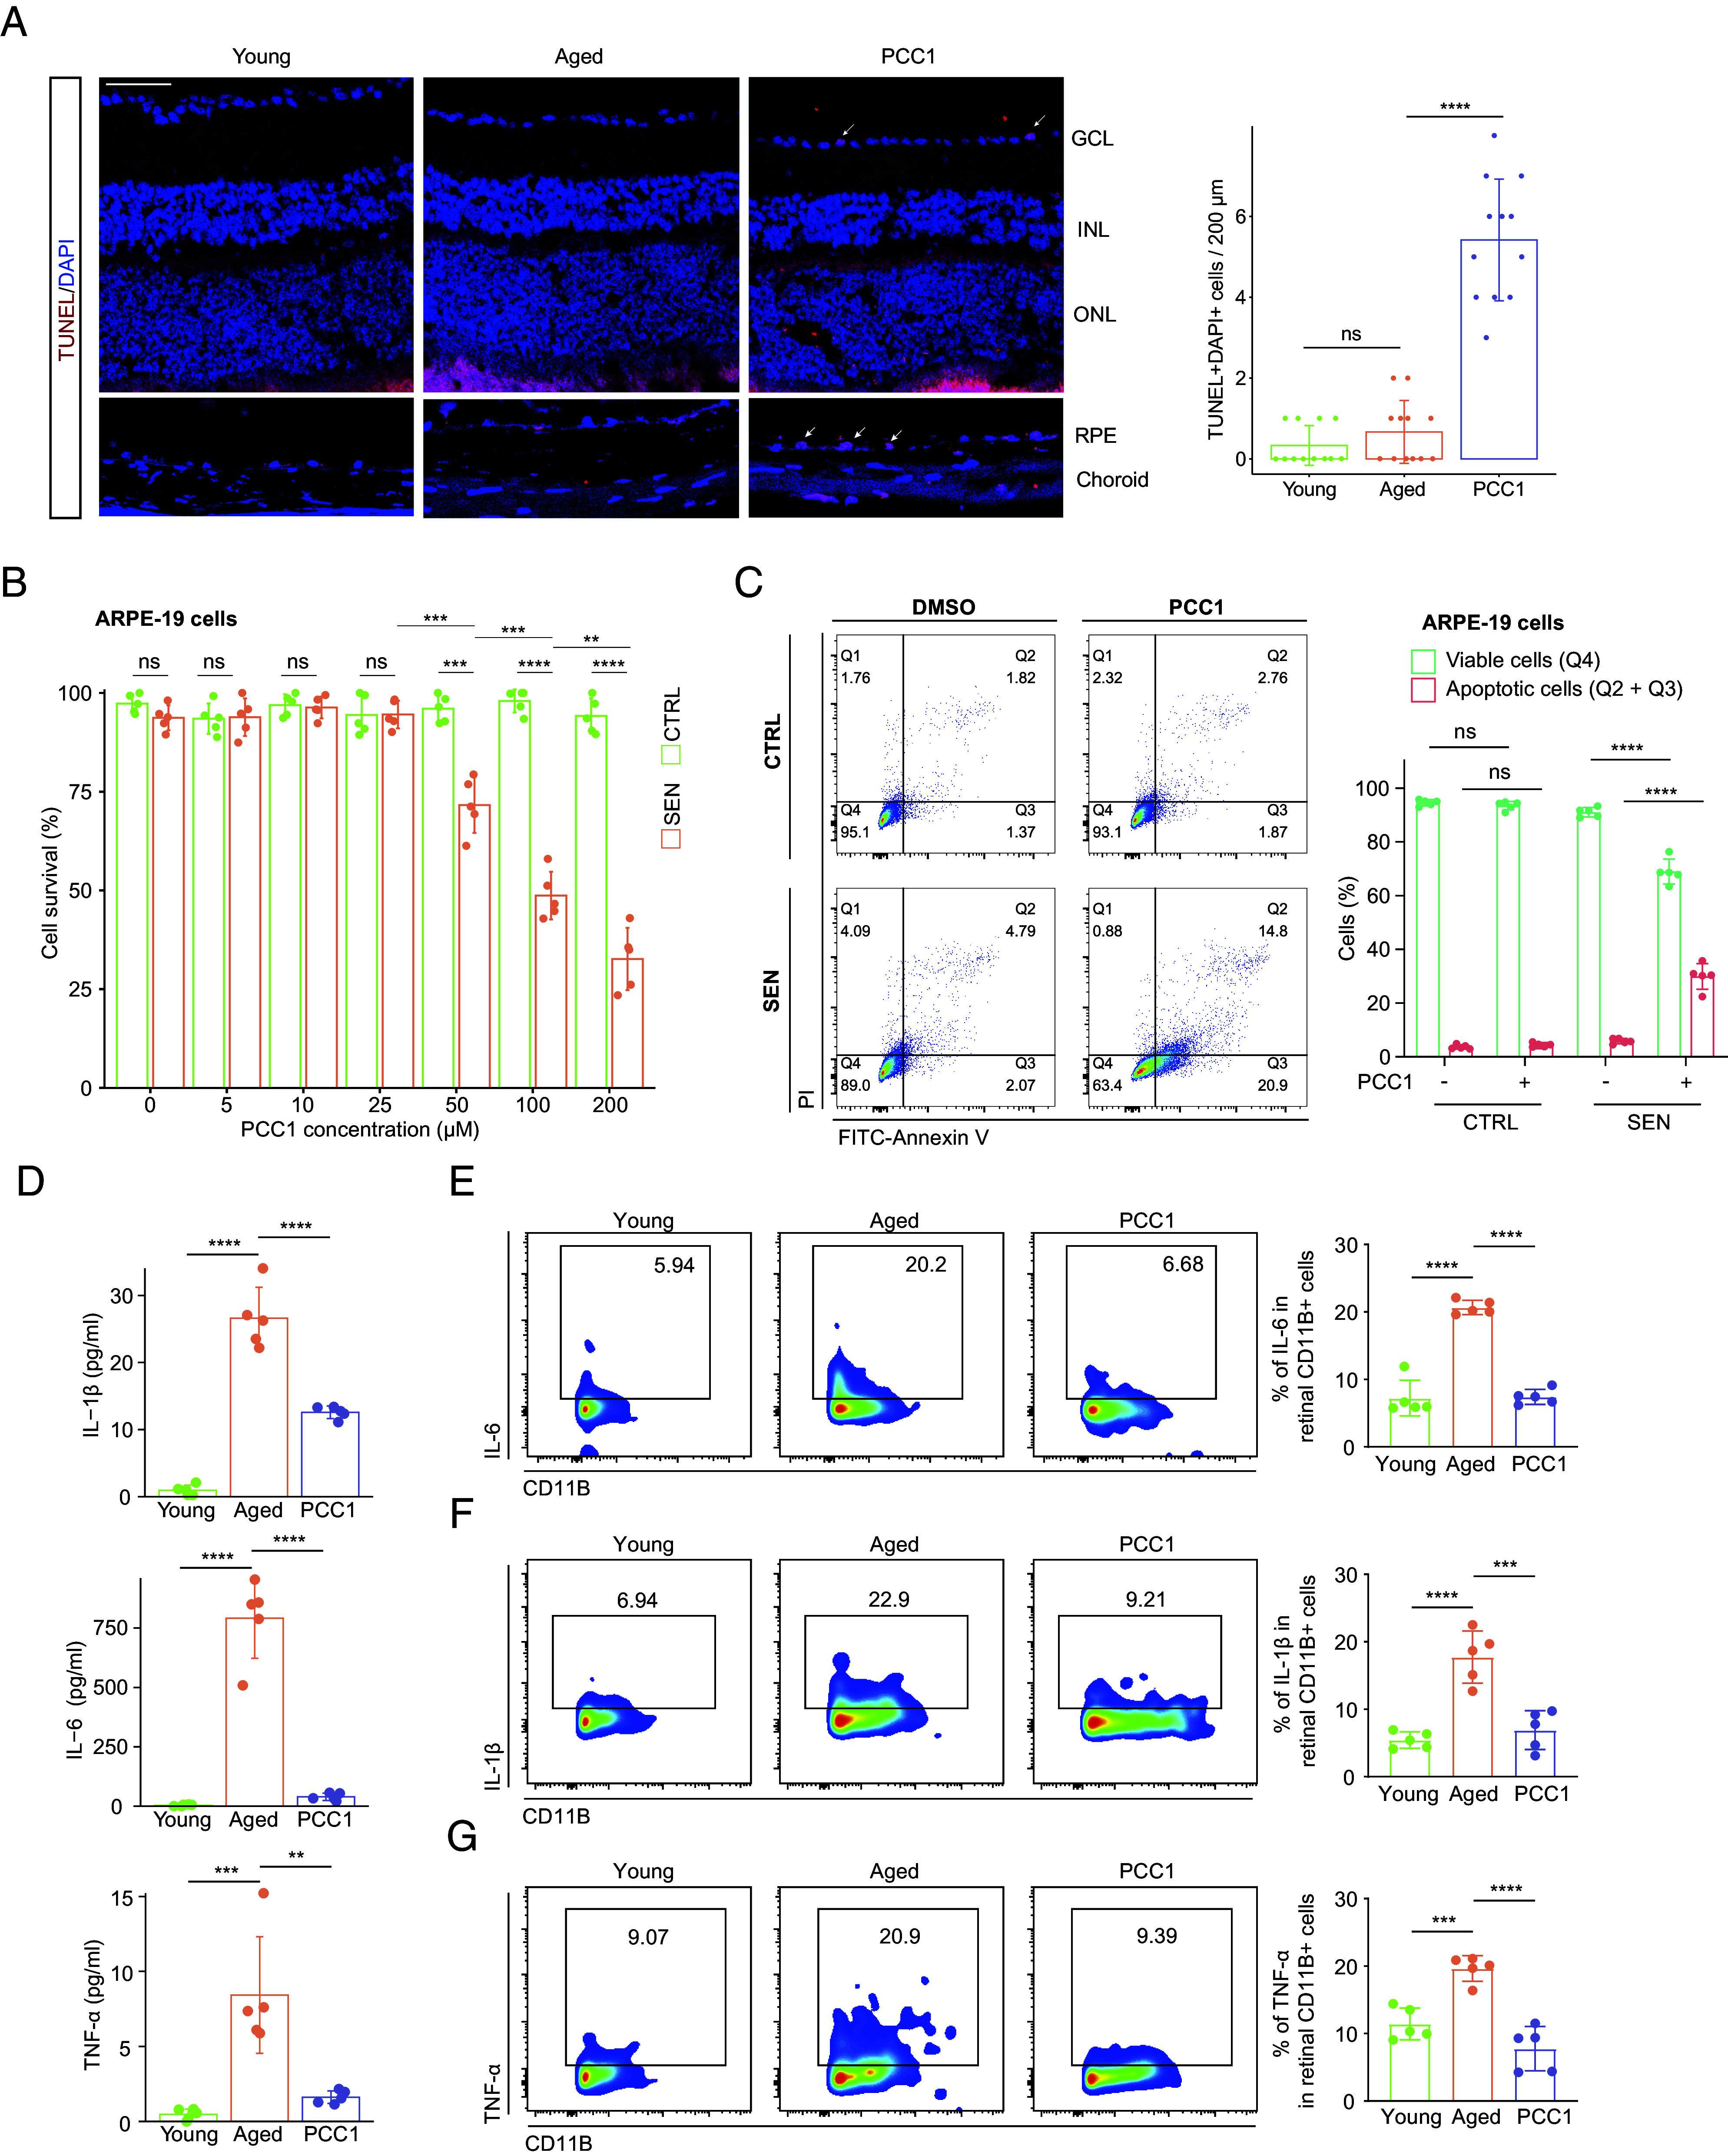
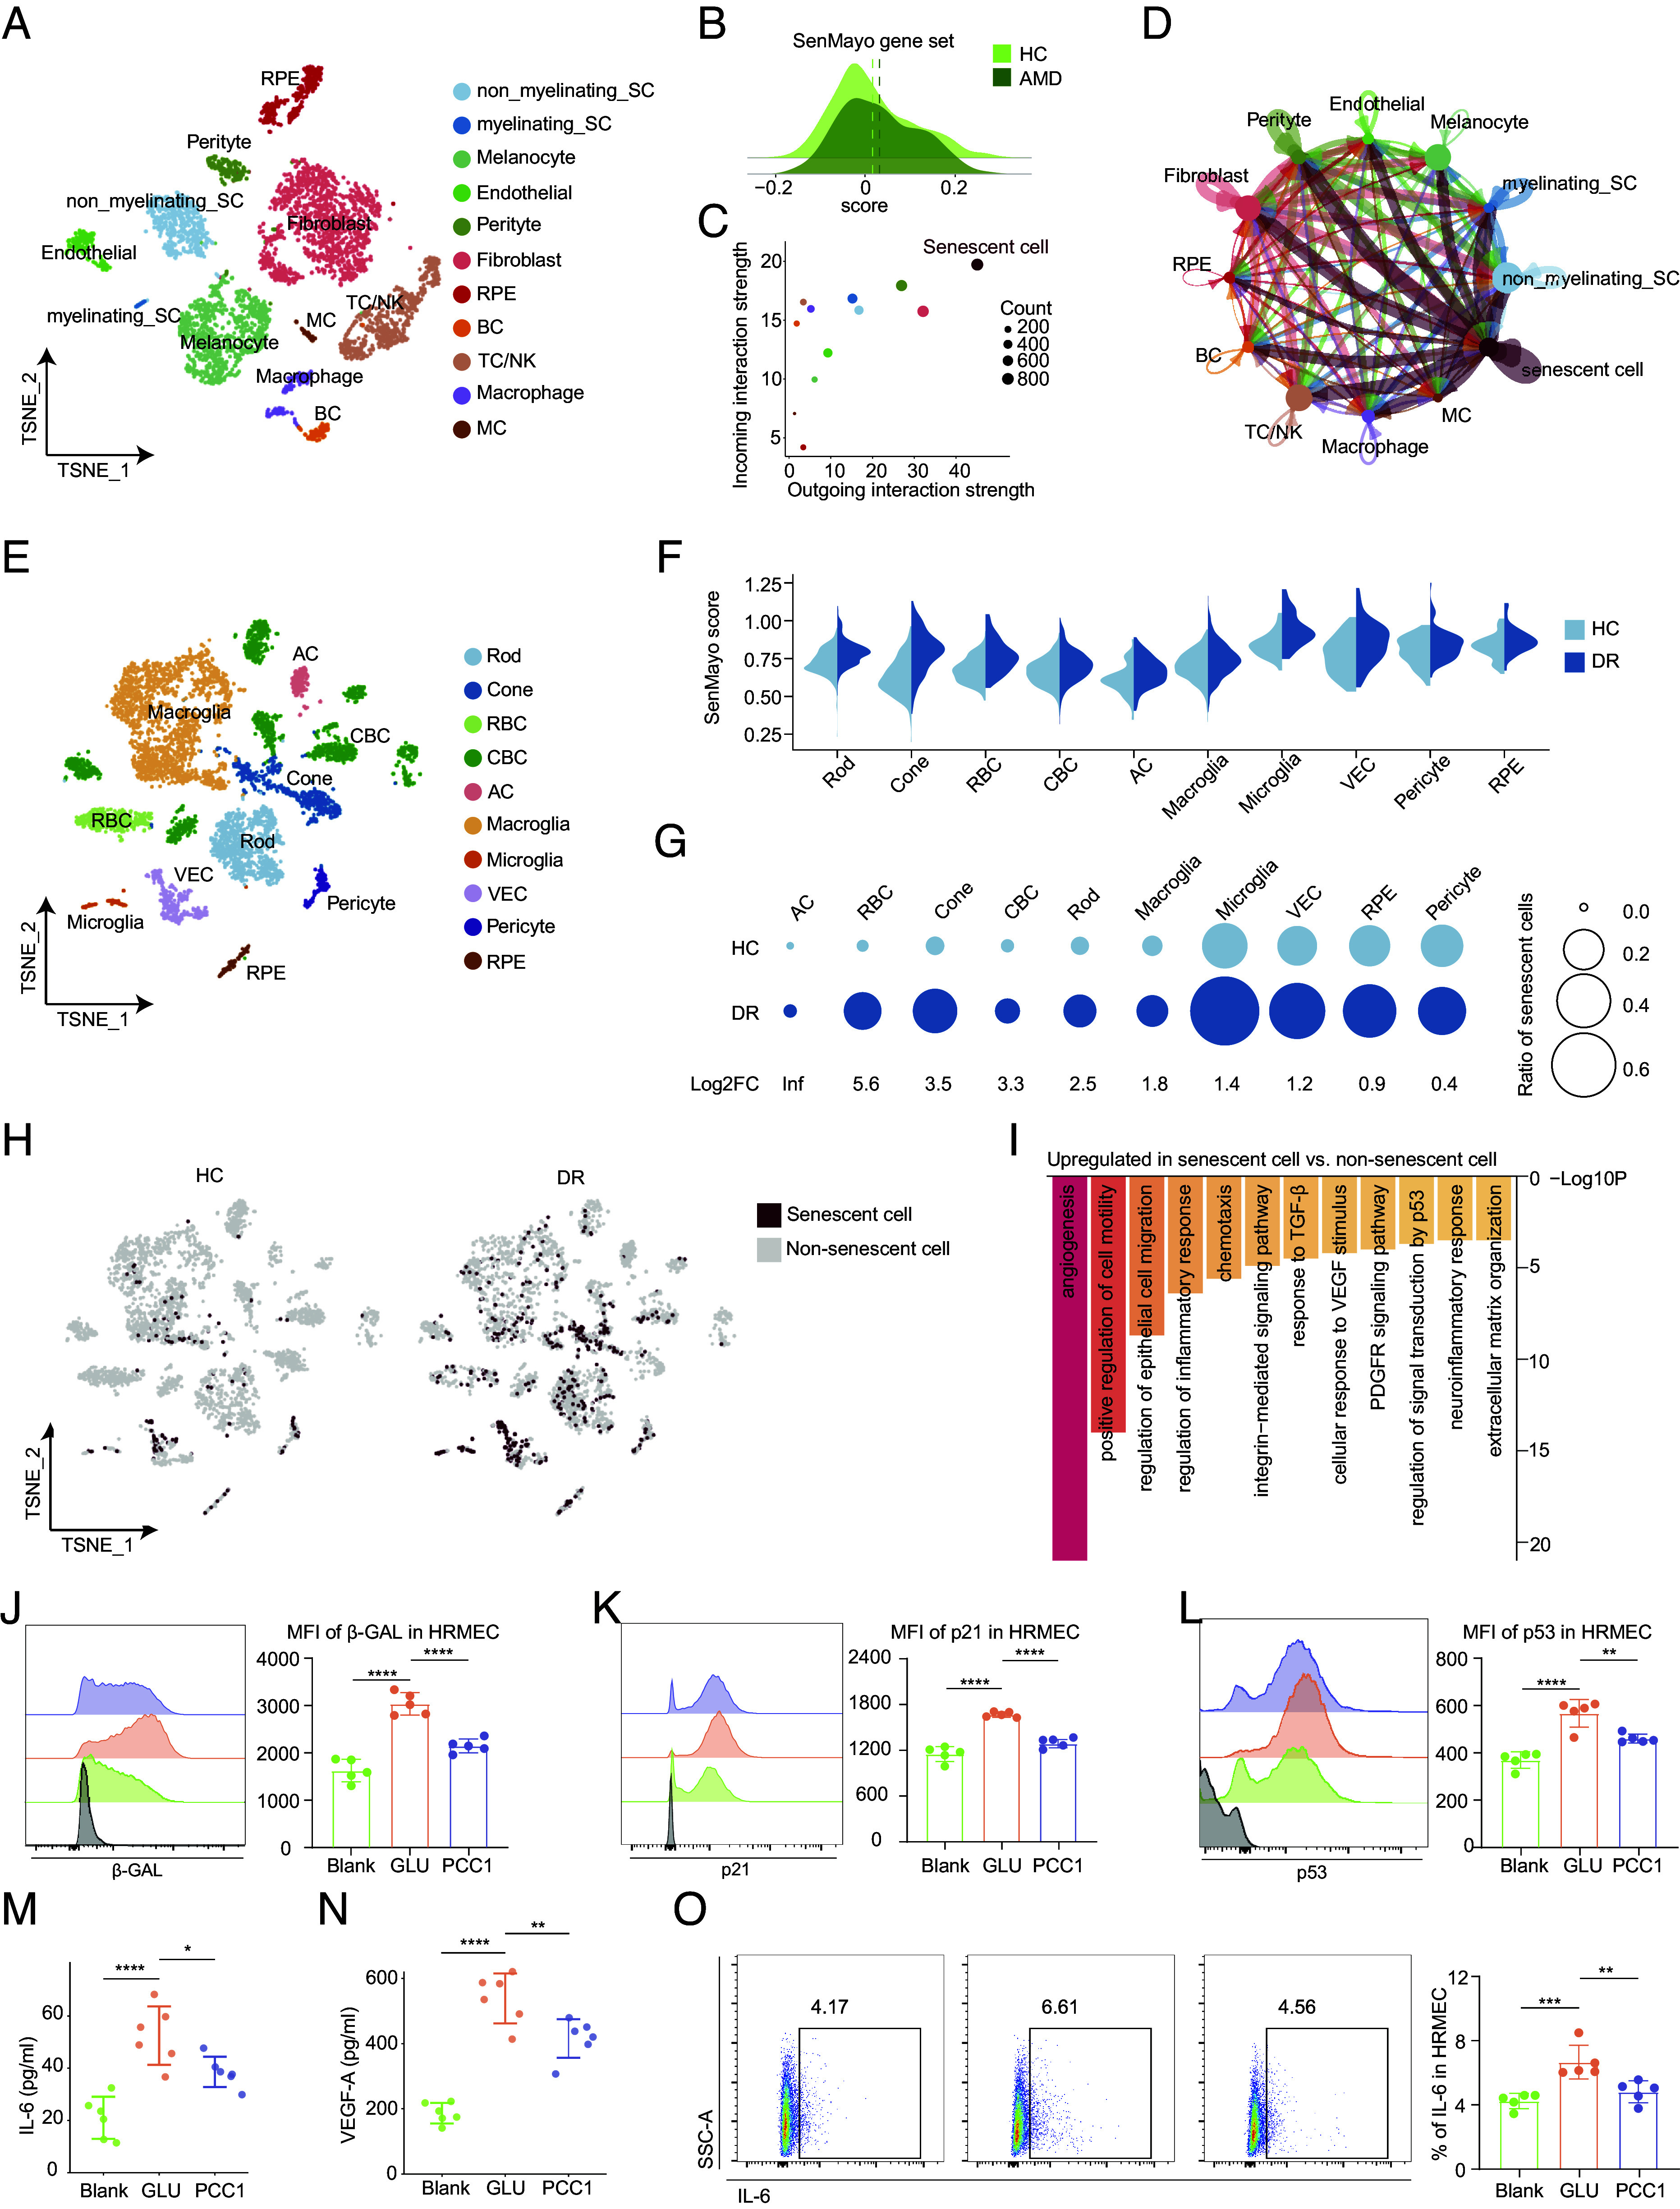
Increased cellular senescence burden contributes in part to age-related organ dysfunction and pathologies. In our study, using mouse models of natural aging, we observed structural and functional decline in the aged retina, which was accompanied by the accumulation of senescent cells and senescence-associated secretory phenotype factors. We further validated the senolytic and senomorphic properties of procyanidin C1 (PCC1) both in vitro and in vivo, the long-term treatment of which ameliorated age-related retinal impairment. Through high-throughput single-cell RNA sequencing (scRNA-seq), we comprehensively characterized the retinal landscape after PCC1 administration and deciphered the molecular basis underlying the senescence burden increment and elimination. By exploring the scRNA-seq database of age-related retinal disorders, we revealed the role of cellular senescence and the therapeutic potential of PCC1 in these pathologies. Overall, these results indicate the therapeutic effects of PCC1 on the aged retina and its potential use for treating age-related retinal disorders.

Keywords: aging; cellular senescence; retina; senescence-associated secretory phenotype; senolytics.


Conflict of interest statement

Competing interests statement:The authors declare no competing interest.

Figures

Fig. 1.
Fig. 1.
The age-related decline in the retina accompanied by senescence burden accumulation. (A) Representative scotopic ERG of young and aged mice at a light density of 3 cd*s/m2. (B) Bar charts showing the quantification of scotopic ERG amplitudes (n = 6/group). (CG) Representative confocal images of retinal frozen sections of young (Left) and aged (Middle) mice and bar charts of quantification (Right, n = 6/group). Frozen sections are labeled with PKCα (C), Calbindin (D), GFAP (E), IBA1 (F), and p16 (G). Arrows indicate the abnormal sprouting dendrites of RBCs (C) and HCs (D) which extend beyond OPL into the ONL. The arrow in (G) indicates the p16+ cell in the retina. (Scale bar, 50 μm.) (H) The mRNA levels of several SASP-related genes were detected by RT-qPCR between young and old groups (n = 3/group). (IN) The FC histograms (Left) and column charts (Right) showing the level of β-GAL (I), p16 (J), p21 (K), IL-6 (L), IL-1β (M), and TNF-α (N) in retinal cells between young and aged groups (n = 5/group). Data are shown as mean ± SD. P values were analyzed using unpaired two-tailed Student’s t test (BE and HN) or two-tailed Mann–Whitney U test (F and G); *P < 0.05, **P < 0.01, ***P < 0.001, and ****P < 0.0001.
Fig. 2.
Fig. 2.
Long-term PCC1 treatment relieved functional and structural impairment in the aged retina by both senolytic and senomorphic effects. (AC) Representative FC histograms (Left) and quantification (Right) of MFI of β-GAL in 661 W (A), BV2 (B), and ARPE-19 (C) cells among three groups (n = 5/group). (DI) The FC histograms (Left) and column charts (Right) showing the level of β-GAL (D), p16 (E), p21 (F), IL-6 (G), IL-1β (H), and TNF-α (I) in retinal cells between control and PCC1-treated aged mice (n = 5/group). (J) Representative scotopic ERG waveform of aged and PCC1-treated aged mice at a light density of 3 cd*s/m2. (K) Bar charts showing the quantification of scotopic ERG amplitudes (n = 6/group). (LO) Representative confocal images of retinal frozen sections of aged (Upper) and PCC1-treated (Middle) mice and bar charts of quantification (Right, n = 6/group). Frozen sections are labeled with PKCα (L), Calbindin (M), GFAP (N), and IBA1 (O). Arrows indicate the abnormal sprouting dendrites of RBCs (L) and HCs (M) which extend beyond OPL into the ONL. (Scale bar, 50 μm.) Data are shown as mean ± SD. P values were analyzed using one-way ANOVA with Bonferroni post hoc test (AC) or two-tailed unpaired Student’s t test (DI and KN) or two-tailed Mann–Whitney U test (O); ns, nonsignificant, *P < 0.05, **P < 0.01, ***P < 0.001, and ****P < 0.0001.
Fig. 3.
Fig. 3.
The seotherapeutic effects of PCC1 treatment on the aged retina evaluated by single-cell analysis. (A) t-SNE plot showing the distribution of different retinal cell types. (B) Venn diagrams showing the Aged-DEGs, PCC1-DEGs, and Rescue-DEGs. (C) Heatmaps showing GO terms enriched for the up-regulated (Left) and down-regulated (Right) Rescue-DEGs of different neuronal cell types after PCC1 treatment. (D) Circle plots showing the inferred NT signaling networks among three groups. Edge width represents the communication probability. (E) Violin plots showing the expression of the ligand–receptor involved in the inferred NT signaling pathway. (F) Bar plots showing the GO terms enriched for the up-regulated (Left) and down-regulated (Right) Rescue-DEGs of RPE after PCC1 treatment. (G) Bar plot showing the ratios of different retinal cell types of PCC1-treated mice compared to aged mice derived from scRNA-seq data. (H) Representative flow charts (Left) and quantification (Right) of the proportion of microglia from the retina of control and PCC1 group (n = 5/group). Data are shown as mean ± SD and were analyzed using unpaired two-tailed Student’s t test; **P < 0.01. (I) Volcano plot showing up-regulated and down-regulated PCC1-DEGs of microglia.
Fig. 4.
Fig. 4.
Clearance of inferred SnC and amelioration of SASP signatures by PCC1 in scRNA-seq data. (A) Heatmap showing the expression pattern of SASP-related genes in different cell types in the retina. (B) Schematic diagram showing predication of SnC in scRNA-seq data. (C) Bar plots showing the GO terms enriched for the up-regulated DEGs of SnC compared to non-SnC in the retina. Similar GO terms are placed together in the same color. (D) t-SNE plots showing the distribution of SnC in the retina of three groups. (E) Bar plot showing the percentage of SnC in all retinal cells of three groups. (F) FC overlay histogram showing the expression of β-gal of CD11B+ microglia cells (orange), CD90.2+ cells (blue), and CD73+ rods (green). Fluorescence intensity is represented on the x-axis and count of the events on the y-axis. (G) Dot plot showing pathways enriched for the up-regulated PCC1-DEGs in SnC of different retinal cell types from the retina. The color key indicates the P value. The dot size is proportional to the number of genes enriched in indicated pathways. (H) Ridge plots showing the gene set scores of NF-κB and p38MAPK signaling pathways of SnC from the aged and PCC1 groups.
Fig. 5.
Fig. 5.
PCC1 demonstrated senolytic and senomorphic effects both in vivo and in vitro. (A) Representative confocal images of retinal frozen sections stained with the TUNEL assay among three groups and bar charts of quantification (n = 6/group). Arrows indicate the representative apoptotic cells. (Scale bar, 50 µm.) (B) Bar plot showing the CCK-8 assay on control and SnC of ARPE-19 cell line upon treatment of PCC1 (n = 5/group). (C) Representative flow charts (Left) and quantification (Right) of the annexin V/PI apoptotic assay on control and SnC of ARPE-19 cell line upon treatment of PCC1 (n = 5/group). (D) The plasma levels of IL-6, IL-1β, and TNF-α in different groups were measured by the ELISA assay (n = 5/group). (EG) The FC histograms (Left) and column charts (Right) showing the level of IL-6 (E), IL-1β (F), and TNF-α (G) in retinal microglia among three groups (n = 5/group). Data are shown as mean ± SD. P values were analyzed using the Kruskal–Wallis test with Bonferroni post hoc test (A) or two-tailed unpaired Student’s t test (B and C) or one-way ANOVA with Bonferroni post hoc test (DG); ns, nonsignificant, *P < 0.05, **P < 0.01, ***P < 0.001, and ****P < 0.0001.
Fig. 6.
Fig. 6.
The therapeutic potential of PCC1 as a senolytic and senomorphic agent in treating age-related retinal disorders. (A) t-SNE plot showing the distribution of different RPE and choroidal cell types. (B) Ridge plot showing the expression of SASP signatures from normal and AMD groups. The dashed lines indicate the mean values. (C) Dot plot showing the incoming and outgoing interaction pattern of different cell types in the cell–cell communication. (D) Network visualization showing cell–cell interactions among different cell types. The line color indicates the source cell types. The edge width indicates the relative interaction strength between a given cell pair, and the dot size indicates the number of cells in each cell type. (E) t-SNE plot showing the distribution of different retinal cell types. (F) Split violin plots showing the ES of SASP-related genes across different cell types between the two groups. (G) Bubble plots showing the changes in cell ratios of SnC in the retina between the two groups. The numbers at the bottom indicate the log2FC values of the cell ratios (DR/Normal). The size of the dots represents the ratios of cells. (H) t-SNE plot showing the distribution of SnC in the retina between the two groups. (I) Bar plot showing the GO terms enriched for the up-regulated DEGs of SnC compared to non-SnC. (JL) Representative FC histogram (Left) and quantification (Right) of MFI of β-GAL (J), p21 (K), and p53 (L) of HRMEC from different groups (n = 5/group). (M and N) The supernatant level of IL-6 and VEGF-A in different groups was measured by ELISA (n = 6/group). (O) Representative flow charts (Left) and quantification (Right) of the proportion of IL-6 in HRMEC from different groups (n = 5/group). Data are shown as mean ± SD, and P values were analyzed using one-way ANOVA with Bonferroni post hoc test (JO); *P < 0.05, **P < 0.01, ***P < 0.001, and ****P < 0.0001.

References

    1. Baker D. J., Petersen R. C., Cellular senescence in brain aging and neurodegenerative diseases: Evidence and perspectives. J. Clin. Invest. 128, 1208–1216 (2018). - PMC - PubMed
    1. Huang L., et al. , Deep Sc-RNA sequencing decoding the molecular dynamic architecture of the human retina. Sci. China Life Sci. 66, 496–515 (2023). - PubMed
    1. Li R., Liang Y., Lin B., Accumulation of systematic TPM1 mediates inflammation and neuronal remodeling by phosphorylating PKA and regulating the FABP5/NF-κB signaling pathway in the retina of aged mice. Aging Cell 21, e13566 (2022). - PMC - PubMed
    1. Ferdous S., et al. , Age-related retinal changes in wild-type C57BL/6J mice between 2 and 32 months. Invest. Ophthalmol. Vis. Sci. 62, 9 (2021). - PMC - PubMed
    1. Samuel M. A., et al. , LKB1 and AMPK regulate synaptic remodeling in old age. Nat. Neurosci. 17, 1190–1197 (2014). - PMC - PubMed

Publication types

LinkOut - more resources