. 2024 Apr 26;10(17):eadk1045.
doi: 10.1126/sciadv.adk1045. Epub 2024 Apr 24.

Sphingolipid biosynthesis is essential for metabolic rewiring during TH17 cell differentiation

Affiliations

Sphingolipid biosynthesis is essential for metabolic rewiring during TH17 cell differentiation

Thiruvaimozhi Abimannan et al. Sci Adv. .

Abstract

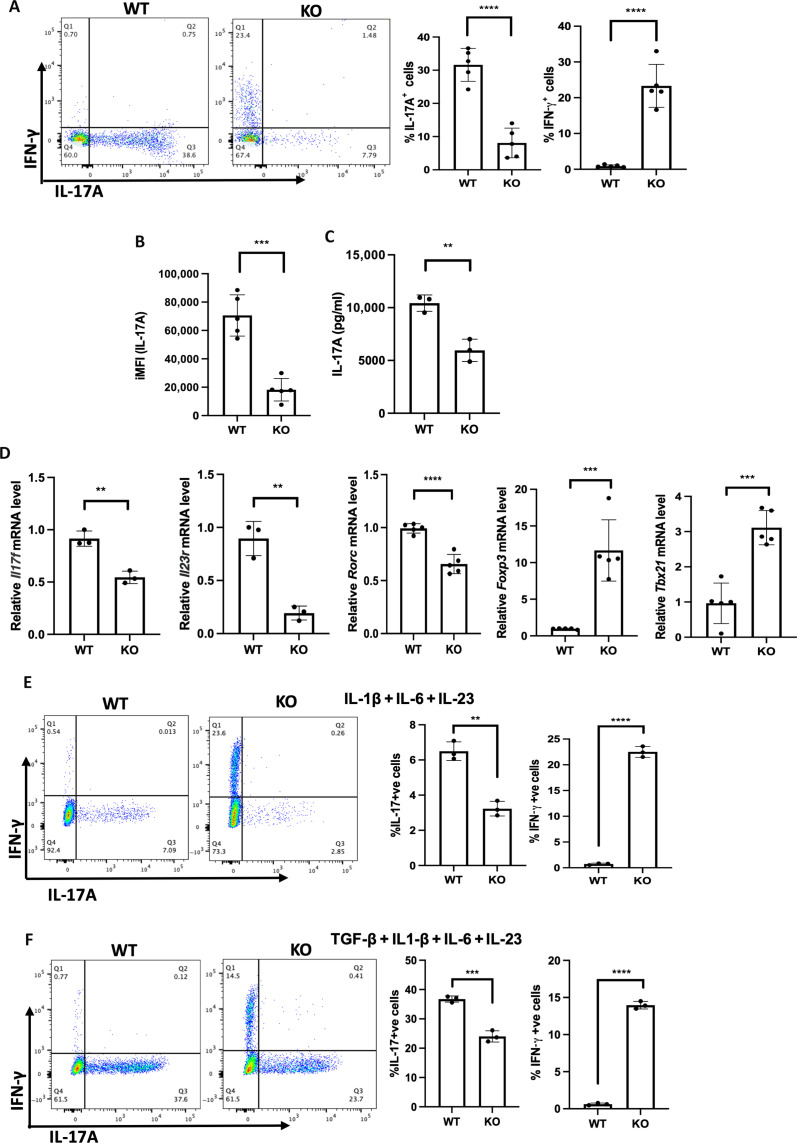
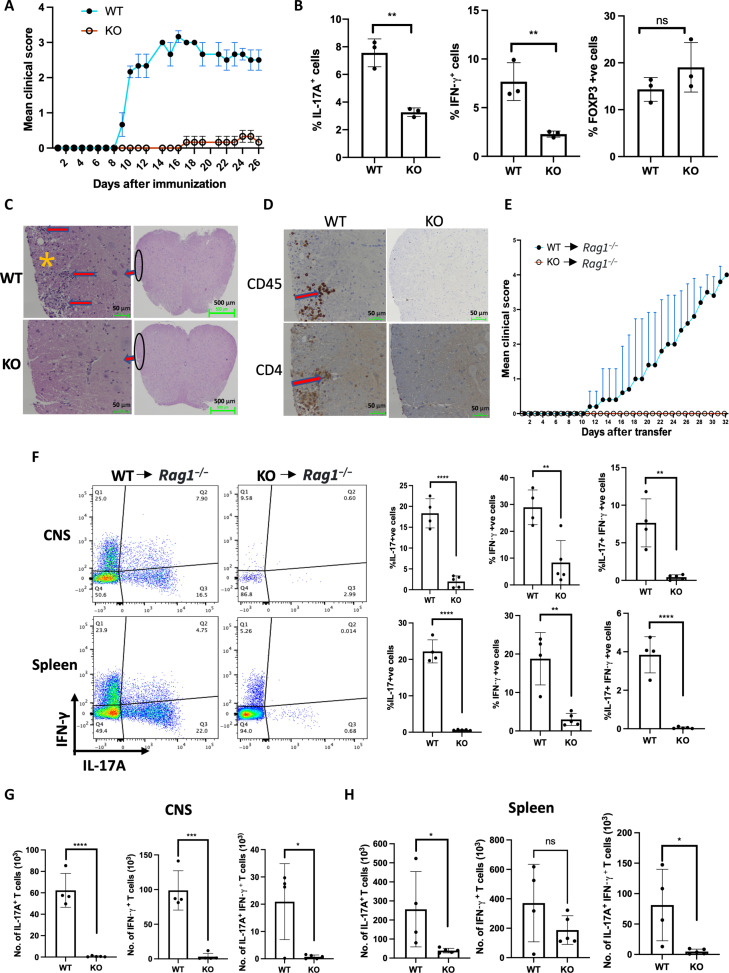
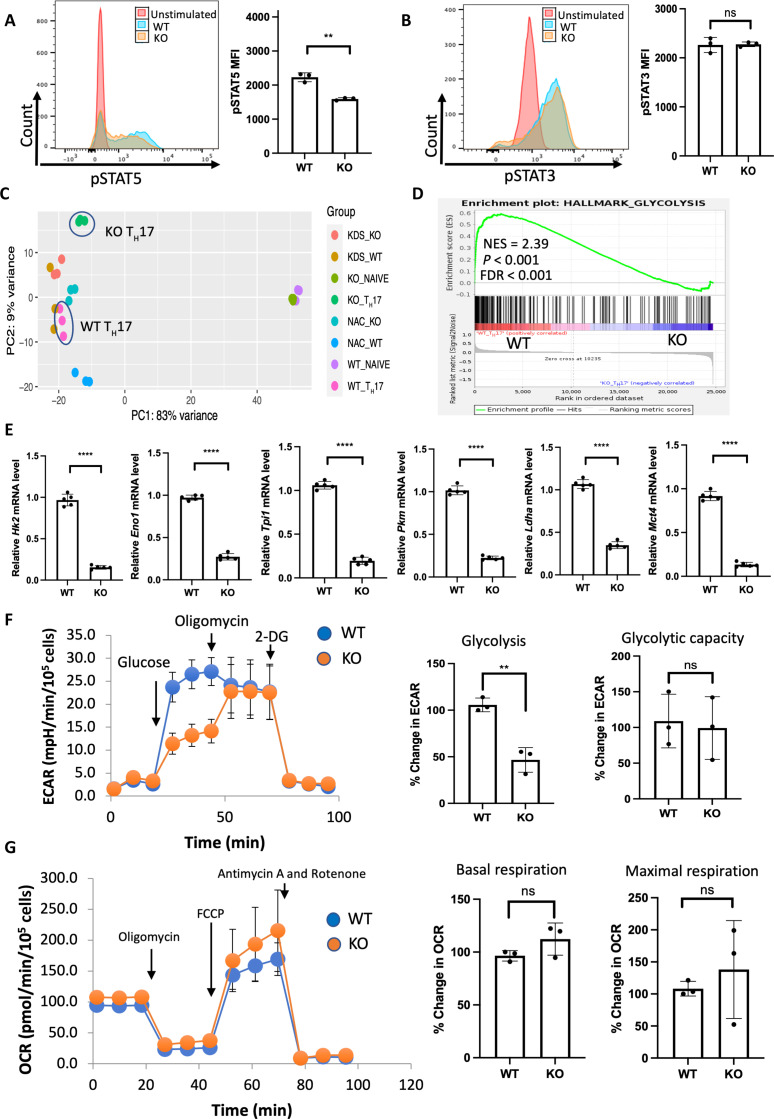
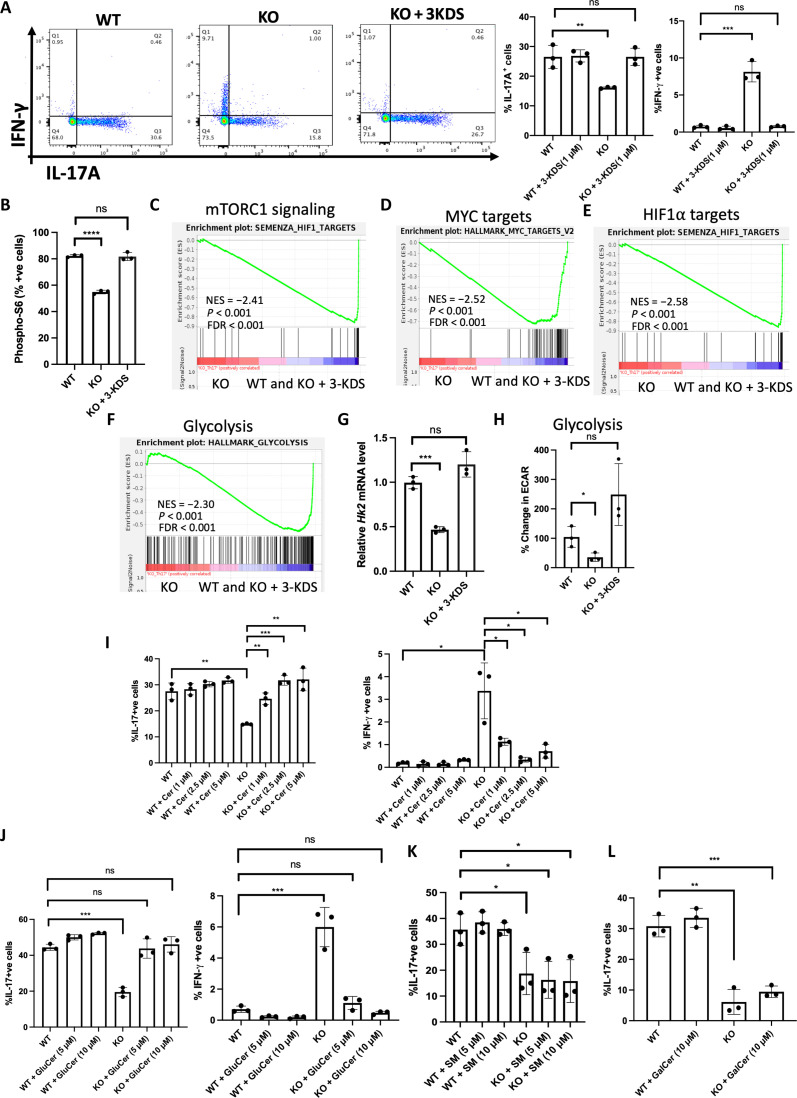
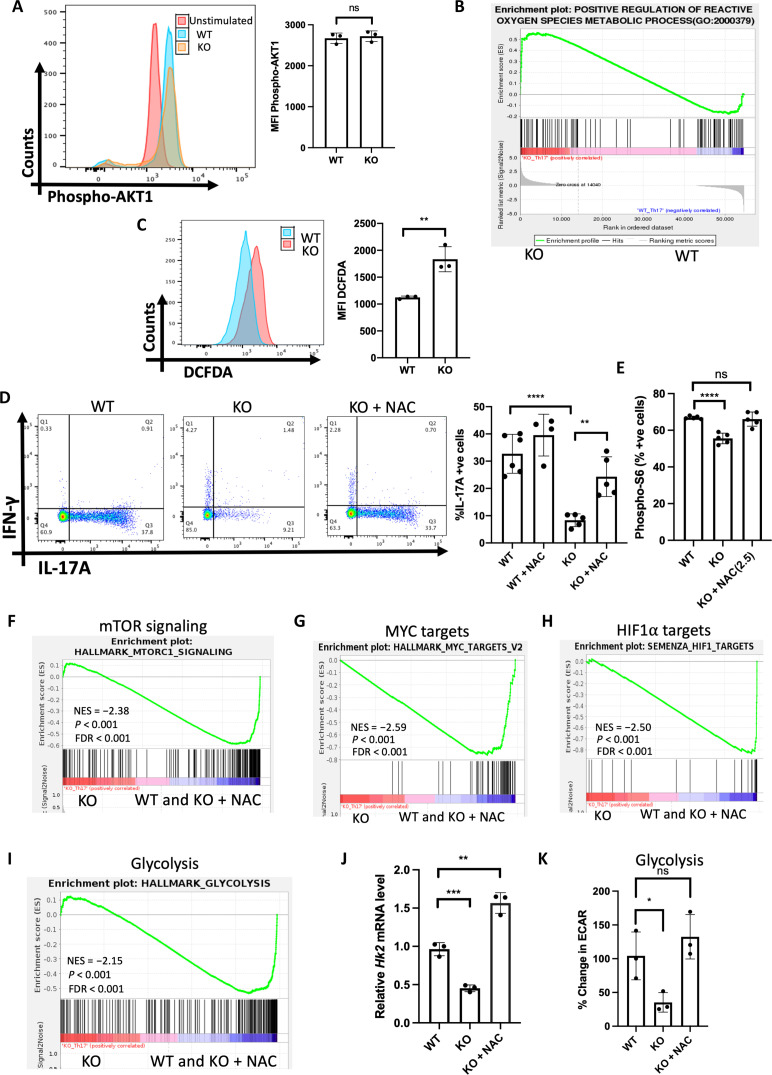
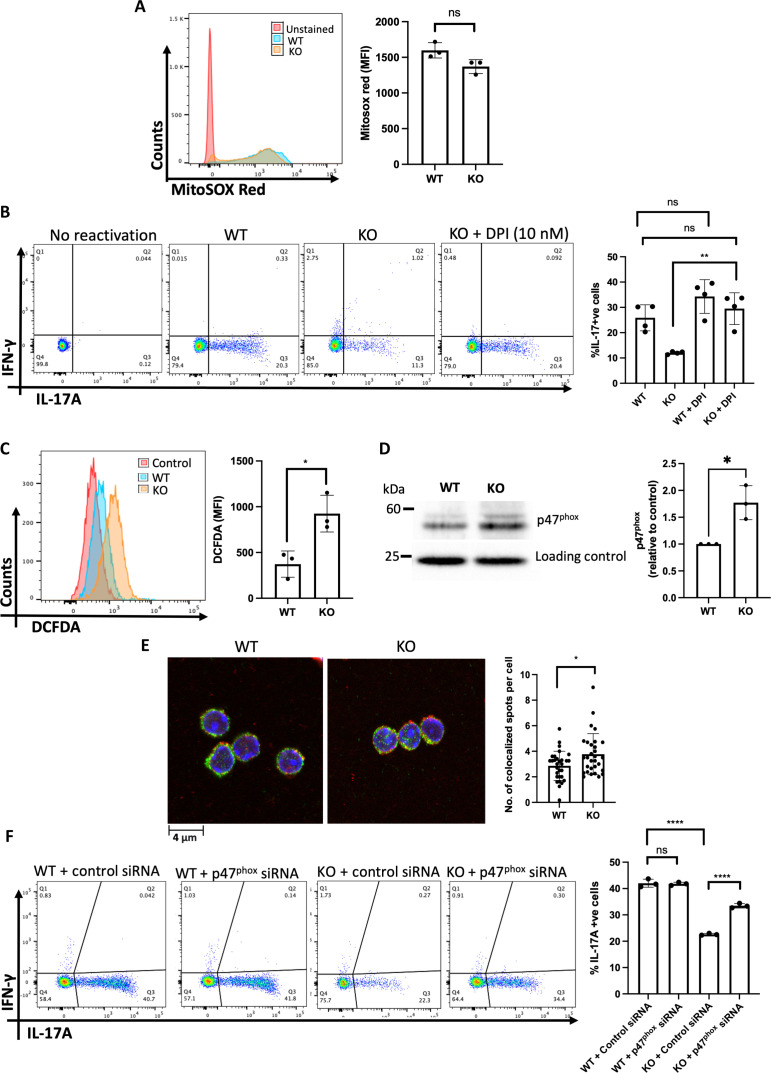
T helper 17 (TH17) cells are implicated in autoimmune diseases, and several metabolic processes are shown to be important for their development and function. In this study, we report an essential role for sphingolipids synthesized through the de novo pathway in TH17 cell development. Deficiency of SPTLC1, a major subunit of serine palmitoyl transferase enzyme complex that catalyzes the first and rate-limiting step of de novo sphingolipid synthesis, impaired glycolysis in differentiating TH17 cells by increasing intracellular reactive oxygen species (ROS) through enhancement of nicotinamide adenine dinucleotide phosphate oxidase 2 activity. Increased ROS leads to impaired activation of mammalian target of rapamycin C1 and reduced expression of hypoxia-inducible factor 1-alpha and c-Myc-induced glycolytic genes. SPTLCI deficiency protected mice from developing experimental autoimmune encephalomyelitis and experimental T cell transfer colitis. Our results thus show a critical role for de novo sphingolipid biosynthetic pathway in shaping adaptive immune responses with implications in autoimmune diseases.


Figures

Fig. 1.
Fig. 1.. SPTLC1 is essential for TH17 differentiation in vitro.
(A) Naïve CD4+ T cells from WT or KO mice were differentiated into TH17 cells (as described in Materials and Methods) for 4 days, and intracellular cytokines were scored by flow cytometry. The left panel is a representative flow figure showing frequency of IL-17A+ and IFN-γ+ cells, and the right panel shows the cumulative data of the same. n = 5 biologically independent samples, representative of five experiments. (B) iMFI of IL-17A. iMFI = (MFI)(P) where, MFI is the median fluorescence intensity of cytokine-positive cells, and P is the percentage of cytokine-positive cells. (C) WT and KO naïve T cells were differentiated under TH17 conditions for 4 days and reactivated with anti-CD3 for 24 hours, and the culture supernatant was analyzed for IL-17A by bioplex assay. n = 3 biologically independent samples. (D) WT and KO naïve T cells were differentiated into TH17 cells for 3 days and RNA quantified by reverse transcription qPCR. n = 3 to 5 biologically independent samples. (E and F) WT and KO naïve CD4+ T cells were differentiated into TH17 cells with IL-1β + IL-6 + IL-23 (E) or TGF-β1 + IL1-β + IL-6 + IL-23 (F) for 4 days and analyzed for frequency of IL-17A+ and IFN-γ+ cells by flow cytometry. The left panel is a representative flow figure, and the right panel shows the cumulative data for the same. n = 3 biologically independent samples. Each dot represents an individual mouse. All data presented as means ± SEM: **P < 0.01; ***P < 0.001; ****P < 0.0001; ns, not significant.
Fig. 2.
Fig. 2.. SPTLC1 is required for TH17 differentiation in vivo.
(A) Mean clinical EAE scores of WT and KO mice immunized with MOG35–45 peptide. n = 3 mice per experimental group, representative of two independent experiments. (B) Frequency of IL-17A+, IFN-γ+, and FOXP3-positive cells in splenocytes of immunized mice at day 28. n = 3 biologically independent samples. (C) Representative hematoxylin and eosin staining of spinal cord sections obtained from indicated immunized mice at day 28. Red arrows and asterisks indicate infiltrated inflammatory cells and demyelinated foci, respectively. Scale bars, 50 μm (left) and 500 μm (right). n = 3 biologically independent samples. (D) Immunohistochemical staining for CD4+ and CD45+ cells in spinal cord sections from immunized WT and KO mice at day 28. The red arrow indicates positive cells. Scale bar, 50 μm. n = 3 biologically independent samples. (E) Mean clinical scores for EAE in RAG−/− mice transferred with equal number of ex vivo differentiated CD4+ T cells from MOG35–45 immunized WT and KO mice. RAG−/− mice receiving WT cells (n = 4); RAG−/− mice receiving KO cells (n = 5). (F to H) CNS and spleen were isolated from the RAG−/− mice receiving WT cells at the peak of the disease and from corresponding RAG−/− mice receiving KO cells and scored for frequency (F) and absolute number (G and H) of IL-17A+, IFN-γ+, and IL-17A+IFN-γ+ DP cells by flow cytometry. (F) The left panel is a representative flow figure, and the right panel shows the cumulative data of the same. The top panel is from CNS and the bottom panel is from spleen. (G and H) CNS (G) and spleen (H). RAG−/− mice receiving WT cells (n = 4); RAG−/− mice receiving KO cells (n = 5). Each dot represents an individual mouse. All data presented as means ± SEM: *P < 0.05; **P < 0.01; ***P < 0.001; ****P < 0.0001; ns, not significant.
Fig. 3.
Fig. 3.. SPTLC1 is required for metabolic reprograming in TH17 cells.
(A) WT and KO naïve cells were differentiated under TH17 conditions for 12 hours and scored for phosphorylated STAT5 by flow cytometry. The left panel is a representative flow figure, and the right panel shows the cumulative data of the pSTAT5 MFI. n = 3 biologically independent samples. (B) WT and KO naïve cells were differentiated under TH17 conditions for 12 hours and scored for phosphorylated STAT3 by flow cytometry. The left panel is a representative flow figure, and the right panel shows the cumulative data of the pSTAT3 MFI. n = 3 biologically independent samples. (C) Principal components analysis (PCA) of WT and KO TH17 cell RNA-seq data. n = 3 biological replicates per group. (D) GSEA result of HALLMARK_GLYCOLYSIS gene sets between WT and KO TH17 cells. (E) qPCR analysis of indicated glycolytic genes in WT and KO TH17 cells (naïve CD4+ T cells cultured under TH17 conditions for 3 days). n = 5 biologically independent samples. (F) WT and KO naïve T cells were differentiated under TH17 conditions for 3 days and ECAR measured in equal number of viable cells by Seahorse analyzer. The left panel shows the representative data, and the right panel shows the percentage change in ECAR for glycolysis and glycolytic capacity. n = 3 biologically independent samples. (G) TH17 cells were differentiated as in (F) and OCR measured in equal number of viable cells by Seahorse analyzer. The left panel shows the representative data, and the right panel shows the cumulative data for basal and maximal respiration. n = 3 biologically independent samples. Each dot represents an individual mouse. All data presented as means ± SEM: **P < 0.01; ****P < 0.0001; ns, not significant.
Fig. 4.
Fig. 4.. SPTLC1 deficiency reduces c-Myc, HIF-1α, and mTORC1 signaling.
(A) Naïve CD4+T cells from WT and KO were differentiated under TH17 conditions for 12 hours and scored for frequency of phospho-S6+ cells by flow cytometry. The left panel is a representative flow figure, and the right panel shows the cumulative percent pS6-positive cells. n = 5 biologically independent samples. (B) Immunoblot of p-4E-BP1 in WT and KO naïve CD4+ T cells differentiated for 12 hours under TH17 polarizing conditions. The left panel shows representative Western blot, and the right panel is the quantitative data for the same. n = 5 biologically independent samples from two independent experiments. (C) GSEA for mTORC1 signaling genes between WT and KO TH17 cells. (D) WT and KO naïve T cells were differentiated into TH17 cells for 3 days and Hif1a mRNA quantified by qPCR. n = 5 biologically independent samples. (E) Immunoblot of HIF-1α in WT and KO naïve CD4+ T cells differentiated for 3 days under TH17 polarizing conditions. The left panel shows representative Western blot, and the right panel is the quantitative data for the same. n = 3 biologically independent samples. (F) Myc mRNA quantified by qPCR in cells differentiated as in (D). n = 5 biologically independent samples. (G) Immunoblot of c-Myc in WT and KO naïve CD4+ T cells differentiated for 12 hours under TH17 polarizing conditions. The left panel shows representative Western blot, and the right panel is the quantitative data for the same. n = 5 biologically independent samples from two independent experiments. (H and I) GSEA for hallmark gene sets (H) c-Myc target genes and (I) HIF-1α target genes between WT and KO TH17 cells. Each dot represents an individual mouse. All data presented as means ± SEM: **P < 0.01; ***P < 0.001; ****P < 0.0001; ns, not significant.
Fig. 5.
Fig. 5.. SPT enzyme product 3-KDS rescues the defects in SPTLC1-deficient TH17 cells.
(A) WT and KO naïve cells were differentiated under TH17 conditions with or without 3-KDS (1 μM) for 4 days and scored for frequency of IL-17A+ and IFN-γ+ cells by flow cytometry. The left panel is a representative flow figure, and the right panel shows the cumulative data of the same. n = 3 biologically independent samples. (B) WT and KO naïve cells were differentiated under TH17 conditions for 12 hours with or without 3-KDS and scored for frequency of phospho-S6+ cells by flow cytometry. n = 3 biologically independent samples. (C to F) GSEA for (C) mTOR signaling genes, (D) c-Myc target genes, (E) HIF-1α target genes, and (F) glycolytic genes between KO and (WT and KO + 3-KDS) TH17 cells. (G) WT and KO naïve cells were differentiated under TH17 conditions with or without 3-KDS (1 μM) for 3 days and Hk2 mRNA quantified by qPCR. n = 3 biologically independent samples. (H) WT and KO naïve T cells were differentiated under TH17 conditions with or without 3-KDS for 3 days and ECAR measured in equal number of viable cells by Seahorse analyzer. n = 3 biologically independent samples. (I to L) WT and KO naïve cells were differentiated under TH17 conditions for 4 days with or without indicated concentrations of (I) C6 ceramide (Cer), (J) glucosylceramide (GluCer), (K) sphingomyelin (SM) (L), and galactosylceramide (GalCer), and reactivated with phorbol 12-myristate 13-acetate/ionomycin for 6 hours and scored for frequency of IL-17A+ and IFN-γ+ cells by flow cytometry. (I and J) Left: %IL-17A+ cells; right: % IFN-γ+ cells. n = 3 biologically independent samples. Each dot represents an individual mouse. All data presented as means ± SEM: *P < 0.05; **P < 0.01; ***P < 0.001; ****P < 0.0001; ns, not significant.
Fig. 6.
Fig. 6.. SPTLC1 deficiency impairs TH17 differentiation by increasing intracellular ROS.
(A) WT and KO naïve cells were differentiated under TH17 conditions for 12 hours and scored for phospho-Akt(S473) by flow cytometry. The left panel is a representative flow figure, and the right panel shows cumulative p-Akt MFI. n = 3 biologically independent samples. (B) GSEA for positive regulation of ROS genes between WT and KO TH17 cells. (C) WT and KO naïve cells were differentiated under TH17 conditions for 12 hours and intracellular ROS measured using DCFDA by flow cytometry. The left panel is a representative flow figure, and the right panel shows the cumulative data of DCFDA MFI. n = 3 biologically independent samples. (D) WT and KO naïve cells were differentiated under TH17 conditions for 4 days with or without NAC and scored for intracellular cytokine. The left panel is a representative flow figure, and the right panel shows the cumulative data of the same. n = 4 to 6 biologically independent samples. (E) WT and KO naïve cells were differentiated under TH17 conditions with or without NAC for 12 hours and scored for frequency of phospho-S6+ cells by flow cytometry. n = 5 biologically independent samples. (F to I) GSEA for (F) mTOR signaling genes, (G) c-Myc target genes, (H) HIF-1α target genes, and (I) glycolytic genes KO and (WT and KO + NAC) TH17 cells. n = 3 biologically independent samples. (J) Hk2 mRNA quantification by qPCR of TH17 under the indicated differentiation conditions. n = 3 biologically independent samples. (K) WT and KO naïve T cells were differentiated under TH17 conditions with or without NAC for 3 days and ECAR was measured in equal number of viable cells by Seahorse analyzer. n = 3 biologically independent samples. Each dot represents an individual mouse. All data presented as means ± SEM: *P < 0.05; **P < 0.01; ***P < 0.001; ****P < 0.0001; ns, not significant.
Fig. 7.
Fig. 7.. SPTLC1 deficiency increases intracellular ROS by enhancing NOX activity.
(A) WT and KO naïve CD4+ T cells were differentiated under TH17 conditions for 12 hours and mitochondrial ROS measured using Mitosox red. The left panel is a representative histogram, and the right panel shows the cumulative data (MFI) from n = 3 biologically independent samples. (B) WT and KO naïve CD4+ T cells were differentiated under TH17 conditions for 4 days with or without DPI (10 nM) and scored for intracellular cytokines. The left panel is a representative flow figure, and the right panel shows the cumulative data from n = 4 biologically independent samples. (C) WT and KO naïve CD4+ T cells cross-linked with anti-CD3 for 15 min with DCFDA and read in flow cytometry. The left panel is a representative histogram, and the right panel shows the cumulative data (MFI) from n = 3 biologically independent samples. (D) WT and KO naïve CD4+ T cells cross-linked as in (C) and membrane fraction immunoblotted for p47 phox. Each lane is a pooled sample from four to eight mice. The left panel shows representative blot, and the right panel is the quantitative data from three independent experiments. (E) CD4+ T cells cross-linked as in (C) and stained for gp91phox (green) and p47 phox (red) and analyzed using confocal microscopy. The left panel shows the representative confocal picture, and the right panel shows the number of colocalization spots per cell. n = 3 biologically independent samples. (F) WT and KO Naïve CD4+ T cells were nucleofected with control or p47phox siRNA, differentiated into TH17 cells, and scored for intracellular cytokines. The left panel is a representative flow figure, and the right panel shows the cumulative data. Each dot represents cells pooled from three mice. n = 3 independent experiment. All data presented as means ± SEM: *P < 0.05; **P < 0.01; ****P < 0.0001; ns, not significant.

References

    1. Harrington L. E., Hatton R. D., Mangan P. R., Turner H., Murphy T. L., Murphy K. M., Weaver C. T., Interleukin 17-producing CD4+ effector T cells develop via a lineage distinct from the T helper type 1 and 2 lineages. Nat. Immunol. 6, 1123–1132 (2005). - PubMed
    1. Park H., Li Z., Yang X. O., Chang S. H., Nurieva R., Wang Y. H., Wang Y., Hood L., Zhu Z., Tian Q., Dong C., A distinct lineage of CD4 T cells regulates tissue inflammation by producing interleukin 17. Nat. Immunol. 6, 1133–1141 (2005). - PMC - PubMed
    1. Tesmer L. A., Lundy S. K., Sarkar S., Fox D. A., Th17 cells in human disease. Immunol. Rev. 223, 87–113 (2008). - PMC - PubMed
    1. Bettelli E., Carrier Y., Gao W., Korn T., Strom T. B., Oukka M., Weiner H. L., Kuchroo V. K., Reciprocal developmental pathways for the generation of pathogenic effector TH17 and regulatory T cells. Nature 441, 235–238 (2006). - PubMed
    1. Mangan P. R., Harrington L. E., O'Quinn D. B., Helms W. S., Bullard D. C., Elson C. O., Hatton R. D., Wahl S. M., Schoeb T. R., Weaver C. T., Transforming growth factor-β induces development of the TH17 lineage. Nature 441, 231–234 (2006). - PubMed

Publication types

MeSH terms