. 2024 Apr 26;10(17):eadn1837.
doi: 10.1126/sciadv.adn1837. Epub 2024 Apr 24.

Polycomb protein binding and looping in the ON transcriptional state

Affiliations

Polycomb protein binding and looping in the ON transcriptional state

J Lesley Brown et al. Sci Adv. .

Abstract

Polycomb group (PcG) proteins mediate epigenetic silencing of important developmental genes by modifying histones and compacting chromatin through two major protein complexes, PRC1 and PRC2. These complexes are recruited to DNA by CpG islands (CGIs) in mammals and Polycomb response elements (PREs) in Drosophila. When PcG target genes are turned OFF, PcG proteins bind to PREs or CGIs, and PREs serve as anchors that loop together and stabilize gene silencing. Here, we address which PcG proteins bind to PREs and whether PREs mediate looping when their targets are in the ON transcriptional state. While the binding of most PcG proteins decreases at PREs in the ON state, one PRC1 component, Ph, remains bound. Further, PREs can loop to each other and with presumptive enhancers in the ON state and, like CGIs, may act as tethering elements between promoters and enhancers. Overall, our data suggest that PREs are important looping elements for developmental loci in both the ON and OFF states.


Figures
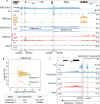
Fig. 1.
Fig. 1.. Transcription, PcG binding, and epigenetic patterns at the inv-en locus in S2 and D17 cells.
(A) IGV tracks show the RNA sequencing (RNA-seq) and ChIP-seq data at the inv-en locus. The top two tracks show the H3K27me3 and Ph occupancy from larval brains and discs. The asterisks under the Ph peaks indicate the four major PREs, and the red dots represent minor PREs. The data for S2 and D17 cells are shown at bottom. The blue bars denote the subdomain 1 (H3K27ac covered) and subdomain 2 (H3K27me3 covered). (B) MA plot shows the alterations of H3K27me3 levels between D17 and S2 cells. The two subdomains of inv-en locus are highlighted by green arrows, with their detailed statistics shown at bottom. (C) Enlarged view of H3K27me3 and H3K27ac intensity over the two enPREs (asterisks). The two PREs fall into different subdomains with a precise border flanking enPRE2. The transition between the two subdomains is marked by the black line and opposing arrows.
Fig. 2.
Fig. 2.. Binding of core PcG and related proteins at inv-en PREs in S2 and D17 cells.
(A and B) IGV tracks show the occupancy of different PcG proteins from different complexes (PRC1, PRC2, and Pho-RC), DNA binding factors, and chromatin accessibility on the four major inv-en PREs in S2 and D17 cells. (C) Bar plots show the differences in ChIP signals for different PcG proteins and related factors at each individual inv-en PREs between D17 and S2 cells.
Fig. 3.
Fig. 3.. Altered binding of PcG-related proteins on PREs in S2 and D17 cells.
(A) Heatmaps show the ChIP signal on all PREs. (B) Heatmaps show the ChIP signal on the D17-ON PREs. For the heatmaps in (A) and (B), the color gradients represent the reads per kilobase per million mapped reads (RPKM) values calculated from ChIP-seq data. (C) Differences of ChIP signal (D17 versus S2) on all PREs (brown) or D17-ON PREs (pink for the “original” difference and red for the “adjusted” difference). ChIP signal is normalized as RPKM values from the ChIP-seq data. The curves are smoothed by the “loess” method. (D) The expression level of different groups of genes in S2 and D17 cells. The gene groups include all genes (gray) or the genes with their TSSs less than 1 kb from any PREs (orange) or D17-ON PREs (green). Gene expression is evaluated as transcripts per million (TPM) values. The P values were calculated using two-sided Student’s t test. (E) Differential expression (D17 versus S2) for different groups of genes. The P values were calculated by two-sided Student’s t test. (F) The correlation between the altered expression and the altered H3K27me3 levels for PRE-adjacent genes (i.e., genes with their TSSs ≤1 kb to PREs). The Pearson’s r and P value are indicated.
Fig. 4.
Fig. 4.. PcG binding and chromatin structure over the inv-en domain in S2 and D17 cells.
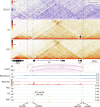
The contact map at top shows the differences between S2 and D17 cells, while the other two are for each cell type. The arrow points to the en transcription unit that forms its own small domain in S2 cells, whereas it is in the same domain as inv in D17 cells. The significant loops are visualized as arcs below the gene models, and the corresponding loop-dots are also highlighted by green circles in the contact maps. ChIP-seq tracks for H3K27me3, H3K27ac, Pho, GAF, and Ph are shown at the bottom, with the D17-specific GAF binding sites highlighted in orange rectangles. The positions of the inv-en PREs are indicated by dashed lines at the top and labeled at bottom.
Fig. 5.
Fig. 5.. Transcription, PcG binding, and chromatin structure over the bab1/bab2, mab-21, and croc domains in S2 and D17 cells.
The top are for the RNA-seq, ATAC-seq, and ChIP-seq data, and the bottom are for micro-C data. The significant loops are visualized as arcs at the top of the contact maps. The dashed lines highlight the presumptive PREs. (A) bab1/bab2. The oval in the contact maps highlight an area of different chromatin structure between S2 and D17 cells. (B) mab-21. The rectangles highlight the major differences in the binding of the PRC1 components Pc and Scm, and the PRC2 associated protein Pcl between S2 and D17 cells. The arrows points to the interaction of the two major PREs that is present in both cell types. At this locus, the changes of the domains do not correlate with changes in PRE binding. (C) The black rectangles highlight the altered binding of Pc, Scm, and Pcl between S2 and D17 cells. The red rectangles highlight a region with elevated binding of GAF, Spps, and chromatin accessibility and a previously unknown transcript in D17 cells. The oval in the contact map highlights the interaction of the croc PREs with this accessible region in D17 cells. The arrows point to the interaction between the two PREs upstream of croc.

Update of

References

    1. Lewis E. B., A gene complex controlling segmentation in Drosophila. Nature 276, 565–570 (1978). - PubMed
    1. Schuettengruber B., Bourbon H. M., Di Croce L., Cavalli G., Genome regulation by polycomb and trithorax: 70 years and counting. Cell 171, 34–57 (2017). - PubMed
    1. Kuroda M. I., Kang H., De S., Kassis J. A., Dynamic competition of polycomb and trithorax in transcriptional programming. Annu. Rev. Biochem. 89, 235–253 (2020). - PMC - PubMed
    1. Kassis J. A., Kennison J. A., Tamkun J. W., Polycomb and trithorax group genes in Drosophila. Genetics 206, 1699–1725 (2017). - PMC - PubMed
    1. Kim J. J., Kingston R. E., Context-specific Polycomb mechanisms in development. Nat. Rev. Genet. 23, 680–695 (2022). - PMC - PubMed

Publication types