. 2024 Apr 26;10(17):eadm9281.
doi: 10.1126/sciadv.adm9281. Epub 2024 Apr 24.

Autonomous circadian rhythms in the human hepatocyte regulate hepatic drug metabolism and inflammatory responses

Affiliations

Autonomous circadian rhythms in the human hepatocyte regulate hepatic drug metabolism and inflammatory responses

Sandra March et al. Sci Adv. .

Abstract

Critical aspects of physiology and cell function exhibit self-sustained ~24-hour variations termed circadian rhythms. In the liver, circadian rhythms play fundamental roles in maintaining organ homeostasis. Here, we established and characterized an in vitro liver experimental system in which primary human hepatocytes display self-sustained oscillations. By generating gene expression profiles of these hepatocytes over time, we demonstrated that their transcriptional state is dynamic across 24 hours and identified a set of cycling genes with functions related to inflammation, drug metabolism, and energy homeostasis. We designed and tested a treatment protocol to minimize atorvastatin- and acetaminophen-induced hepatotoxicity. Last, we documented circadian-dependent induction of pro-inflammatory cytokines when triggered by LPS, IFN-β, or Plasmodium infection in human hepatocytes. Collectively, our findings emphasize that the phase of the circadian cycle has a robust impact on the efficacy and toxicity of drugs, and we provide a test bed to study the timing and magnitude of inflammatory responses over the course of infection in human liver.


Figures
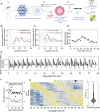
Fig. 1.
Fig. 1.. Primary human hepatocytes display a circadian rhythm in culture.
(A) Experimental work-flow. (1) PHHs are seeded on collagen-coated plates to create hepatocyte islands. (2) Transduction with Bmal1-luc reporter lentiviral particles. (3) Seeding of mouse fibroblasts, 24 hours later. (4) Synchronization and monitoring of luciferase-based Bmal1 cyclic expression. (B) Visualization of circadian rhythm in real time. Circadian rhythm of transduced PHH with Bmal1-luc reporter was monitored in real time at 20-s sampling resolution by light emission of luciferase over 4 days in free-running conditions. To synchronize the hepatocytes, the cultures were placed in specialized circadian (black) or hepatocyte media (red). For 96 hours, their circadian rhythm was monitored in real time. Circadian time is defined as hours after synchronization by media change. (C) Anti-phasic Bmal1 expression of PHH cultures. Synchronization of two sets of PHH cultures was performed with a circadian medium change 12 hours apart, allowing them to free-run under constant conditions for 96 hours. (D) Daily albumin secretion in PHH over 10-week period. (E) Circadian rhythm of Bmal1-luc reporter–transduced PHH was observed over a period of 10 weeks. Between each 96-hour monitoring of the circadian rhythms, a new synchronization of the cultures was triggered by circadian media exchange. (F) Hepatocytes show stable circadian relaxation-time and peak-to-trough ratio (PTR) of Bmal1 gene expression over a 10-week period. (G) Transcriptomic analysis of oscillating transcripts. Heatmap representation of oscillating transcripts ordered by the time of the oscillation (columns), during a period of 48 hours. Each vertical column represents a time point (3-hour resolution). Each row is a cycling transcript, colored based on the expression intensities, low (blue) and high (yellow) (BHQ < 0.2). Expression values are mean-normalized for each gene and are ordered by peak time of expression (left). PTR for rhythmic genes (right). RLU, relative light unit; a.u., arbitrary unit.
Fig. 2.
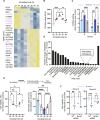
Fig. 2.. Loss of Bmal1 expression disrupts expression of genes involved in inflammatory signaling and drug metabolism in PHH.
(A) Unclustered heatmaps of genes differentially expressed (logFC of 1, adjusted P of 0.05 cutoffs) in Bmal1-siRNA–treated [knockout (KO)] versus those treated with a nontargeting siRNA construct (NT). CT, circadian time in hours. (B) Canonical pathways GSEA. Top 10 statistically differentially expressed gene sets that were up- (black) or down-regulated (gray) in Bmal1 knockdown cultures from MSigDB. Analysis of the CT24 time point. (C) Metabolism of xenobiotics by CYP450 (top) and IFN-α or IFN-β signaling (bottom) enrichment profiles. Arrows indicate the localization of CYP3A4 and ISG20 in the respective gene sets. (D) qRT-PCR validation. Up-regulation of CYP3A4 (top) (black) and down-regulation of ISG20 (bottom) (gray) are observed in Bmal1 knockdown cultures. Analysis performed at CT48. FDR. false discovery rate; NES, normalized enrichment score. *P < 0.05.
Fig. 3.
Fig. 3.. PHH exhibit circadian-dependent patterns of drug metabolism.
(A) Transcriptomic analysis of oscillating transcripts involved in drug metabolism. Phase sorted heat map of cycling ADME genes over a 24-hour period. Each vertical column represents a time point (3-hour resolution). Each row is a cycling transcript, colored based on the expression intensities, from low (blue) to high (yellow) (BHQ < 0.2). Expression values are mean-normalized for each gene and are ordered by the peak of expression. (B) CYP3A4 luminogenic activity assay. An activity-based luminogenic assay was used to determine CYP3A4 enzymatic activity in synchronized hepatocytes every 6 hours, over a 24-hour period. (C) Impact of rifampin induction on CYP3A4 activity. Synchronized cultures at CT24, CT36, and CT48 were dosed with rifampin (10 μM), and 24 hours later, CYP3A4 activity was measured via luminogenic assay. (D) Putative candidates for chronotherapy. Drugs metabolized by CYP3A4 with t½ < 6 hours. (E) Atorvastatin hepatotoxicity mediated by CYP3A4. Schematic showing the metabolism of atorvastatin by CYP3A4 and its by-products (top). Adenosine 5′-triphosphate (ATP)–based real-time viability assay to determine CYP3A4-metabolized toxicity of atorvastatin in PHH cultures synchronized 5 to 7 hours apart (CT24 versus CT30 versus CT35 versus CT42 versus CT48). Atorvastatin was added (200 μM) and viability was monitored for 2 hours (bottom left). Albumin levels measured 12 hours after dosing with atorvastatin (bottom right). CT24, CT30, CT35, CT42, and CT48 are defined, respectively as, 24, 30, 35, 42, and 48 hours after synchronization by media change. (F) Circadian-dependent Atorvastatin hepatoxicity in Bmal1-silenced hepatocytes. Atorvastatin was added at 200 μM, and real-time viability was measured for 2 hours in two independent PHH donors. Data are mean ± SEM. n = 3 or n = 4 independent wells. Statistical significance was determined using a two-way analysis of variance (ANOVA) with post hoc pairwise comparisons. ****P < 0.0001, ***P < 0.001,**P < 0.01, and *P < 0.05.
Fig. 4.
Fig. 4.. Circadian control of the hepatocyte inflammatory response.
(A) Circadian-dependent inflammatory response to an immune challenge mimicked by IFN-β exposure. Schematic of induction via immune stimuli challenge (left). Expression of inflammatory cytokines was measured by qPCR. mRNA was isolated from synchronized hepatocyte cultures harvested at 12 and 24 hours after IFN-β treatment (1000 U/ml) at either CT24 (light red), CT36 (dark red), or CT48 (gray). Levels of cytokine mRNA were quantified [relative to glyceraldehyde-3-phosphate dehydrogenase (GAPDH)] and presented in relation to expression levels in hepatocytes harvested at CT24 from control groups [showing induction levels of cells harvested at 12 hours for CXCL10 (middle) or 24 hours for CXCL11 (right) after induction with IFN-β]. (B) Circadian-dependent inflammatory response to IFN-β in Bmal1-silenced hepatocytes. Expression of inflammatory cytokines was measured by qPCR. Levels of cytokine mRNA were quantified (relative to GAPDH) and presented in relation to expression levels in hepatocytes harvested at CT24 from nontargeting or Bmal1 siRNA IFN-β–treated groups. (C) Inflammatory response to circadian-dependent LPS immune challenge. Schematic of induction with immune challenge (left). Expression of inflammatory cytokines was measured by qPCR. mRNA was isolated from synchronized hepatocyte cultures harvested at 4 hours after LPS treatment at either CT24 (light blue), CT36 (dark blue), or CT48 (gray). Levels of cytokine mRNA were quantified (relative to GAPDH) and are presented in relation to expression levels in hepatocytes harvested at CT24 from the control group. (D) Circadian-dependent inflammatory response to LPS in Bmal1-silenced hepatocytes. Expression of inflammatory cytokines was measured by qPCR. Levels of cytokine mRNA were quantified (relative to GAPDH) and presented in relation to expression levels in hepatocytes harvested at CT24 from nontargeting or Bmal1 siRNA LPS-treated groups. Data are mean ± SEM. n = 3 independent wells. Statistical significance was determined using a two-way ANOVA with post hoc pairwise comparisons. ****P < 0.0001, ***P < 0.001, **P < 0.01, and *P < 0.05.
Fig. 5.
Fig. 5.. Circadian control of hepatocyte infection.
(A) Infection of hepatocytes by malaria-causing P. falciparum sporozoites. Experimental workflow (left). mRNA was isolated from synchronized hepatocytes cultures harvested at 3 hours after infection at CT24 or CT36. Transcript levels of ISG15 and MX1 mRNA were first normalized relative to GAPDH and are presented in relation to expression levels in mock-infected hepatocytes harvested at CT24 (right). Data are mean ± SEM. n = 3 independent wells. Statistical significance was determined using a two-way ANOVA. *P < 0.05. (B) Malaria life cycle schematic depicting the obligate initial liver stage expansion before egress to the blood (left). Quantification of intracellular parasites at 3 hours (corresponding to the transition from stage 2 to 3 in the left hand schematic) and 3 days (corresponding to schematic stages 3 and 4) after infection. Representative image of P. falciparum infection (parasite EEFs are identified by anti-HSP70 (green) and anti–circumsporozoite protein (red) staining) in human MPCCs at day 3 (right). Scale bar, 5 μm. Data are means ± SEM. n = 3 independent wells. Statistical significance was determined using an unpaired t test. *P < 0.05. (left). RBCs, red blood cells. PfCSP, P. falciparum circumsporozoite protein.

References

    1. Skarke C., Lahens N. F., Rhoades S. D., Campbell A., Bittinger K., Bailey A., Hoffmann C., Olson R. S., Chen L., Yang G., Price T. S., Moore J. H., Bushman F. D., Greene C. S., Grant G. R., Weljie A. M., Fitzgerald G. A., A pilot characterization of the human chronobiome. Sci. Rep. 7, 17141 (2017). - PMC - PubMed
    1. Fitzgerald G. A., Yang G., Paschos G. K., Liang X., Skarke C., Molecular clocks and the human condition: Approaching their characterization in human physiology and disease. Diabetes Obes. Metab. 17 (suppl. 1), 139–142 (2015). - PMC - PubMed
    1. Cederroth C. R., Albrecht U., Bass J., Brown S. A., Dyhrfjeld-Johnsen J., Gachon F., Green C. B., Hastings M. H., Helfrich-Förster C., Hogenesch J. B., Lévi F., Loudon A., Lundkvist G. B., Meijer J. H., Rosbash M., Takahashi J. S., Young M., Canlon B., Medicine in the fourth dimension. Cell Metab. 30, 238–250 (2019). - PMC - PubMed
    1. Mure L. S., Le H. D., Benegiamo G., Chang M. W., Rios L., Jillani N., Ngotho M., Kariuki T., Dkhissi-Benyahya O., Cooper H. M., Panda S., Diurnal transcriptome atlas of a primate across major neural and peripheral tissues. Science 359, eaao0318 (2018). - PMC - PubMed
    1. Qian D. C., Kleber T., Brammer B., Xu K. M., Switchenko J. M., Janopaul-Naylor J. R., Zhong J., Yushak M. L., Harvey R. D., Paulos C. M., Lawson D. H., Khan M. K., Kudchadkar R. R., Buchwald Z. S., Effect of immunotherapy time-of-day infusion on overall survival among patients with advanced melanoma in the USA (MEMOIR): A propensity score-matched analysis of a single-centre, longitudinal study. Lancet Oncol. 22, 1777–1786 (2021). - PubMed

Publication types