Clinical Trial
. 2024 Aug 8;144(6):615-628.
doi: 10.1182/blood.2023022823.

Correlation of immune fitness with response to teclistamab in relapsed/refractory multiple myeloma in the MajesTEC-1 study

Affiliations
Clinical Trial

Correlation of immune fitness with response to teclistamab in relapsed/refractory multiple myeloma in the MajesTEC-1 study

Diana Cortes-Selva et al. Blood. .

Abstract

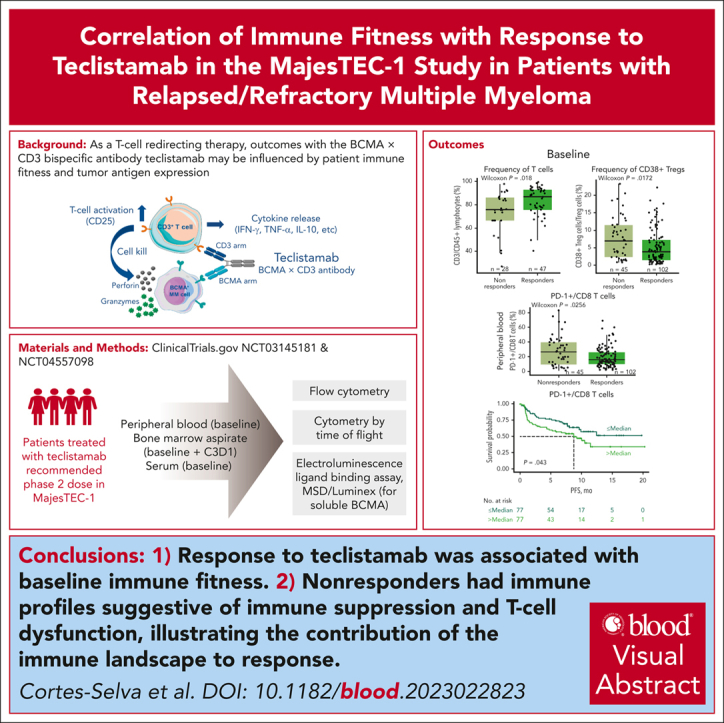
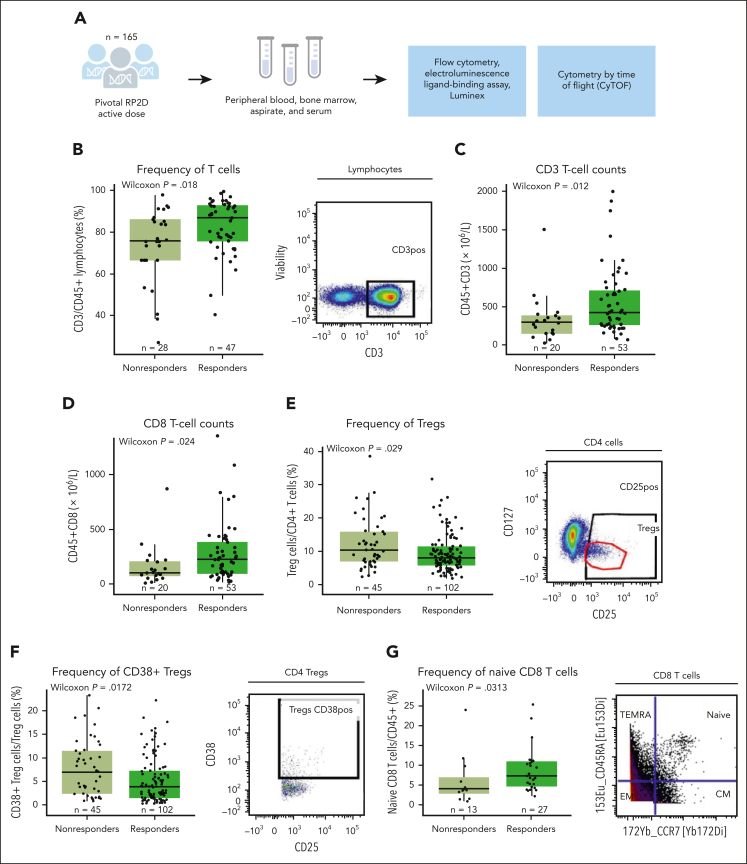
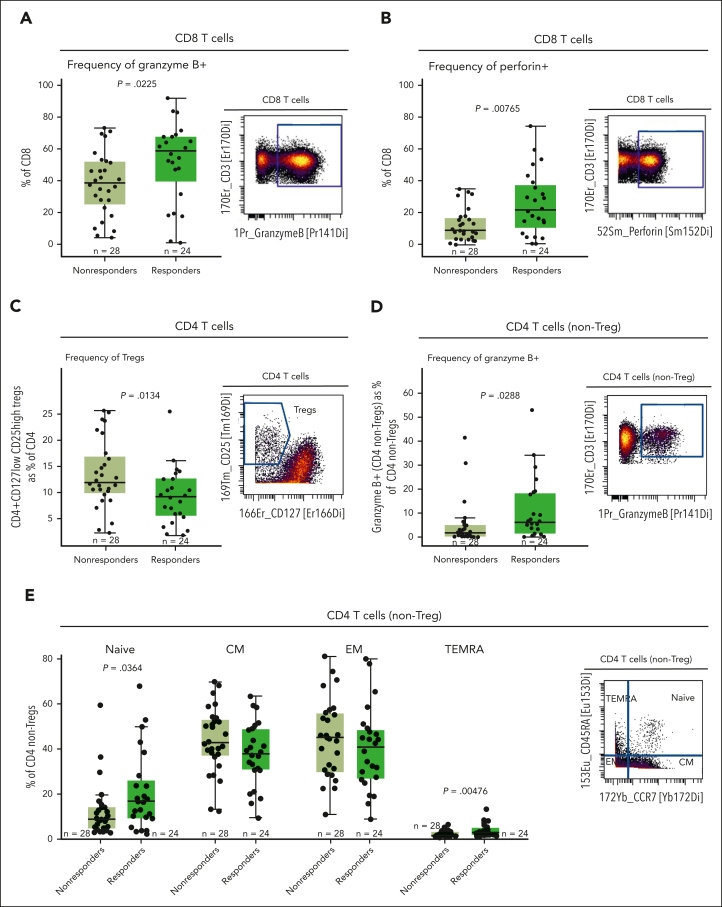
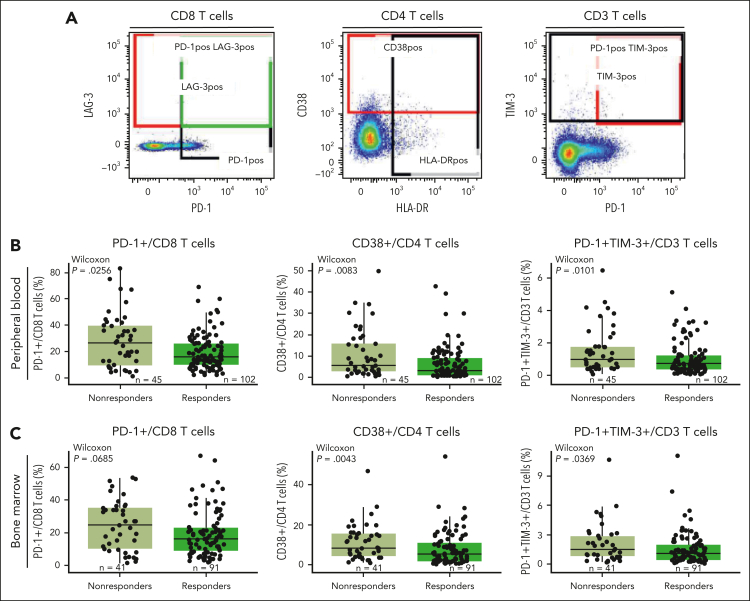
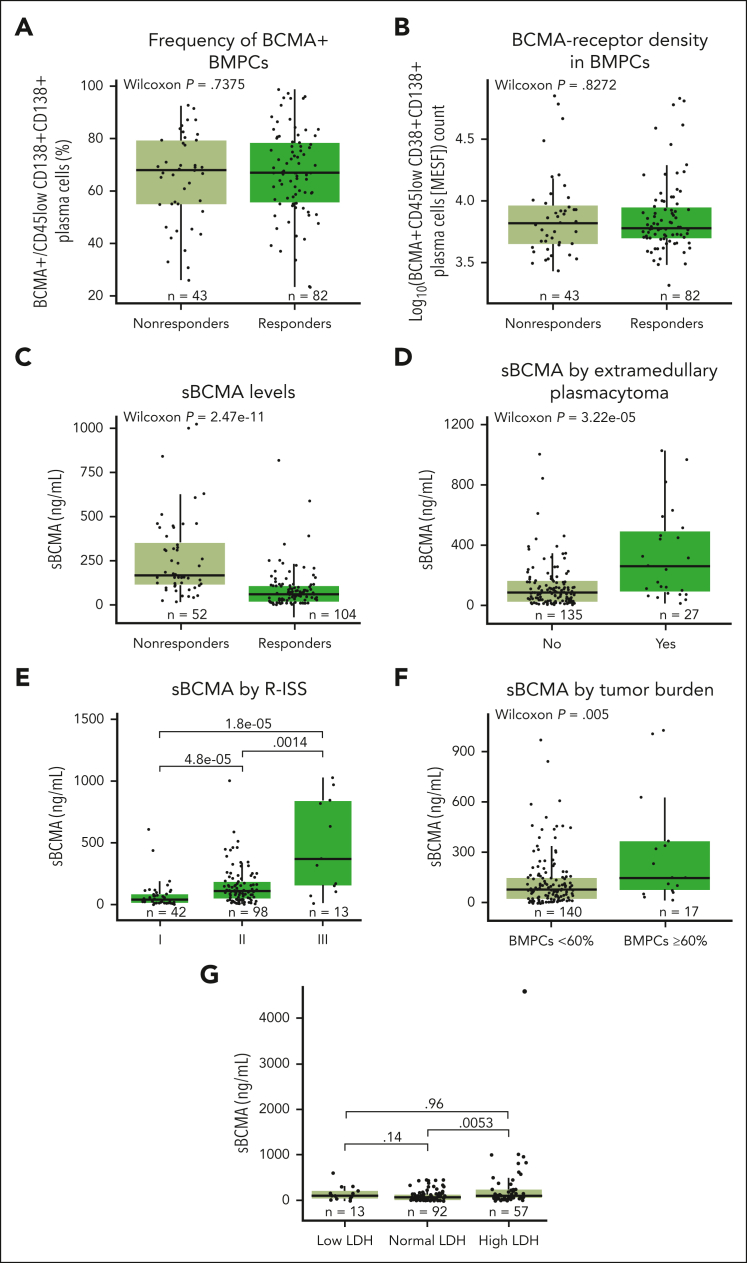
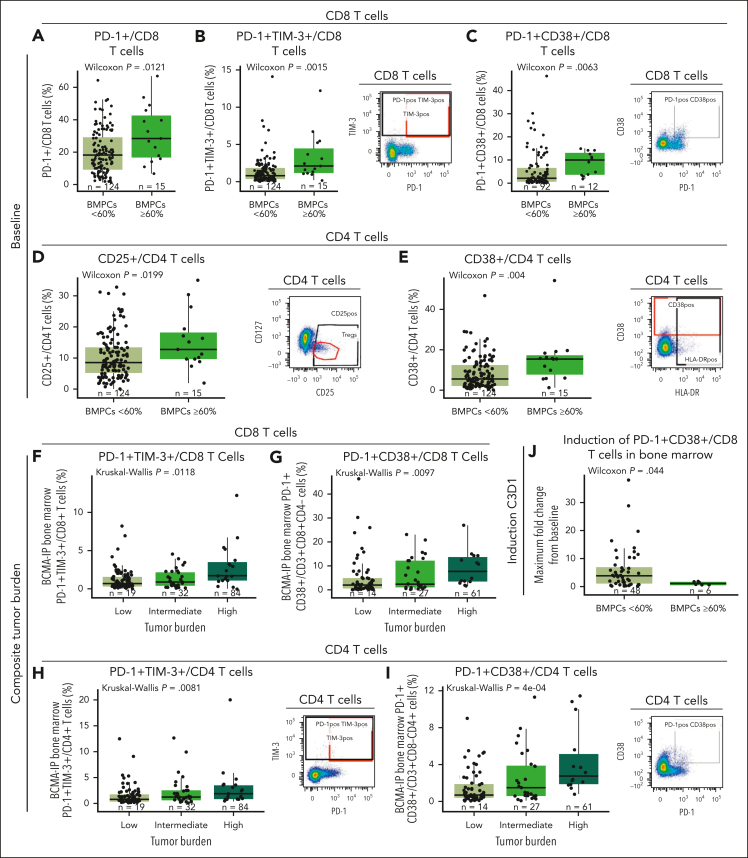
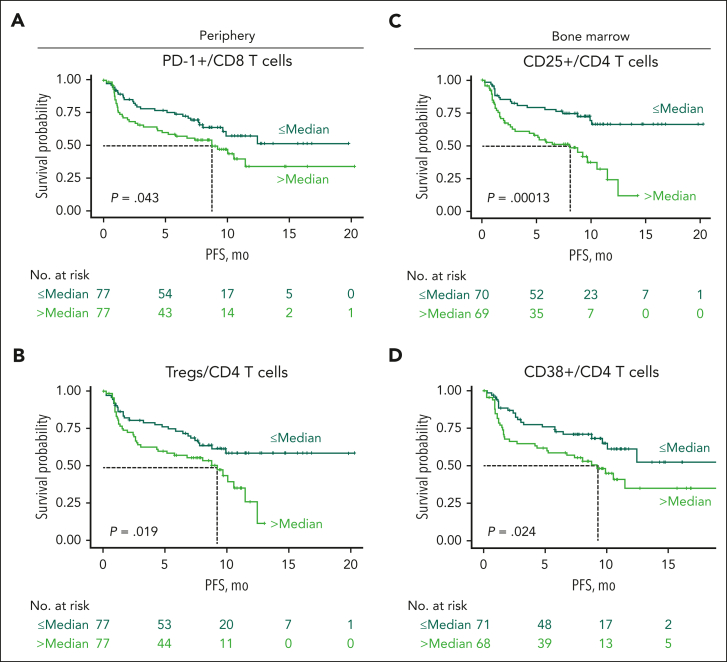
Teclistamab, an off-the-shelf B-cell maturation antigen (BCMA) × CD3 bispecific antibody that mediates T-cell activation and subsequent lysis of BCMA-expressing myeloma cells, is approved for the treatment of patients with relapsed/refractory multiple myeloma (R/RMM). As a T-cell redirection therapy, clinical outcomes with teclistamab may be influenced by patient immune fitness and tumor antigen expression. We correlated tumor characteristics and baseline immune profiles with clinical response and disease burden in patients with R/RMM from the pivotal phase 1/2 MajesTEC-1 study, focusing on patients treated with 1.5 mg/kg of teclistamab (N = 165). Peripheral blood samples were collected at screening, and bone marrow samples were collected at screening and cycle 3. Better clinical outcomes to teclistamab correlated with higher baseline total T-cell counts in the periphery. In addition, responders (partial response or better) had a lower proportion of immunosuppressive regulatory T cells (Tregs), T cells expressing coinhibitory receptors (CD38, PD-1, and PD-1/TIM-3), and soluble BCMA and a T-cell profile suggestive of a more cytolytic potential, compared with nonresponders. Neither frequency of baseline bone marrow BCMA expression nor BCMA-receptor density was associated with clinical response to teclistamab. Improved progression-free survival was observed in patients with a lower frequency of T cells expressing exhaustion markers and immunosuppressive Tregs. Overall, response to teclistamab was associated with baseline immune fitness; nonresponders had immune profiles suggestive of immune suppression and T-cell dysfunction. These findings illustrate the importance of the contribution of the immune landscape to T-cell redirection therapy response. This trial was registered at www.ClinicalTrials.gov as #NCT03145181/NCT04557098.


Conflict of interest statement

Conflict-of-interest disclosure: D.C.-S., D.V., S. Skerget, T.P., S. Stein, R.B., O.S.L., K.N., C.D., J.P., A.B., T.S., C.U., R.K., L.P., D.T., and S.X.W.L. are employees of Janssen and may have stock/other ownership interests in Janssen. L.S.W., J.G., and S.G. were employees of Janssen at the time the work was carried out and may have stock/other ownership interests in Janssen. R.I.V. was an employee of Janssen at the time the work was carried out and may have stock/other ownership interests in Janssen. P.M. has served in consulting/advisory roles and received honoraria from AbbVie, Amgen, Celgene, GlaxoSmithKline, Janssen, Oncopeptides, and Sanofi. S.Z.U. has served in a consulting or advisory role for AbbVie, Amgen, Bristol Myers Squibb/Celgene, Celgene, Genentech, Gilead Sciences, GlaxoSmithKline, Janssen, Karyopharm Therapeutics, Merck, and Takeda; and has received research funding from Amgen, Array BioPharma, Bristol Myers Squibb, Celgene, GlaxoSmithKline, Janssen, Merck, Pharmacyclics, Sanofi, Seattle Genetics, and Skyline Diagnostics. N.J.B. has served in consulting/advisory roles for Amgen, Celgene, Janssen, Karyopharm Therapeutics, Pfizer, Sanofi, and Takeda; received honoraria from AbbVie, Amgen, Celgene, Genentech/Roche, GlaxoSmithKline, Janssen, Karyopharm Therapeutics, Sanofi, and Takeda; and has received research funding from Celgene and Janssen. N.W.C.J.v.d.D. has served in consulting/advisory roles for AbbVie, Adaptive Biotechnologies, Amgen, Bayer, Bristol Myers Squibb, Celgene, Janssen, Novartis, Pfizer, Merck, Roche, Servier, and Takeda; and has received research funding from Amgen, BMS, Celgene, Cellectis, Janssen, and Novartis.

The current affiliation for R.I.V. is AbbVie Inc, North Chicago, IL.

Figures

None
Graphical abstract
Figure 1.
Figure 1.
Correlative immune factors of response to teclistamab monotherapy in the MajesTEC-1 study in the periphery at baseline. (A) Diagram of patients, samples, and analysis from the MajesTEC-1 study. (B) Frequency of T cells by response assessed by flow cytometry in the periphery at the RP2D dose, with representative staining shown on the right of the panel. (C) Absolute CD3 T-cell counts by flow cytometry relative to response. (D) Absolute CD8 T-cell counts assessed by flow cytometry (TBNK kit). (E) Percentage of Tregs from CD4 T cells at baseline relative to response at the RP2D dose, with representative staining shown on the right of the panel. (F) Frequency of CD38-expressing Tregs at baseline assessed by flow cytometry and relative to response, with representative staining shown on the right of the panel. (G) Frequency of naive CD8 T cells from the parent population of CD45+ T cells assessed in a subset of patients from the active dose cohorts assessed by CyTOF, with representative staining shown on the right of the panel. Statistical significance was evaluated using the Wilcoxon rank-sum test. CM, central memory; EM, effector memory; TBNK, T cells, B cells, and natural killer cells; TEMRA, terminally differentiated effector memory cells re-expressing CD45RA.
Figure 2.
Figure 2.
Higher proportions of granzyme B–producing and perforin-producing CD8 T cells, granzyme B–expressing CD4 non-Tregs, and naive CD4 T cells, as well as lower Treg proportion in the BM microenvironment at baseline were associated with lower response rates to teclistamab. (A) Frequency of CD8 T cells expressing granzyme B in a subset of 52 patients at the RP2D doses assessed at baseline by CyTOF. (B) Proportion of CD8 T cells expressing perforin relative to response assessed by CyTOF. (C) Percentage of CD4+CD27lowCD25hi Tregs in the BM microenvironment relative to response assessed at baseline by CyTOF. (D) Frequency of granzyme B–positive CD4 T cells (non-Tregs) assessed at baseline by CyTOF. (E) Proportion of the memory subset in the BM microenvironment at baseline assessed by CyTOF. Representative staining is shown on the right of each panel. Statistical significance was calculated using the Wilcoxon rank-sum test. CM, central memory; EM, effector memory; TEMRA, terminally differentiated effector memory cells re-expressing CD45RA.
Figure 3.
Figure 3.
Functional marker expression associated with exhaustion is higher in nonresponders in both the periphery and the BM microenvironments. (A) Staining of representative populations of interest (peripheral CD8, CD4, and CD3 T cells). (B) Frequency of PD-1+/CD8 T cells, CD38+/CD4 T cells, and PD-1+TIM-3+/CD3 T cells in the periphery at baseline in patients treated with the RP2D assessed by flow cytometry. (C) Frequency of PD-1+/CD8 T cells, CD38+/CD4 T cells, and PD-1+TIM-3+/CD3 T cells in the BM at baseline in patients treated with the RP2D assessed by flow cytometry. Groups were compared using the Wilcoxon rank-sum test.
Figure 4.
Figure 4.
Impact of BCMA expression and sBCMA on levels of response, and impact of high-risk disease characteristics (extramedullary plasmacytomas, revised ISS stage, tumor burden, and LDH levels) on serum sBCMA levels. (A) Frequency of BCMA+CD45lowCD38+CD138+ BMPCs relative to response in the RP2D cohort at baseline. (B) Density of BCMA expression in CD45lowCD38+CD138+ BMPCs depicted as log10 normalized values and relative to response assessed by flow cytometry. (C) sBCMA levels in serum at baseline from patients in the RP2D cohorts. (D) Quantification of sBCMA levels in serum associated with soft tissue extramedullary plasmacytoma. (E) Quantification of serum sBCMA levels relative to revised ISS staging (I, II, or III). (F) Quantification of serum sBCMA levels relative to tumor burden. (G) Quantification of serum sBCMA levels relative to baseline LDH level (low, normal, or high). Groups were compared using the Wilcoxon rank-sum test. Data for 1 patient with outlier values (sBCMA >1250 ng/mL) were included in the analyses but not included on the plots.
Figure 5.
Figure 5.
Immunophenotypic analyses of T cells at baseline and at cycle 3 day 1 after teclistamab monotherapy in BM correlate with disease burden status. (A-C) Frequency of PD-1, PD-1/TIM-3, and PD-1/CD38 expression in the CD8 T-cell subset relative to percentage of BMPCs at baseline from the RP2D cohort assessed by flow cytometry. (D-E) Frequency of CD4 T cells expressing CD25 or CD38 at baseline relative to disease burden assessed by the percentage of BMPCs. (F-G) Frequency of PD-1/TIM-3 and PD-1/CD38 expression in CD8 T cells relative to composite tumor burden. (H-I) Frequency of CD4 T cells coexpressing PD-1/TIM-3 or PD-1/CD38 assessed by flow cytometry relative to tumor burden at baseline. (J) Maximum fold change from baseline to cycle 3 day 1 of CD8 T cells coexpressing PD-1 and CD38 relative to low (BMPCs <60%) or high (BMPCs ≥60%) tumor burden. Representative staining is shown on the right of panels B-E,H,I. Statistical analyses were performed using the Wilcoxon rank-sum test for panels A-E,J or Kruskal-Wallis test for panels F-I.
Figure 6.
Figure 6.
Higher proportions of Tregs and expression of PD-1, CD25, and CD38 in T-cell subsets were associated with inferior PFS at baseline. (A-B) Kaplan-Meier curves of PFS for patients from the RP2D cohort according to proportion of baseline peripheral PD-1+ CD8 T cells (A) and Tregs (B) in the periphery. (C) Kaplan-Meier curves of PFS according to proportion of BM CD25-expressing CD4 T cells at baseline. (D) Kaplan-Meier curves of PFS according to proportion of BM CD38-expressing CD4 T cells at baseline. Dark green lines represent patients with proportions below the median, and light green lines represent patients with proportions equal to or higher than the median PFS in MajesTEC-1. Statistical significance was calculated using the Cox proportional hazards model.

Comment in

References

    1. Cowan AJ, Green DJ, Kwok M, et al. Diagnosis and management of multiple myeloma: a review. JAMA. 2022;327(5):464–477. - PubMed
    1. Bird SA, Boyd K. Multiple myeloma: an overview of management. Palliat Care Soc Pract. 2019;13 - PMC - PubMed
    1. Dimopoulos MA, Chen C, Spencer A, et al. Long-term follow-up on overall survival from the MM-009 and MM-010 phase III trials of lenalidomide plus dexamethasone in patients with relapsed or refractory multiple myeloma. Leukemia. 2009;23(11):2147–2152. - PubMed
    1. Orlowski RZ, Nagler A, Sonneveld P, et al. Randomized phase III study of pegylated liposomal doxorubicin plus bortezomib compared with bortezomib alone in relapsed or refractory multiple myeloma: combination therapy improves time to progression. J Clin Oncol. 2007;25(25):3892–3901. - PubMed
    1. Miguel JS, Weisel K, Moreau P, et al. Pomalidomide plus low-dose dexamethasone versus high-dose dexamethasone alone for patients with relapsed and refractory multiple myeloma (MM-003): a randomised, open-label, phase 3 trial. Lancet Oncol. 2013;14(11):1055–1066. - PubMed

Publication types

Substances

Associated data