. 2024 Aug 1;23(8):1109-1123.
doi: 10.1158/1535-7163.MCT-23-0641.

Enhancing Standard of Care Chemotherapy Efficacy Using DNA-Dependent Protein Kinase (DNA-PK) Inhibition in Preclinical Models of Ewing Sarcoma

Affiliations

Enhancing Standard of Care Chemotherapy Efficacy Using DNA-Dependent Protein Kinase (DNA-PK) Inhibition in Preclinical Models of Ewing Sarcoma

Victor J Collins et al. Mol Cancer Ther. .

Abstract

Disruption of DNA damage repair via impaired homologous recombination is characteristic of Ewing sarcoma (EWS) cells. We hypothesize that this disruption results in increased reliance on nonhomologous end joining to repair DNA damage. In this study, we investigated if pharmacologic inhibition of the enzyme responsible for nonhomologous end joining, the DNA-PK holoenzyme, alters the response of EWS cells to genotoxic standard of care chemotherapy. We used analyses of cell viability and proliferation to investigate the effects of clinical DNA-PK inhibitors (DNA-PKi) in combination with six therapeutic or experimental agents for EWS. We performed calculations of synergy using the Loewe additivity model. Immunoblotting evaluated treatment effects on DNA-PK, DNA damage, and apoptosis. Flow cytometric analyses evaluated effects on cell cycle and fate. We used orthotopic xenograft models to interrogate tolerability, drug mechanism, and efficacy in vivo. DNA-PKi demonstrated on-target activity, reducing phosphorylated DNA-PK levels in EWS cells. DNA-PKi sensitized EWS cell lines to agents that function as topoisomerase 2 (TOP2) poisons and enhanced the DNA damage induced by TOP2 poisons. Nanomolar concentrations of single-agent TOP2 poisons induced G2M arrest and little apoptotic response while adding DNA-PKi-mediated apoptosis. In vivo, the combination of AZD7648 and etoposide had limited tolerability but resulted in enhanced DNA damage, apoptosis, and EWS tumor shrinkage. The combination of DNA-PKi with standard of care TOP2 poisons in EWS models is synergistic, enhances DNA damage and cell death, and may form the basis of a promising future therapeutic strategy for EWS.


Conflict of interest statement

Conflict of Interest Statement: The authors declare no potential conflicts of interest.

Figures

Figure 1.
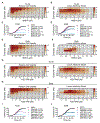
Figure 1.. A screen of multiple drug combinations shows that DNA-PK inhibition selective synergizes with etoposide in Ewing sarcoma cell lines.
(A) Heatmap representation of the relative cell viability of TC-32 cells treated with increasing concentrations of M3814 and etoposide for 72 hours. Each data point indicates the mean of four replicates. (B) Heatmap representation of the synergy scores derived from the results shown in A calculated using the Loewe additivity model; scores ≥10 indicate synergism. (C) TC-32 cell confluency (IncuCyte) following treatment with etoposide, M3814, or etoposide and M3814 at the indicated concentrations. Each data point indicates the mean and SEM of three replicates. (D) EW8 cell confluency (IncuCyte) following treatment with etoposide, M3814, or etoposide and M3814 at the indicated concentrations. Each data point indicates the mean and SEM of five replicates. (E) Heatmap representation of the relative cell viability of TC-32 cells treated with increasing concentrations of M3814 and etoposide for 72 hours. Each data point indicates the mean of four replicates. (F) Heatmap representation of the synergy scores derived from the results shown in (A) calculated using the Loewe additivity model; scores ≥10 indicate synergism. (G) Heatmap representation of the relative cell viability of TC-32 cells treated with increasing concentrations of AZD-7648 and etoposide for 72 hours. Each data point indicates the mean of four replicates and the synergy scores derived from these results calculated using the Loewe additivity model; scores ≥10 indicate synergism. (H) Heatmap representation of the relative cell viability of EW8 cells treated with increasing concentrations of AZD-7648 and etoposide for 72 hours. Each data point indicates the mean of four replicates and the synergy scores derived from these results calculated using the Loewe additivity model; scores ≥10 indicate synergism. (I) TC-32 cell confluency (IncuCyte) following treatment with etoposide, AZD-7648, or etoposide and AZD-7648 at the indicated concentrations. Error bars represent SEM. Each data point indicates the mean of three replicates. (J) EW8 cell confluency (IncuCyte) following treatment with etoposide, AZD-7648, or etoposide and AZD-7648 at the indicated concentrations. Each data point indicates the mean and SEM of six replicates.
Figure 2.
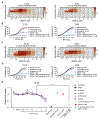
Figure 2.. The DNA-PK inhibitor M3814 enhances the activity of topoisomerase poisons in Ewing sarcoma.
(A) Heatmap representation of the synergy scores derived from the combination of doxorubicin and M3814 in TC-32 and EW8 cells (72 hours). Each data point indicates the mean of four replicates. (B) TC-32 and EW8 cell confluency (IncuCyte) following treatment with doxorubicin, M3814, or doxorubicin and M3814 at the indicated concentrations. Each data point indicates the mean and SEM of four (TC-32) or five (EW8) replicates. (C) Heatmap representation of the synergy scores derived from the combination of teniposide and M3814 in TC-32 and EW8 cells (72 hours). Each data point indicates the mean of four replicates. (D) TC-32 and EW8 cell confluency (IncuCyte) following treatment with teniposide, M3814, or teniposide and M3814 at the indicated concentration. Each data point indicates the mean ± SEM of five replicates. (E) The relative viability of TC32 cells in the presence of silenced TOP2A and/or TOP2B and increasing concentrations of M3814. Also shown is the siRNA transfection control (siCellDeath) and, for comparison, results for the single agent and drug combinations. Each data point shows the mean ± SEM of three replicates.
Figure 3.
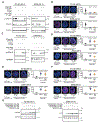
Figure 3.. DNA-PK inhibitors exhibit on-target activity in combination with etoposide and enhances DNA damage in Ewing sarcoma cells.
(A) Immunoblot analysis of whole-cell lysates prepared from TC-32 or EW8 cells treated with DMSO (−), etoposide, M3814, AZD-7648, or the etoposide/M3814 or etoposide/AZD-7648 combinations at the indicated concentrations for 24 hours and probed using the indicated antibodies. (B) Super-resolution merged images of representative nuclei (DAPI = blue) from TC-32 and EW8 cells treated with either DMSO or the indicated drug combinations for 48 hours and immunostained for total DNA-PK (red). Quantification of the DNA-PK nuclear intensity (30 nuclei) is shown on the right. (C) Immunoblot analysis of whole-cell lysates prepared from TC-32 or EW8 cells treated with the indicated single agent drugs or combinations for 48 hours and probed using the indicated antibodies. (D) Super-resolution merged images of representative nuclei (DAPI = blue) from TC-32 and EW8 cells treated with either DMSO or the indicated drug combinations for 48 hours and immunostained for pH2AX (magenta). Quantification of pH2AX foci (30 nuclei) is shown on the right. (E) Super-resolution merged images of representative nuclei (DAPI = blue) from TC-32 and EW8 cells treated with either DMSO or the indicated drug combinations for 48 hours and immunostained for 53BP1 (Red). Quantification of 53BP1 foci (30 nuclei) is shown on the right. (F) Super-resolution merged images of representative nuclei (DAPI = blue) from TC-32 and EW8 cells treated with either DMSO or the indicated drug combinations for 48 hours and immunostained for Ku70/Ku80 (magenta). Quantification of Ku70/Ku80 nuclear protein intensity (30 nuclei) is shown on the right. (G) Immunoblot analysis of whole-cell lysates prepared from TC-32 or EW8 cells treated with the indicated single agent drugs or combinations for 72 hours and probed using the indicated antibodies. The images shown in B, D, E, and F are representative of 30 nuclei per experimental condition. Scale bars for images shown in B, D, E and F = 3 μm.
Figure 4.
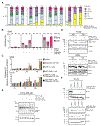
Figure 4.. The combination of Etoposide and DNA-PK inhibition induces cell cycle arrest and apoptosis.
(A) Flow cytometry analysis of PI stained EW8 cells following the indicated single or combination drug treatments for 24, 48, or 72 hours. (B) Summary of the flow cytometry analysis of PI and Annexin-V-FITC stained EW8 cells (Figure S7A) quantifying the percentage of cells in early or late apoptosis. (C) Assessment of caspase-3/7 activation following the treatment of EW8 or TC-32 cells with the indicated single agent drugs or combinations for 4, 24, or 48 hours. Data normalized to control DMSO values (mean ± SEM, n=5). * p<0.05; ** p<0.01, *** p<0.001 (D) Immunoblot using the indicated antibodies analyzing whole-cell lysates prepared from TC-32 or EW8 cells treated for 48 or 72 hours as indicated. (E) Immunoblot using the indicated antibodies analyzing whole-cell lysates prepared from CHLA-258 cells treated for 24 hours as indicated. (F) Immunoblot using the indicated antibodies analyzing whole-cell lysates prepared from TC-32 cells transfected with the indicated siRNA and treated for 48 hours with either DMSO (−) or etoposide (100 nM) and M3814 (1 μM) 6 hours post-transfection.
Figure 5:
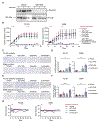
Figure 5:. Concomitant AZD-7648 and etoposide treatments impair tumor growth, induce DNA damage, and result in apoptotic cell death in in vivo models of EWS
(A) Immunoblot using the indicated antibodies analyzing whole-cell lysates prepared from EW8 xenografts obtained from mice treated with vehicle or AZD-7648 at 25 mg/kg twice daily. Each xenograft number represents tumor tissue obtained from a different mouse on day 3 of treatment. (B) Average tumor volumes of mice bearing EWS xenografts TC-32 (left panel) and EW8 (right panel) treated with vehicle (black), AZD-7648 at 25 mg/kg twice daily (BID) (magenta), etoposide at 10 mg/kg daily (teal), or AZD-7648 + etoposide (purple). The red arrows indicate the treatment schedules; days 1-5 and 20-24 for TC-32-bearing mice and days 1-5 and 18-22 for EW8-bearing mice. Error bars represent SEM. The results for individual tumors are shown in Supplementary Figs. S10A and S10B. (C) Representative histologic images of tumor tissue harvested on day 3 of treatment for TC-32 (left) and EW8 (right) xenografts using the drug doses detailed in B and stained for pH2AX (D) Quantification of pH2AX staining for TC-32 (left) and EW8 (right) xenografts treated as indicated using the drug doses detailed in B. *p<0.05; **p<0.01. (E) Representative histologic images of tumor tissue harvested on day 3 of treatment using the drug doses detailed in B and stained for cleaved caspase-3. (F) Quantification of cleaved caspase-3 staining for TC-32 (left) and EW8 (right) xenografts treated as indicated using the drug doses detailed in B. ****p<0.0001. (G) Average body weights of TC-32 (left panel) or EW8 (right panel) xenograft-bearing mice treated with vehicle (black), AZD-7648 at 25 mg/kg twice daily (BID) (magenta), etoposide at 10 mg/kg daily (teal), or AZD-7648 (25 mg/kg BID) + etoposide (10 mg/kg daily) (purple). The red arrows indicate the treatment schedules; days 1-5 and 20-24 for TC-32-bearing mice and days 1-5 and 18-22 for EW8-bearing mice. Error bars represent SEM. The results for individual tumors are shown in Supplementary Figs. S10C and S10D.

Similar articles

Cited by

References

    1. Grunewald TGP, Cidre-Aranaz F, Surdez D, Tomazou EM, de Alava E, Kovar H, et al. Ewing sarcoma. Nat Rev Dis Primers 2018;4(1):5 doi 10.1038/s41572-018-0003-x. - DOI - PubMed
    1. Setty BA, Gikandi A, DuBois SG. Ewing Sarcoma Drug Therapy: Current Standard of Care and Emerging Agents. Paediatr Drugs 2023;25(4):389–97 doi 10.1007/s40272-023-00568-9. - DOI - PubMed
    1. Esiashvili N, Goodman M, Marcus RB Jr. Changes in incidence and survival of Ewing sarcoma patients over the past 3 decades: Surveillance Epidemiology and End Results data. J Pediatr Hematol Oncol 2008;30(6):425–30 doi 10.1097/MPH.0b013e31816e22f3. - DOI - PubMed
    1. Fidler MM, Frobisher C, Guha J, Wong K, Kelly J, Winter DL, et al. Long-term adverse outcomes in survivors of childhood bone sarcoma: the British Childhood Cancer Survivor Study. Br J Cancer 2015;112(12):1857–65 doi 10.1038/bjc.2015.159. - DOI - PMC - PubMed
    1. Hamilton SN, Carlson R, Hasan H, Rassekh SR, Goddard K. Long-term Outcomes and Complications in Pediatric Ewing Sarcoma. Am J Clin Oncol 2017;40(4):423–8 doi 10.1097/COC.0000000000000176. - DOI - PubMed

Substances

LinkOut - more resources