. 2024 May 13;10(5):2911-2924.
doi: 10.1021/acsbiomaterials.3c01704. Epub 2024 Apr 24.

Modulating Lipid-Polymer Nanoparticles' Physicochemical Properties to Alter Macrophage Uptake

Affiliations

Modulating Lipid-Polymer Nanoparticles' Physicochemical Properties to Alter Macrophage Uptake

Elizabeth C Bender et al. ACS Biomater Sci Eng. .

Abstract

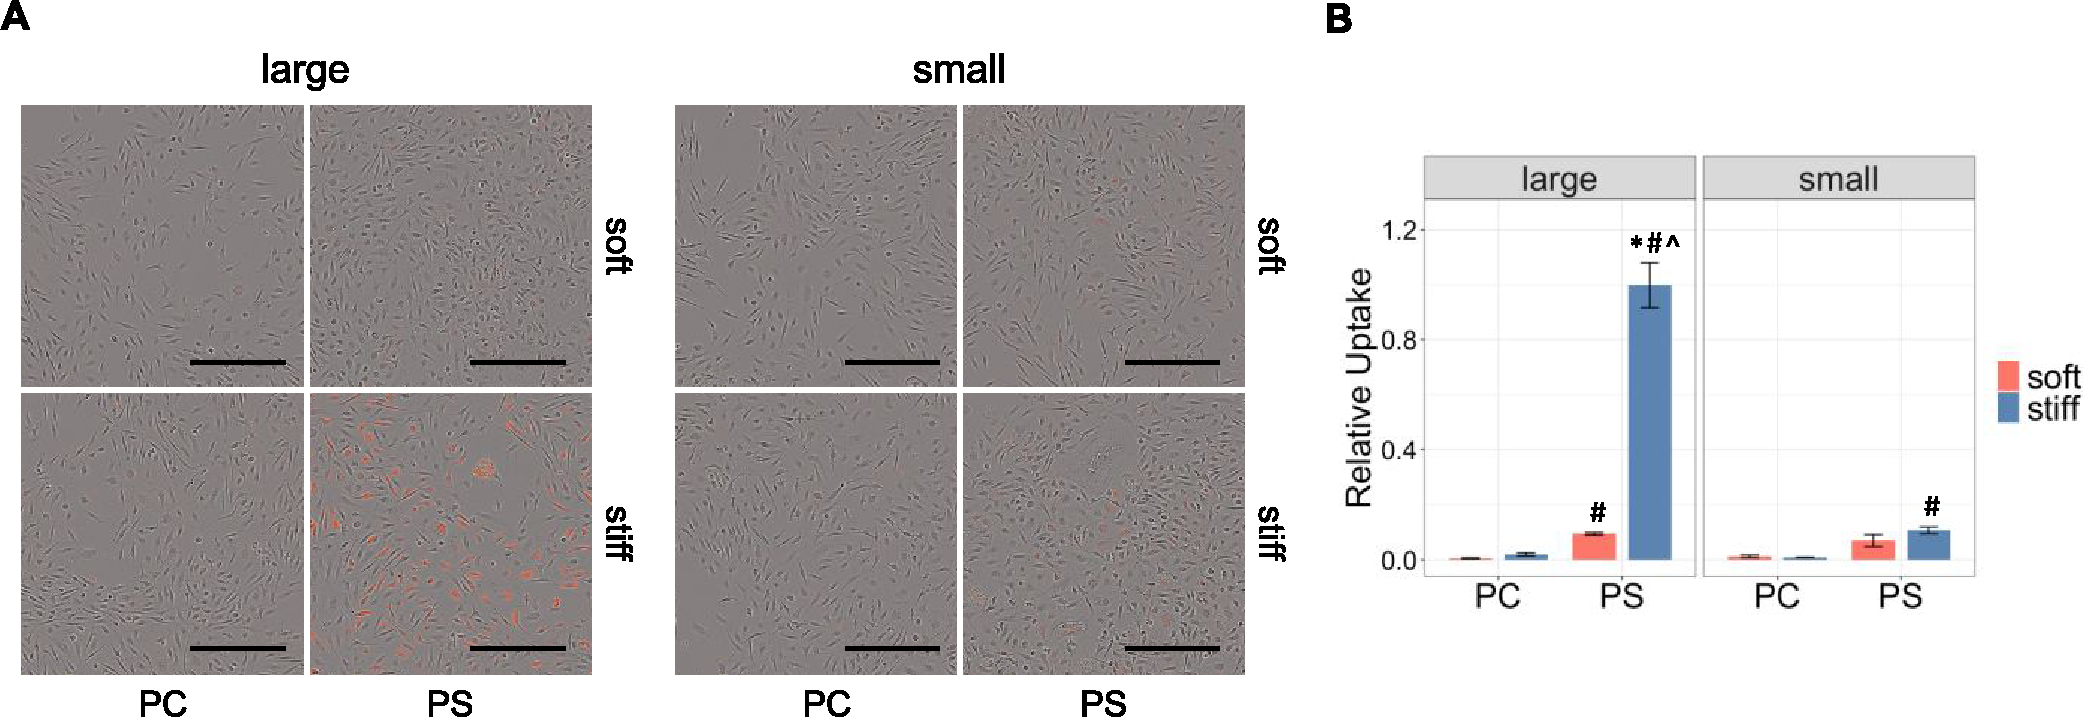
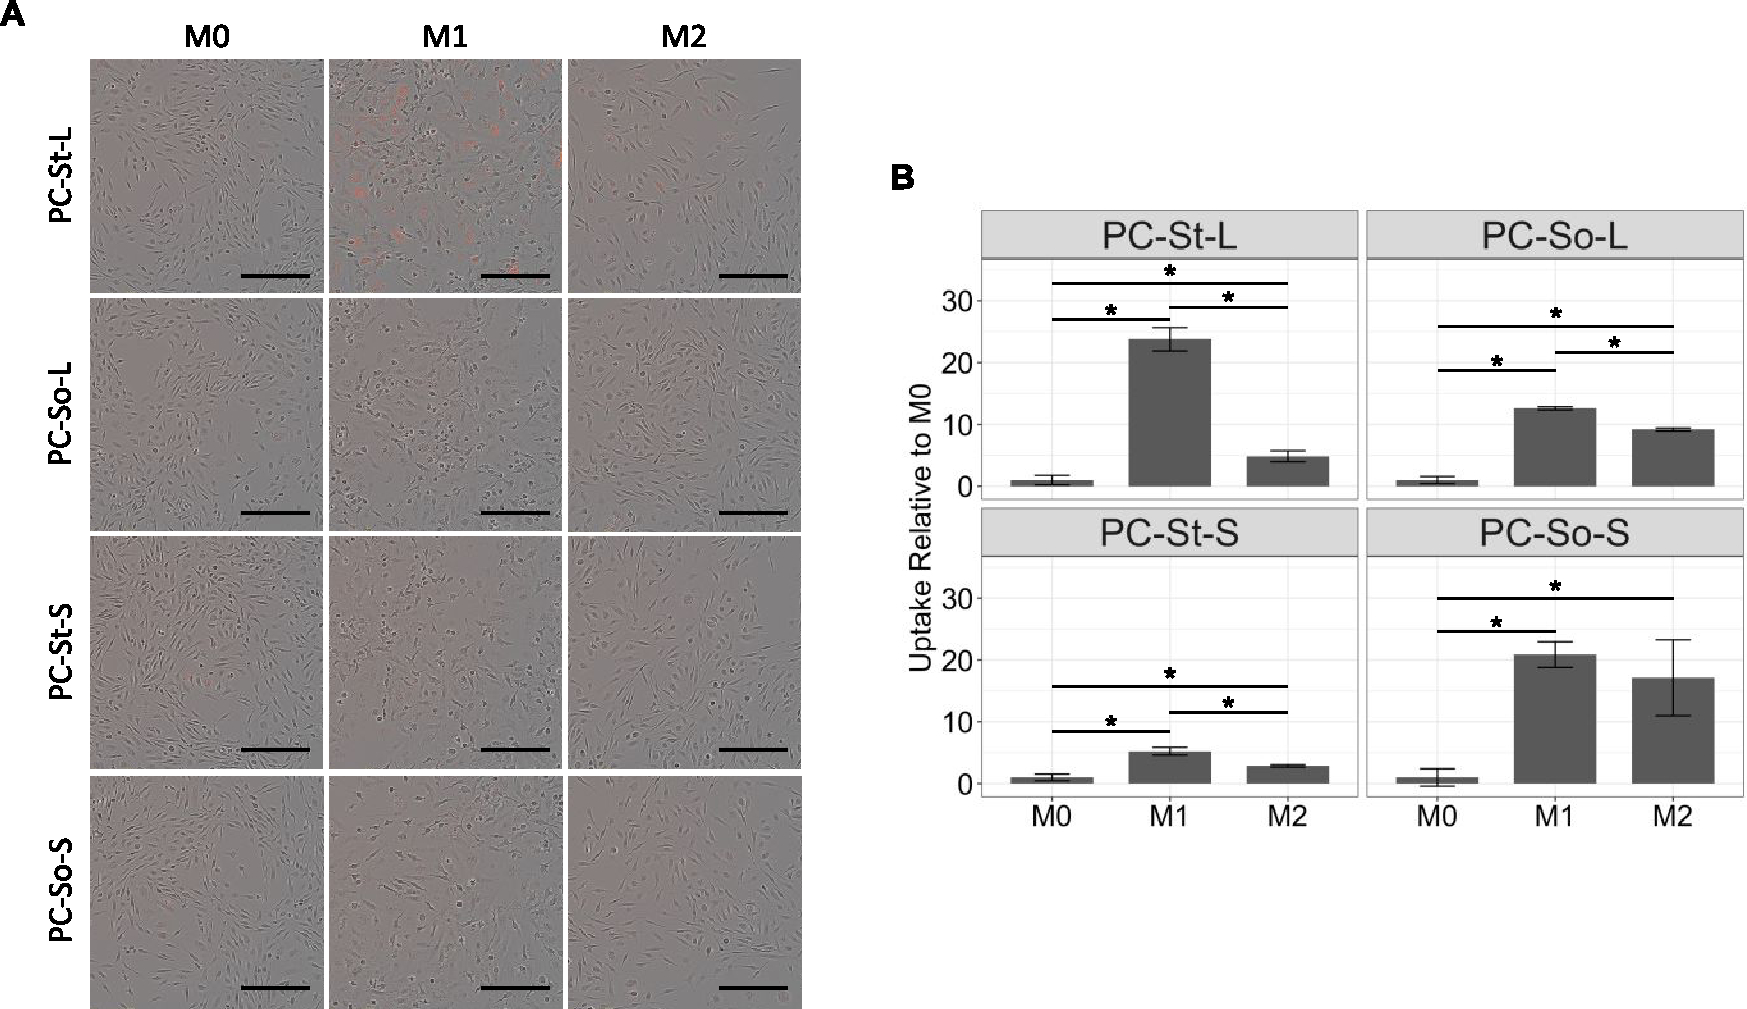
Macrophage uptake of nanoparticles is highly dependent on the physicochemical characteristics of those nanoparticles. Here, we have created a collection of lipid-polymer nanoparticles (LPNPs) varying in size, stiffness, and lipid makeup to determine the effects of these factors on uptake in murine bone marrow-derived macrophages. The LPNPs varied in diameter from 232 to 812 nm, in storage modulus from 21.2 to 287 kPa, and in phosphatidylserine content from 0 to 20%. Stiff, large nanoparticles with a coating containing phosphatidylserine were taken up by macrophages to a much higher degree than any other formulation (between 9.3× and 166× higher than other LPNPs). LPNPs with phosphatidylserine were taken up most by M2-polarized macrophages, while those without were taken up most by M1-polarized macrophages. Differences in total LPNP uptake were not dependent on endocytosis pathway(s) other than phagocytosis. This work acts as a basis for understanding how the interactions between nanoparticle physicochemical characteristics may act synergistically to facilitate particle uptake.

Keywords: endocytosis; lipid-polymer nanoparticle; macrophage; phosphatidylserine; size; stiffness.


Conflict of interest statement

The authors declare no competing financial interest.

Figures

Figure 1.
Figure 1.
Producing polymeric nanoparticle cores with a tunable stiffness. (A) Schematic of water-in-oil emulsion templating technique. An aqueous phase with various amounts of PEGDA is emulsified into an oil phase with a photoinitiator before being cross-linked under UV. Adjusting the amount of PEGDA in the aqueous phase allows for soft (10% PEGDA) or stiff (40% PEGDA) nanoparticles to be formed. (B) Macroscopic hydrogels of the same composition as soft and stiff nanoparticles show an increase in storage and loss moduli from 21.2 and 1.62 kPa for soft to 287 and 49.5 kPa for stiff (n = 6). (C) Nanoparticles with higher stiffness scatter light at a higher intensity across diameters using NTA. (*p < 0.01, t test).
Figure 2.
Figure 2.
Characterization of polymeric nanoparticle cores. (A) DLS Z-average shows that nanoparticle cores are separated into small and large fractions, with small differences in size between stiffnesses. (B) ζ-potentials are highly negative and consistent across all nanoparticle cores. (C) Representative TEM images confirm that nanoparticles in small and large fractions are different in size. Additional images can be found in Figure S1. Scale bar = 500 nm (n = 5, *p < 10−3, **p < 10−5, ***p < 10−12, two-way ANOVA).
Figure 3.
Figure 3.
Coating polymeric cores in liposomes. (A) Schematic of coating cores. SUVs are formed through thin film hydration and sonication. SUVs and polymeric cores are mixed and shaken together overnight to facilitate coating. (B–D) Representative data for coating stiff/large nanoparticles in SUVs with PS. (B) DLS Z-average size shows increase in size with coating. (C) ζ-Potential shifts from highly negative toward slightly positive value of SUV. (D) Representative TEM images of nanoparticle cores being coated in SUVs. Darker larger objects are the polymeric cores which are surrounded by the lightly stained SUVs. Scale bar = 200 nm (n = 5, *p < 0.05, one-way ANOVA).
Figure 4.
Figure 4.
Characterization of lipid-polymer nanoparticles. (A) Large LPNPs range in diameter from 543 to 812 nm while small LPNPs range in diameter from 232 to 462 nm. PC-St-L is the only large LPNP that is not significantly larger than its small counterpart. There are no significant differences in size within the large or small LPNP groups. (B) ζ-Potential measurements show that all LPNPs are close to neutral, ranging from −6.3 to +11.6 mV. (C) Representative TEM images show a multilamellar structure of lipid surrounding the polymer cores. Additional images can be found in Figures S3 and S4. Scale bar = 200 nm. (D) Thin-layer chromatographs stained with ninhydrin for PS and sulfuric acid for all unsaturated lipids show presence of lipids on all LPNPs (n = 5, p < 0.05, * compared to matched soft, ∧ compared to matched small, three-way ANOVA).
Figure 5.
Figure 5.
PS-St-L LPNP uptake was observed over time. (A) Representative images of BMDMs with no LPNPs (control) or PS-St-L LPNPs at 0, 4, 8, 12, and 24 h. Red fluorescence indicates uptake of LPNPs. Scale bar = 200 μm. (B) BMDM confluence over time relative to maximum confluence. Confluence of both control and PS-St-L decrease over time with 8, 12, and 24 h being significantly lower than 0 h. Treatment with PS-St-L LPNPs does not decrease confluence any faster than without. (C) Uptake relative to minimum uptake increases significantly for PS-St-L at 12 and 24 h compared to 0 h. Data is fitted with a Boltzmann sigmoid model (n = 3, p < 0.05, # compared to control at same time, ∧ compared to time = 0 h, two-way ANOVA).
Figure 6.
Figure 6.
LPNP uptake by BMDMs after 12 h. (A) Representative images of macrophages with LPNPs. Red fluorescence shows presence of LPNPs within the cells. Scale bar = 200 μm. (B) Fluorescence from images represented in (A) is quantified and normalized to total media fluorescence and maximum uptake. PS-St-L LPNPs are taken up significantly more than any other LPNPs. PS-So-L and PS-St-S LPNPs are also taken up more than their PC counterparts (PC-So-L and PC-St-S, respectively). PS alone is enough to impact uptake; however, stiffness and size play secondary roles in increasing that uptake (n = 3, p < 0.05, * compared to matched soft, ∧ compared to matched small, # compared to matched PC, three-way ANOVA).
Figure 7.
Figure 7.
PS LPNP uptake in polarized macrophages. (A) Representative images of macrophages polarized for 24 h with 50 ng/mL LPS (M1) or 20 ng/mL IL-4 (M2) then given PS LPNPs for 12 h. Scale bar = 200 μm. (B) Uptake relative to uptake in M0 for each LPNP. M2 BMDMs take up more LPNPs than M0 and M1 for all LPNPs tested (n = 3, *p < 0.05, one-way ANOVA).
Figure 8.
Figure 8.
PC LPNP uptake in polarized macrophages. (A) Representative images of macrophages polarized for 24 h with 50 ng/mL LPS (M1) or 20 ng/mL IL-4 (M2) then given PC LPNPs for 12 h. Scale bar = 200 μm. (B) Uptake relative to uptake in M0 for each LPNP. Polarized BMDMs take up more LPNPs than M0 for all PC LPNPs. M1 BMDMs take up more PC-St-L, PC-So-L, and PC-St-S than M2 (n = 3, *p < 0.05, one-way ANOVA).
Figure 9.
Figure 9.
Endocytosis inhibition at 12 h. (A) Representative images captured by Incucyte S3. Scale bar = 200 μm. (B) Uptake relative to no inhibitor for each PS LPNP. Treatment with cytoD, EIPA, and ES9–17 reduces uptake of all PS LPNPs below 100% (n = 6, *p < 0.05 compared to none, two-way ANOVA).
Figure 10.
Figure 10.
Endocytosis inhibition at 4 h. (A) Representative images captured by confocal microscope. Scale bar = 200 μm. (B) Integrated red fluorescence intensity relative to no inhibitor. Treatment with cytoD reduces uptake for all PS LPNPs while treatment with EIPA reduces uptake of PS-St-S and increases uptake of PS-So-S. ES9–17 has no effect (n = 10 technical replicates, p < 0.05 * reduced from none, + increased from none, one-way ANOVA).

Similar articles

References

    1. Couvreur P Nanoparticles in Drug Delivery: Past, Present and Future. Adv. Drug Delivery Rev. 2013, 65 (1), 21–23. - PubMed
    1. Large DE; Abdelmessih RG; Fink EA; Auguste DT Liposome Composition in Drug Delivery Design, Synthesis, Characterization, and Clinical Application. Adv. Drug Delivery Rev 2021, 176, No. 113851. - PubMed
    1. Yaghmur A; Mu H Recent Advances in Drug Delivery Applications of Cubosomes, Hexosomes, and Solid Lipid Nanoparticles. Acta Pharm. Sin. B 2021, 11 (4), 871–885. - PMC - PubMed
    1. Chandrakala V; Aruna V; Angajala G Review on Metal Nanoparticles as Nanocarriers: Current Challenges and Perspectives in Drug Delivery Systems. Emergent Mater. 2022, 5 (6), 1593–1615. - PMC - PubMed
    1. Gagliardi A; Giuliano E; Venkateswararao E; Fresta M; Bulotta S; Awasthi V; Cosco D Biodegradable Polymeric Nanoparticles for Drug Delivery to Solid Tumors. Front. Pharmacol. 2021, 12, No. 601626. - PMC - PubMed

Publication types

LinkOut - more resources