A method for automated masking and plantar pressure analysis using segmented computed tomography scans
- PMID: 38657477
- PMCID: PMC11127777
- DOI: 10.1016/j.gaitpost.2024.04.015
A method for automated masking and plantar pressure analysis using segmented computed tomography scans
Abstract
Background: Plantar pressure, a common gait and foot biomechanics measurement, is typically analyzed using proprietary commercial software packages. Regional plantar pressure analysis is often reported in terms of underlying bony geometry, and recent advances in image processing and accessibility have made computed tomography, radiographs, magnetic resonance imaging, or other imaging methods more popular for incorporating bone analyses in biomechanics.
Research question: Can a computed tomography-based regional mask provide comparable regional analysis to commercial plantar pressure software and can the increased flexibility of an in-house method obtain additional insight from common measurements?
Methods: A plantar pressure analysis method was developed based on bony geometry from computed tomography scans to calculate peak pressure, pressure time integral incorporating sub-peak values, force time integral, pressure gradient, and pressure gradient angle. Static and dynamic plantar pressure were acquired for 4 subjects (male, 65 ± 2.4 years). Plantar pressure variables were calculated using commercial and computed tomography-based systems.
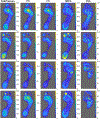
Results: Dynamic peak pressure, pressure time integral, and force-time integral computed using the bone-based software was 5 % (9kPa), 7 % (0.3kPa-s) and 13 % (0.3 N-s) different than the commercial software on average. Region masks of the metatarsals and toes differed between commercial and computed tomography-based software due to subject-specific bone geometry and toe shape. Pressure time integral values incorporating sub-peak pressure were higher and demonstrated higher relative hindfoot values compared to those without. Removing step-on frames to static pressure analysis decreased forefoot pressures. Regional maps of peak pressure and maximum pressure gradient demonstrate different peak locations.
Significance: Computed tomography-based regional masks are comparable to commercial masks. Inclusion of static step-on frames and sub-peak pressures may change regional plantar pressure patterns. Differences in location of maximum pressure gradient and peak pressure may be useful for assessing subject specific injury risk.
Keywords: Computed tomography; Image analysis; Plantar pressure; Pressure gradient.
Published by Elsevier B.V.
Conflict of interest statement
Declaration of Competing Interest The authors declare that they have no known competing financial interests or personal relationships that could have appeared to influence the work reported in this paper.
Figures


References
-
- Fernando M, Crowther R, Lazzarini P, Sangla K, Cunningham M, Buttner P, Golledge J, Biomechanical characteristics of peripheral diabetic neuropathy: A systematic review and meta-analysis of findings from the gait cycle, muscle activity and dynamic barefoot plantar pressure, Clin. Biomech 28 (2013) 831–845. 10.1016/j.clinbiomech.2013.08.004. - DOI - PubMed
MeSH terms
Grants and funding
LinkOut - more resources
Full Text Sources
Medical
Miscellaneous

