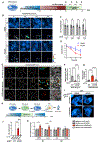
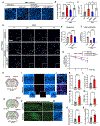
. 2024 Jun 4;36(6):1351-1370.e8.
doi: 10.1016/j.cmet.2024.03.014. Epub 2024 Apr 23.

Microglial lipid droplet accumulation in tauopathy brain is regulated by neuronal AMPK

Affiliations

Microglial lipid droplet accumulation in tauopathy brain is regulated by neuronal AMPK

Yajuan Li et al. Cell Metab. .

Abstract

The accumulation of lipid droplets (LDs) in aging and Alzheimer's disease brains is considered a pathological phenomenon with unresolved cellular and molecular mechanisms. Utilizing stimulated Raman scattering (SRS) microscopy, we observed significant in situ LD accumulation in microglia of tauopathy mouse brains. SRS imaging, combined with deuterium oxide (D2O) labeling, revealed heightened lipogenesis and impaired lipid turnover within LDs in tauopathy fly brains and human neurons derived from induced pluripotent stem cells (iPSCs). Transfer of unsaturated lipids from tauopathy iPSC neurons to microglia induced LD accumulation, oxidative stress, inflammation, and impaired phagocytosis. Neuronal AMP-activated protein kinase (AMPK) inhibits lipogenesis and promotes lipophagy in neurons, thereby reducing lipid flux to microglia. AMPK depletion in prodromal tauopathy mice increased LD accumulation, exacerbated pro-inflammatory microgliosis, and promoted neuropathology. Our findings provide direct evidence of native, aberrant LD accumulation in tauopathy brains and underscore the critical role of AMPK in regulating brain lipid homeostasis.

Keywords: AMPK; Alzheimer’s disease; Raman microscopy; SRS imaging; Tau; deuterium oxide; lipid droplets; lipophagy; microglia.


Conflict of interest statement

Declaration of interests The authors declare no competing interests.

Figures
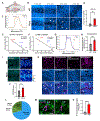
Figure 1.
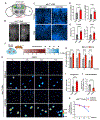
Figure 1.. Lipid droplets (LDs) accumulate in P301ShTau (PS19) mouse brains.
(A) A cartoon of mouse hippocampus highlighting CA1, CA3 and dentate gyrus (DG) areas as shown in (B). (B) SRS images showing endogenous lipid distribution in the hippocampus (CA1, CA3, DG) of wild-type (WT) or tauopathy mice (PS19) at 3 mo or 9 mo. Scale bar: 10 μm. Arrows point to typical LDs. (C) Raman spectra of LD proteins (black dotted line) and lipids (yellow solid line) collected by SRS hyperspectral imaging (SRS-HSI). WT mouse brain slices were treated with methanol to remove lipids (leaving with pure proteins), or proteinase K to remove proteins (leaving with pure lipids). The Raman peak at 2850 cm−1 corresponds to CH2 stretching bond of lipids. (D) Quantification of LD number per region of interest (ROI) in the hippocampus of WT and PS19 mice. n=7 mice per group. Each data point represents average LD count per ROI (127.28 x 127.28 μm2) from the hippocampus of one animal. 6-10 ROIs spanning CA1, CA3 and DG were selected for each section. Five sections (120 μm per section) per animal were imaged. (E, F) Pearson analysis showing a negative linear correlation between brain LD abundance and the thickness of CA1 pyramidal layer (E) and DG granule cellular layer (F) in PS19 mice of different ages. Grey dots: 3 mo (n=5); Blue dots: 6 mo (n=4); Red dots: 9 mo (n=4). (G) Raman spectra of LDs from WT (blue solid) and PS19 (red dotted) mouse brain collected by SRS-HSI showing unsaturated lipid peak at 3012 cm−1 and total lipid peak at 2850 cm−1. (H) Quantification of the ratio of unsaturated lipid (3012 cm−1/2850 cm−1) based on the Raman spectra in (G). n=5 mouse brains per group. (I) Two-photon fluorescent images showing optical redox ratio (FAD/NADH) in the hippocampus of PS19 and WT mice, quantified in (J). n=5 mouse brains per group. Scale bar: 10 μm. (K) Immunostaining co-registered with SRS imaging showing LD colocalization with glia- and neuron-specific makers CD68 (i), GFAP (ii), Olig2 (iii), and MAP2 (iv) in PS19 hippocampus. Scale bar: 10 μm. (L) Percentage distribution of LDs to different brain cell types in hippocampus region. (M) Immunostaining of pTau (AT8) and microglia (Iba1) co-registered with SRS imaging to show the spatial correlation between LD-bearing microglia and AT8 positive (AT8+) axons. Two different focal planes of the same 30 μm section were shown. Scale bar: 10 μm. (N) Quantification of LD-bearing microglia (SRS-LD+, Iba1+) localized within 30 μm of neuronal processes that are AT8+ or AT8−. n=30 ROIs per group. (D, H, J, N) Values are mean ± SEM. **, p < 0.01; ****, p < 0.0001 by Student’s t-test.
Figure 2.
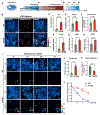
Figure 2.. LDs accumulate in human Tau (hTau) overexpressing Drosophila brains and have slower lipid turnover
(A) A cartoon depicts the structure of Drosophila adult brain. CB: central brain, OL: optical lobe. Neuropils (mainly mushroom bodies (MBs) and antenna lobes (ALs)) are surrounded by cortex regions, where LDs (yellow dots) are primarily localized. (B) Max Z-projected SRS images of hemibrain (red box in (A)) from hTau flies (elavC155-Gal4>UAS-hTau) and control flies (elavC155-Gal4>UAS-lacZ). Scale bar: 20 μm. (C) Zoomed-in SRS images showing LDs primarily localize to the cortex regions (red boxes in (B)) of control and hTau fly brains of both sexes. Scale bar: 10 μm. (D, E) Quantification of LD number (D) and size (E) in female and male brains of hTau flies compared to control flies. (F) A schematic of DO-SRS imaging paradigm to assess lipid metabolic dynamics in fly brains. Flies were fed with D2O food for 5 days, then transferred to a tube containing a H2O-moistened filter paper and subjected to starvation for 3 days. DO-SRS imaging was done at 0, 24, 48, and 72 h after media change. (G) DO-SRS images of CD/CH ratio at 0, 24, 48, and 72 h starvation in control and hTau fly brains. Scale bars: 10 μm in zoomed-out images, 5 μm in zoomed-in images. (H) Quantification of LD number in WT and hTau fly brains during starvation after D2O labeling. (I) Quantification of lipogenesis in brain LDs after D2O labeling by CD/CH ratio at 0 h. (J) Quantification of lipid mobilization (the decrease in CD/CH ratio) of brain LDs at 72 h starvation. (K) Change of CD/CH ratio within brain LDs at each time point during starvation, normalized to 0 h. (D, E, H, I, J, K) n=5 fly brains per group. (D, E, H, I, J) Values are mean ± SEM. (K) Values are mean ± SD. *, p < 0.05; **, p < 0.01; ***, p < 0.001; ****, p < 0.0001, by Student’s t-test.
Figure 3.
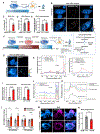
Figure 3.. V337M human iPSC-neurons accumulate LDs.
(A) A schematic of SRS and DO-SRS imaging timeline for assessing lipid metabolic dynamics in human iPSC-neurons. The neurons were cultured with 50% D2O neuronal media for 5 days, after which D2O media was replaced by H2O media (wash-off period). SRS imaging (B) was performed prior to D2O labeling. DO-SRS imaging (I) was performed after D2O labeling at 0, 24, 48 and 72 h. (B) LD accumulation and increased redox ratio (FAD/NADH) in V337M neurons were detected by SRS and two-photon imaging. Scale bar: 10 μm. (C-E) Quantification of LD number (C), redox ratio (D), and lipid unsaturation (E). n=10 ROIs from 3 independent experiments. (F-H) qRT-PCR showed a significant increase of mRNA levels of PLIN2, LPIN1 and GPAT1 in V337M iPSC-neurons, compared to WT iPSC-neurons. n=3 wells per group. (I) DO-SRS images of CD/CH ratio in WT and V337M iPSC-neurons collected at 0, 24, 48, and 72 h after changing to H2O medium followed by D2O labeling. Scale bar: 10 μm. (J) Quantification of lipogenesis (CD/CH ratio) of neuronal LDs after 5-day D2O labeling at 0 h. (K) Quantification of lipid mobilization (decrease of CD/CH ratio) in LDs at 72 h in H2O medium. (L) Change of CD/CH ratio within LDs at 0, 24, 48, and 72 h in H2O medium, normalized to CD/CH ratio at 0 h. (J-K) n=15 ROIs. (C-H, J, K) Values are mean ± SEM. (L) Values are mean ± SD.*, p < 0.05; ****, p < 0.0001 by Student’s t-test.
Figure 4.
Figure 4.. V337M iPSC-neurons transfer lipids to microglia and induce microglial LD accumulation, proinflammatory response and impaired phagocytosis
(A) A schematic of the media transfer experiment from iPSC-neurons to BV2 cells. Neuronal conditioned media (NCM) was collected from 5-week-old iPSC-neurons and transferred to BV2 cells to replace 50% of glial media. SRS imaging was performed on BV2 cells treated with WT-NCM or V337M-NCM for 24 h. (B) LDs and redox status of WT- and V337M-NCM treated BV2 detected by SRS imaging. Scale bar: 10 μm. (C-E) Quantification of BV2 LD number (C), redox ratio (D) and lipid unsaturation (E) in (B). n=10 ROIs from 3 independent experiments. (F) A schematic of the media transfer experiment combined with DO-SRS imaging. 5-week-old iPSC-neurons were cultured in 50% D2O neuronal media for 5 days, after that D2O media was replaced by H2O media for 72 h, allowing D2O-labeled lipids to be released from neurons. The resulting neuronal conditioned media (NCM72h) was transferred to BV2 cells to replace 50% of glial media. DO-SRS imaging was performed on BV2 cells treated with WT-NCM72h or V337M-NCM72h for 24 h. To characterize the lipids released from the iPSC-neurons into the media, the NCM was collected and subjected to lipid extraction following the steps in the flowchart. (G) DO-SRS imaging detected D2O-labeled lipids in V337M-NCM72h treated BV2 cells, but not WT-NCM72h treated BV2 cells. Scale bar: 10 μm. (H) The absolute Raman intensity measured from the extracted lipids derived from unlabeled (black dotted) and D2O-labeled (blue) WT-NCM, and unlabeled (grey dotted) and D2O-labeled (red) V337M-NCM. Besides the main lipid CH peak at 2850 cm−1, it shows a distinct Raman peak at 2140 cm−1 in the cell silence region of D2O-labeled V337M-NCM spectrum, representing newly synthesized D-labeled lipids released from V337M iPSC-neurons. (I) Quantification of total lipids and CD lipids from D2O-labeled WT- and V337M-NCM, based on area under the curve (AUC) of the 2850 cm−1 peak and 2140 cm−1 peak, respectively. (J) Raman spectra collected from LDs in D2O-labeled V337M iPSC-neurons (blue), LDs in BV2 cells treated with V337M-NCM (red), and the extracted lipids from V337M-NCM (green), normalized to the 2850 cm−1 peak. A consistent 2140 cm−1 peak in the cell silence regions and an identical whole spectral shape was observed, suggesting similar lipid composition from these three sources. (K) Raman spectra from the CH region of LDs from D2O-labeled V337M iPSC-neurons (blue), LDs from BV2 cells treated with V337M-NCM (red), and lipid extract from V337M-NCM (green), compared to the CH region of standard saturated lipids (dark grey) and unsaturated lipids (light grey). An identical whole spectral shape was observed in V337M iPSC-neuron derived lipid sources that closely matches the spectrum of standard unsaturated lipids. (L) qRT-PCR showed increased expression of M1 proinflammatory genes (TNFα and IL1α but not M2 anti-inflammatory genes (IL4 and TGFβ) in BV2 cells treated with V337M-NCM. n=7 wells from 3 independent experiments. (M) Phagocytosis activity measured by pHrodo fluorescent beads uptake in BV2 cells treated with WT-NCM and V337M-NCM. Scale bar: 10 μm. The averaged pHrodo fluorescent intensity per cell was quantified in (N). n=10 ROIs from 3 independent experiments. (G, J, K) Curves are averaged from n=4 biological repeats. (C-E, H, L, N) Values are mean ± SEM. *, p < 0.05; **, p < 0.01; ****, p < 0.0001, ns, not significant, by Student’s t-test.
Figure 5.
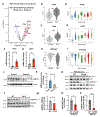
Figure 5.. Tauopathy brains exhibit increased gene expression of LD-associated proteins and impaired AMPK activity
(A) Volcano plot of significant DEGs from AMP-AD RNA-seq data of lipid metabolism pathways: GO:0006631 (fatty acid metabolic process), GO:0006638 (neutral lipid metabolic process), GO:0016127 (sterol catabolic process), GO:0010867 (positive regulation of triglyceride biosynthetic process), GO:0010868 (negative regulation of triglyceride biosynthetic process), and GO:0045923 (positive regulation of fatty acid metabolic process) between Braak stage 5-6 and Braak stage 0-2 patients in the parahippocampal gyrus (BM36). Colored points represent −log10 (Benjamini-Hochberg-adjusted p-value) ≥ 1.25 (dashed line), log2(Fold Change) > 0.25 upregulated genes (red) and log2 (Fold Change) < −0.25 downregulated genes (blue). Selected LD-associated genes are highlighted. (B, C) Violin plots from AMP-AD RNA-seq data showing upregulation of PLIN2 and LPIN1 gene expression in BM36 of AD brains. ***, p < 0.001, Benjamini-Hochberg-adjusted adjusted p-values obtained from the DE analysis. The black dot represents the mean expression value. (D, E) Violin plots showing PLIN2 and LPIN1 expression progressively increased as the Braak stages increased. PLIN2: p-value = 0.0001863, LPIN1: p-value = 5.426e−09, ANOVA controlling for ApoE dose, postmortem interval, and sex. (F, G) qRT-PCR showing increased mRNA levels of Plin3 and Lpin1 in the hippocampus of PS19 mice compared to WT littermates. n=5 per group. (H) Violin plot from AMP-AD RNA-seq data showing downregulation of PRKAA2 gene expression in BM36 of AD brains. ***, p < 0.001, Benjamini-Hochberg-adjusted p-values obtained from the DE analysis. (I) Violin plots showing PRKAA2 expression progressively decreased as Braak stages increased. p-value = 4.434e−06, ANOVA controlling for ApoE dose, postmortem interval, and sex. (J) Immunoblot showing a decrease of total AMPKα protein levels in Braak stage 6 compared to Braak stage 1 in postmortem human AD brain hippocampal tissues, quantified in (K). n=10 (Braak 1), 6 (Braak 6). (L) Immunoblot of pAMPKαT172, total AMPKα, and actin in the cortex lysates of 9 mo PS19 mice and WT littermates. (M) Quantification of pAMPKαT172 levels normalized to total AMPKα, in the cortex lysates of 9 mo PS19 mice compared to WT mice. n=8 (WT), 9 (PS19). (N) Immunoblot of pAMPKαT172, pACCS79, total AMPKα, total ACC and actin in WT and V337M iPSC-neuronal lysates. (O, P) Quantification of pACCS79 levels normalized to total ACC levels (O) and pAMPKαT172 normalized to total AMPKα (P), in neuronal lysates of V337M iPSC-neurons compared to WT iPSC-neurons. n=7 wells per group from three independent experiments. (F, G, K, M, O, P) Values are mean ± SEM. *, p < 0.05; **, p < 0.01, ***, p < 0.001 by Student’s t-test.
Figure 6.
Figure 6.. AMPK inhibits LD accumulation, promotes lipid turnover in neurons and decreases neuronal media-induced LD accumulation in microglia
(A) A schematic of DO-SRS imaging timeline in AICAR-treated V337M iPSC-neurons. 5-week-old iPSC-neurons were cultured in 50% D2O neuronal media for 5 days, followed by complete media change to H2O media containing AICAR (250 μM) for 3 days. (B) DO-SRS images showing CD/CH ratio in V337M iPSC-neurons at 0, 24, 48, and 72 h in H2O media with DMSO or AICAR treatment. Scale bar: 10 μm. (C, D) Quantification of LD number (C) and CD/CH ratio (D) in V337M iPSC-neurons with DMSO or AICAR treatment in H2O media. n=10 ROIs from 3 independent experiments. (E) Confocal images of WT and V337M iPSC-neurons expressing the mCherry-GFP-LC3 reporter, co-registered with SRS-lipids and DIC images. White arrows indicate yellow LC3 puncta-decorated LDs. Scale bar: 10 μm. (F) Quantification of red/yellow AV ratio (reflective of autophagic flux) in WT and V337M iPSC-neurons, treated with and without AICAR. n=15 ROIs from 3 independent experiments. (G) Quantification of autophagosome (APG)-docked LDs (yellow LC3 puncta-decorated LDs), in WT and V337M iPSC-neurons, treated with and without AICAR. n=15 ROIs from 3 independent experiments. (H) A schematic of the media transfer experiments between DMSO- or AICAR- pre-treated V337M iPSC-neurons and BV2 cells. V337M iPSC-neurons were pre-treated with AICAR for 3 days, washed for 3 times, then changed to fresh media without the drug. The 72-h neuronal conditioned medium (NCM72h) was transferred to replace 50% of BV2 media. SRS imaging was performed on BV2 cells treated with V337M-NCM72h for 24 h. (I) SRS imaging showing LD accumulation in BV2 treated with NCM72h collected from AICAR-pre-treated (pre-tx) WT and V337M iPSC-neurons, compared to DMSO-pre-treated NCM72h, quantified in (J). Scale bar: 10 μm. n =10 ROIs from 3 independent experiments. (K) qRT-PCR measuring mRNA levels of the representative genes in M1 pro-inflammatory (TNFα, IL1β) and M2 anti-inflammatory (IL4, TGFβ) pathway in BV2 cells treated with WT- or V337M-NCM72h pre-treated with and without AICAR. n=5 per group. (C, F, G, J, K) Values are mean ± SEM. (D) Values are mean ± SD. *, p < 0.05; **, p < 0.01; ****, p < 0.0001, ns, not significant, by Student’s t-test (C), or one-way ANOVA with Šídák multiple comparison test (F, G, J), or with Tukey multiple comparison test (K).
Figure 7.
Figure 7.. Neuronal AMPK negatively regulates LD accumulation in tauopathy fly and mouse brains
(A) Representative SRS images showing brain LDs from female WT flies (elavC155-Gal4>lacZ), hTau flies (elavC155-Gal4>hTau; lacZ), and hTau flies with neuronal overexpression of AMPK (elavC155-Gal4>hTau; AMPKWT, elavC155-Gal4>hTau; AMPKDN). Scale bar: 10 μm. (B, C) Quantification of LD numbers (B) and size (C) in (A). n=6-7 fly brains per group. (D) DO-SRS images of CD/CH ratio after 0, 24, 48, and 72 h starvation in female control and hTau fly brains with or without AMPKWT overexpression. Scale bar: 10 μm. (E-G) Quantification of lipogenesis by CD/CH ratio at 0 h (E), lipid mobilization by the decrease of CD/CH ratio within LDs at 72 h (F), and changes in CD/CH ratio at 0, 24, 48 and 72 h starvation, normalized to CD/CH ratio at 0 h (G). n = 5 fly brains per group. (H) A cartoon of a P301STau/prkaa1/2F/F mouse brain injected with AAV9-synapsin-Cre (AAV-Cre) and AAV9-lacZ (AAV-ctrl) to the left and right hemi-hippocampus (DG), respectively. (I) Immunostaining of cleaved Caspase1 (c-Caspase1) co-registered with SRS imaging of P301STau/prkaa1/2F/F mouse brain injected with AAV-Cre and AAV-ctrl to the left and right hemi-hippocampus (DG), respectively. The abundance of LDs and c-Caspase1 were both increased in AAV-Cre injected side compared to AAV-ctrl injected side, quantified in (K) and (L). n=4-6 mice. The insets in (I) showed that LDs were occasionally found in neurons from AAV-Cre injected side, where the level of c-Caspase1 was high. Scale bar: 10 μm. (J) Immunostaining of CD68 co-registered with SRS imaging showing an increase of LD-bearing CD68 positive (CD68+) microglia in AAV-Cre injected hemi-hippocampus of P301STau/prkaa1/2F/F mouse brain. The abundance of total CD68+ microglia and the percentage of LD-bearing CD68+ microglia among total CD68+ microglia were quantified in (M) and (N). n=5 mice. Scale bar: 10 μm. (O) A cartoon of a P301STau/prkaa1/2F/F mouse brain injected with Tau fibrils (K18/PL) on one side of the hippocampus (CA1) and either AAV-ctrl or AAV-Cre on the other side of the hippocampus (DG). Fibril-induced Tau spreading was measured on the AAV-injected hemi-hippocampus. (P) Immunostaining of MC1 in P301STau/prkaa1/2F/F mouse brain injected with Tau fibril and AAV-ctrl or AAV-Cre. More MC1+ cells were detected in AAV-Cre injected animals, quantified in (R). n=10 mice per group. (Q) SRS images showing an increase of LD number in the AAV-Cre injected hemi-hippocampus of P301STau/prkaa1/2F/F mice with fibril-induced Tau spreading, quantified in (S). n=10 mice per group. Scale bar: 10 μm. (B, C, E, F, K-N, R, S) Values are mean ± SEM. (G) Values are mean ± SD. *, p < 0.05; **, p < 0.01; ***, p < 0.001; ****, p < 0.0001; ns, not significant, by one-way ANOVA with Šídák multiple comparison test (B, C, E, F), or Student’s t-test (K-N, R, S).

References

    1. Chung KW (2021). Advances in Understanding of the Role of Lipid Metabolism in Aging. Cells 10. 10.3390/cells10040880. - DOI - PMC - PubMed
    1. Zadoorian A, Du X, and Yang H (2023). Lipid droplet biogenesis and functions in health and disease. Nat Rev Endocrinol 19, 443–459. 10.1038/s41574-023-00845-0. - DOI - PMC - PubMed
    1. Walther TC, and Farese RV Jr. (2012). Lipid droplets and cellular lipid metabolism. Annu Rev Biochem 81, 687–714. 10.1146/annurev-biochem-061009-102430. - DOI - PMC - PubMed
    1. Bailey AP, Koster G, Guillermier C, Hirst EM, MacRae JI, Lechene CP, Postle AD, and Gould AP (2015). Antioxidant Role for Lipid Droplets in a Stem Cell Niche of Drosophila. Cell 163, 340–353. 10.1016/j.cell.2015.09.020. - DOI - PMC - PubMed
    1. Danielli M, Perne L, Jarc Jovicic E, and Petan T (2023). Lipid droplets and polyunsaturated fatty acid trafficking: Balancing life and death. Front Cell Dev Biol 11, 1104725. 10.3389/fcell.2023.1104725. - DOI - PMC - PubMed

Substances

LinkOut - more resources