. 2024 Jun 19;44(25):e2128232024.
doi: 10.1523/JNEUROSCI.2128-23.2024.

C9ORF72 Deficiency Results in Neurodegeneration in the Zebrafish Retina

Affiliations

C9ORF72 Deficiency Results in Neurodegeneration in the Zebrafish Retina

Natalia Jaroszynska et al. J Neurosci. .

Abstract

Hexanucleotide repeat expansions within the gene C9ORF72 are the most common cause of the neurodegenerative diseases amyotrophic lateral sclerosis (ALS) and frontotemporal dementia (FTD). This disease-causing expansion leads to a reduction in C9ORF72 expression levels in patients, suggesting loss of C9ORF72 function could contribute to disease. To further understand the consequences of C9ORF72 deficiency in vivo, we generated a c9orf72 mutant zebrafish line. Analysis of the adult female spinal cords revealed no appreciable neurodegenerative pathology such as loss of motor neurons or increased levels of neuroinflammation. However, detailed examination of adult female c9orf72-/- retinas showed prominent neurodegenerative features, including a decrease in retinal thickness, gliosis, and an overall reduction in neurons of all subtypes. Analysis of rod and cone cells within the photoreceptor layer showed a disturbance in their outer segment structure and rhodopsin mislocalization from rod outer segments to their cell bodies and synaptic terminals. Thus, C9ORF72 may play a previously unappreciated role in retinal homeostasis and suggests C9ORF72 deficiency can induce tissue specific neuronal loss.

Keywords: ALS; C9ORF72; FTD; neurodegeneration; zebrafish.


Conflict of interest statement

The authors declare no competing financial interests.

Figures
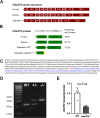
Figure 1.
Figure 1.
Characterization of the c9orf72 loss of function mutation. A, A comparison of exonic structure of human, mouse, and zebrafish c9orf72 gene, with the number of base pairs in each exon denoted in white script. The absence of human/mouse exon 3 from the zebrafish gene is indicated by a red asterisk (see Extended Data Fig. 1-1). B, C9orf72 amino acid (aa) sequence comparison/predicted protein domains of human, mouse, WT, and mutant zebrafish. The login domain of the WT zebrafish c9orf72 is shortened by 20 aa due to the absence of an exon which is present in humans/mice (exon 3). The mutant c9orf72 zebrafish DNA sequence contains a frameshift mutation in exon 2, generated through CRISPR/Cas9. This results in a premature stop codon upon translation within the login domain, deleting the majority of zebrafish c9orf72 protein. The amino acid sequence after frameshift and prior to the premature stop codon is highlighted in yellow. C, Exon 2 of c9orf72 illustrating the frameshift mutation generated through CRISPR/Cas9. The frameshift allele is composed of a 4 bp deletion (red script) and 90 bp insertion (blue script) within WT exon 2 (black script). D, Example genotyping gel demonstrating the large indel mutation visible by gel electrophoresis. E, The mutation leads to a large 66% reduction in c9orf72 transcript levels in the c9orf72−/− (p = 0.011; n = 4; Welch’s two-tailed t test), demonstrating activation of nonsense mediated decay by the frameshift allele, indicative of loss of function.
Figure 2.
Figure 2.
c9orf72 deficiency does not lead to MN loss or NMJ degeneration in adult zebrafish spinal cord. A, Schematic diagram of adult zebrafish, highlighting the spinal cord region used for analysis. B, Representative immunofluorescent image of ChAT staining in WT and c9orf72−/− spinal cord of 24-month-old zebrafish. Scale bar, 100 μm. C, Quantification of A. MN numbers were not significantly different between WT (2.92 ChAT+ MNs per section) and c9orf72−/−(3.37 ChAT+ MNs per section) zebrafish. Unpaired, two-tailed, and parametric t test, p = 0.38, n = 15 per genotype. SV2, presynaptic marker; BTX, postsynaptic marker labeling AChRs. Scale bar, 25 μm. D, Quantification of E. NMJ integrity was not altered in c9orf72−/− zebrafish. SV2+/BTX+: WTS, 44.19, c9orf72−/−, 50.32, p = 0.52; SV2+/BTX: WTS, 2.61, c9orf72−/−, 1.12, p = 0.47; SV2/BTX+: WTS, 1.08, c9orf72−/−, 1.06, p = 0.96. Multiple unpaired, two-tailed, and parametric t test, n-WTS:6, n- c9orf72−/−:4. E, Representative immunofluorescent image of NMJ staining in WT and c9orf72−/− muscle of 24-month-old zebrafish. Scale bar, 25 μm.
Figure 3.
Figure 3.
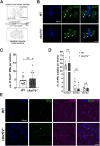
c9orf72−/− adult zebrafish do not exhibit micro- or astrogliosis in the spinal cord. A, Representative immunofluorescent image of 4c4+ microglia in WTS and c9orf72−/− spinal cord of 24-month-old zebrafish. Scale bar, 100 µm. B, Quantification of A. Microglial numbers per spinal cord section are unaltered between WTS (43.32 4c4+ microglia) and c9orf72−/− (41.85 4c4+ microglia). Unpaired, two-tailed, and parametric t test; p = 0.83; n-WTS: 13; n-c9orf72−/−, 14. See Extended Data Figures 3-1 and 3-2. C, Representative immunofluorescent image of Gfap staining in WTS and c9orf72−/− spinal cord of 24-month-old zebrafish. Scale bar, 100 µm. D, Quantification of C. Gfap+ area within spinal cord, normalized to spinal cord size, does not differ between WTS (20.34%) and c9orf72−/− (25.18%). Unpaired, two-tailed, and parametric t test; p = 0.18; n-WTS, 13; n-c9orf72−/−, 14.
Figure 4.
Figure 4.
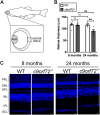
c9orf72−/− mutants exhibit signs of degeneration of inner retinal neurons. A, Schematic diagram of adult zebrafish retina, highlighting the central retinal region used for analysis. B, Quantification of mean retinal thickness of WTS and c9orf72−/− at 8 and 24 mpf, two-way ANOVA, Šídák’s multiple-comparisons test; 8 mpf WTS versus 8 mpf c9orf72−/−: p = 0.9905; 8 mpf WTS versus 24 mpf WTS p = 0.9988; 24 mpf WTS versus 24 mpf c9orf72−/−: p = 0.0062; 8 mpf c9orf72−/− versus 24 mpf c9orf72−/−: p = 0.0062. C, DAPI (blue) staining showing the nuclear layers of the WTS and c9orf72−/− retina at 8 and 24 mpf. In the innermost retina, retinal ganglion cell (RGC) somata make up the ganglion cell layer (GCL) and project processes into the inner plexiform layer, where they form synapses with bipolar and amacrine cells, the cell bodies of which are found in the inner nuclear layer (INL). Apical to the INL is the outer plexiform layer (OPL), where bipolar cells and horizontal cells connect to the photoreceptors in the outer nuclear layer (ONL). In the outermost retina, the inner and outer segments of rod and cone photoreceptors make up the photoreceptor layer (PRL). Dotted line represents the approach to measure retinal thickness. n = 5–6 retinas per genotype. Scale bar, 50 µm. See also Extended Data Figures 4-1–4-4).
Figure 5.
Figure 5.
c9orf72−/− mutants exhibit signs of degeneration of inner retinal neurons. A, Antibody staining for bipolar cell marker (PKC-β, green), amacrine and retinal ganglion cells (HuC/D, magenta) and nuclei (DAPI, blue) in WTS and c9orf72−/− retinas at 8 mpf and (B) at 24 mpf. C, Quantification of number of HuC/D+ amacrine cells (ACs) in the inner nuclear layer (INL) per 100 µm × 100 µm ROI in WTS and c9orf72−/− mutants at 8 and 24 mpf; two-way ANOVA, Šídák’s multiple-comparisons test; 8 mpf WTS versus 8 mpf c9orf72−/−: p = 0.0120; 8 mpf WTS versus 24 mpf WTS p < 0.0001; 24 mpf WTS versus 24 mpf c9orf72−/−: p = 0.0034; 8 mpf c9orf72−/− versus 24 mpf c9orf72−/−: p < 0.0001. D, Quantification of number of HuC/D+ retinal ganglion cells (RGCs) in ganglion cell layer (GCL) per 100 µm × 100 µm ROI in WTS and c9orf72−/− mutants at 8 and 24 mpf; two-way ANOVA, Šídák’s multiple-comparisons test; 8 mpf WTS versus 8 mpf c9orf72−/−: p = 0.9502; 8 mpf WTS versus 24 mpf WTS p = 0.5792; 24 mpf WTS versus 24 mpf c9orf72−/−: p = 0.0120; 8 mpf c9orf72−/− versus 24 mpf c9orf72−/−: p = 0.0014. E, Quantification of number of PKC-β + bipolar cells (BPCs) in the inner nuclear layer (INL) per 100 µm × 100 µm ROI in WTS and c9orf72−/− mutants at 8 and 24 mpf; two-way ANOVA, Šídák’s multiple-comparisons test; 8 mpf WTS versus 8 mpf c9orf72−/−: p = 0.0008; 8 mpf WTS versus 24 mpf WTS p < 0.0001; 24 mpf WTS versus 24 mpf c9orf72−/−: p = 0.0095; 8 mpf c9orf72−/− versus 24 mpf c9orf72−/−: p < 0.0001. n = 5–6 retinas per genotype. Scale bars, 50 µm.
Figure 6.
Figure 6.
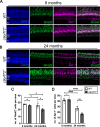
Cone photoreceptor degeneration in c9orf72−/− mutants. A, Immunostaining for pan-cone marker, Gnat2 (green) and double cone marker, Zpr-1 (magenta) in WTS and B c9orf72-deficient retinal cryosections. Nuclei labeled with DAPI (blue). C, Quantification of mean number of Gnat2-positive cone photoreceptors in WTS and c9orf72-deficient retinas at 8 and 24 mpf; 100 µm × 100 µm × 10 µm ROI; two-way ANOVA, Šídák’s multiple-comparisons test, 8 mpf WTS versus 8 mpf c9orf72−/− p = 0.06058, 8 mpf WTS versus 24 mpf WTS p = 0.7875; 8 mpf c9orf72−/− versus 24 mpf c9orf72−/− p = 0.0128; 24 mpf WTS versus 24 mpf c9orf72−/− p = 0.0104. D, Quantification of mean number of Zpr-1-positive cone photoreceptors in WTS and c9orf72-deficient retinas at 8 and 24 mpf; 100 µm × 100 µm × 10 µm ROI; two-way ANOVA, Šídák’s multiple-comparisons test, 8 mpf WTS versus 8 mpf c9orf72−/− p = 0.9537; 8 mpf WTS versus 24 mpf WTS p < 0.0001; 8 mpf c9orf72−/− versus 24 mpf c9orf72−/− p < 0.0001; 24 mpf WTS versus 24 mpf c9orf72−/− p = 0.0017; n = 5–6 fish per genotype. Scale bars, 50 µm.
Figure 7.
Figure 7.
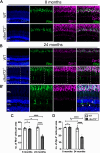
Rod photoreceptor degeneration in c9orf72−/− mutants. A, Antibody staining for rod photoreceptor marker rhodopsin (Rho, green) and rod and green-cone photoreceptor marker (Zpr-3, magenta) and nuclei (DAPI, blue in WTS and c9orf72−/− retinas at 8 mpf and B at 24 mpf. B’, Close up of c9orf72−/− retina from B with nuclei labeled with DAPI (blue). C, Quantification of mean number of Rho-positive rod photoreceptors in WTS and c9orf72-deficient retinas at 8 and 24 mpf; 100 mm × 100 µm × 10 mm ROI; two-way ANOVA; 8 mpf WTS versus 8 mpf c9orf72−/− p = 0.9525; 8 mpf WTS versus 24 mpf WTS p = 0.0233; 8 mpf c9orf72−/− versus 24 mpf c9orf72−/− p < 0.0001; 24 mpf WTS versus 24 mpf c9orf72−/− p < 0.0001. D, Quantification of mean number of Zpr-3-positive rod and green cone photoreceptors in WTS and c9orf72-deficient retinas at 8 and 24 mpf;100 mm × 100 µm × 10 mm ROI; two-way ANOVA; 8 mpf WTS versus 8 mpf c9orf72−/− p = 0.9970; 8 mpf WTS versus 24 mpf WTS p = 0.7859; 8 mpf c9orf72−/− versus 24 mpf c9orf72−/− p < 0.0001; 24 mpf WTS versus 24 mpf c9orf72−/− p < 0.0001. WTS; white arrowheads indicate displaced photoreceptors; phenotype observed in 0/5 WTS retinas and 5/6 c9orf72−/− retinas; n = 5–6 fish per genotype; PRL, photoreceptor layer; ONL, outer nuclear layer; OPL, outer plexiform layer; INL, inner nuclear layer. Scale bar, 10 µm.
Figure 8.
Figure 8.
Gliosis phenotypes in c9orf72−/− deficient retinas. A, Immunostaining for gliosis marker, Gfap (green) in WTS and c9orf72-deficient retinal cryosections at 8 and 24 mpf. Nuclei labeled with DAPI (blue). B, Quantification of the mean ratio of apicobasal Gfap distribution across the retina; two-way ANOVA, Šidâk’s multiple-comparisons test; 8 mpf WTS versus 8 mpf c9orf72−/− p = 0.5129; 8 mpf WTS versus 24 mpf WTS p = 0.9772; 8 mpf c9orf72−/− versus 24 mpf c9orf72−/− p = 0.0013, 24 mpf WTS versus 24 mpf c9orf72−/− p = 0.0003. See also Extended Data Figure 8-1. C, Antibody labeling of retinal microglia with 4c4 (magenta), cell bodies labeled with DAPI (blue). D, Quantification of the average number of 4c4+ microglia per image; two-way ANOVA, Šidâk’s multiple-comparisons test; 8 mpf WTS versus 8 mpf c9orf72−/− p = 0.3989, 8 mpf WTS versus 24 mpf WTS p = 0.7408, 8 mpf c9orf72−/− versus 24 mpf c9orf72−/− p = 0.4462, 24 mpf WTS versus 24 mpf c9orf72−/− p = 0.6282. See also Extended Data Figure 8-2. E, Quantification of the proportion of 4c4+ microglia observed in the ganglion cell layer (GCL), inner plexiform layer (IPL), inner nuclear layer (INL), and the outer nuclear layer (ONL) at 24 mpf; two-way ANOVA, Šidâk’s multiple-comparisons test; GCL, p = 0.5932; IPL, p = 0.9466; INL, p = 0.5932; ONL, p = 0.0008. n = 5, WTS retinas; n = 6, c9orf72−/− retinas. Scale bar, 10 µm.

References

    1. Altman T, et al. (2021) Axonal TDP-43 condensates drive neuromuscular junction disruption through inhibition of local synthesis of nuclear encoded mitochondrial proteins. Nat Commun 12:6914. 10.1038/s41467-021-27221-8 - DOI - PMC - PubMed
    1. Andrade C, et al. (2016) Spectral-domain optical coherence tomography as a potential biomarker in Huntington’s disease. Mov Disord 31:377–383. 10.1002/mds.26486 - DOI - PubMed
    1. Bailey JNC, et al. (2016) Genome-wide association analysis identifies TXNRD2, ATXN2 and FOXC1 as susceptibility loci for primary open-angle glaucoma. Nat Genet 48:189–194. 10.1038/ng.3482 - DOI - PMC - PubMed
    1. Balendra R, Isaacs AM (2018) C9orf72-mediated ALS and FTD: multiple pathways to disease. Nat Rev Neurol. 10.1038/s41582-018-0047-2 - DOI - PMC - PubMed
    1. Bashford JA, et al. (2020) The rise and fall of fasciculations in amyotrophic lateral sclerosis. Brain Commun 2:fcaa018. 10.1093/braincomms/fcaa018 - DOI - PMC - PubMed

MeSH terms

LinkOut - more resources