. 2024 Apr 24;15(1):3451.
doi: 10.1038/s41467-024-47391-5.

Emergence of enhancers at late DNA replicating regions

Affiliations

Emergence of enhancers at late DNA replicating regions

Paola Cornejo-Páramo et al. Nat Commun. .

Abstract

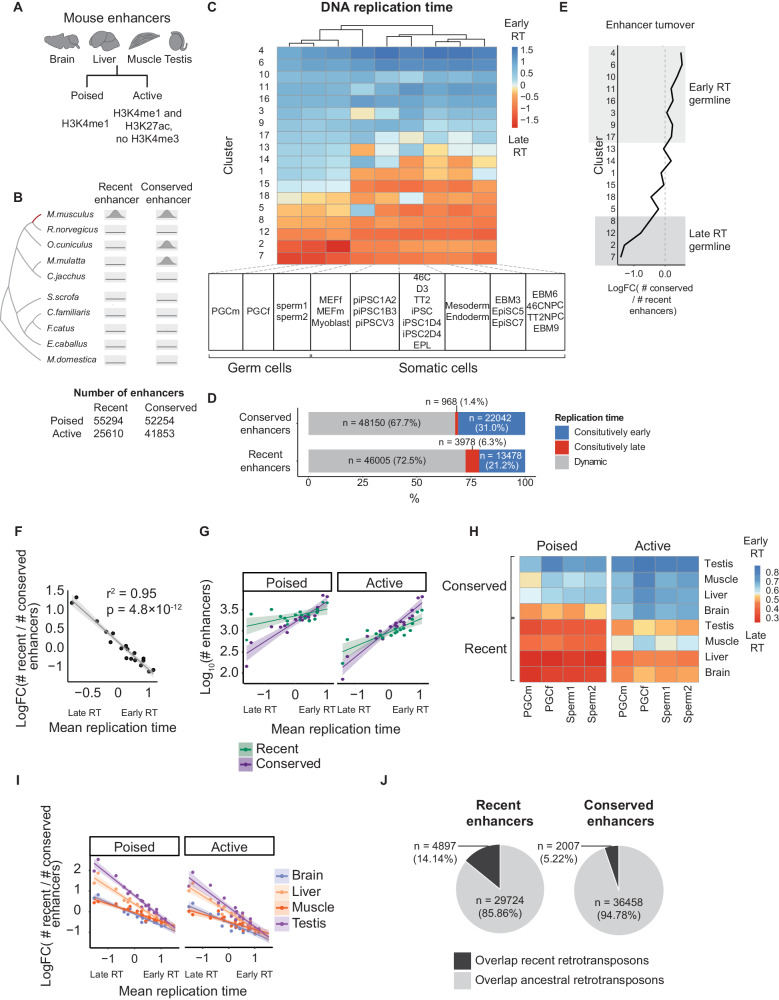
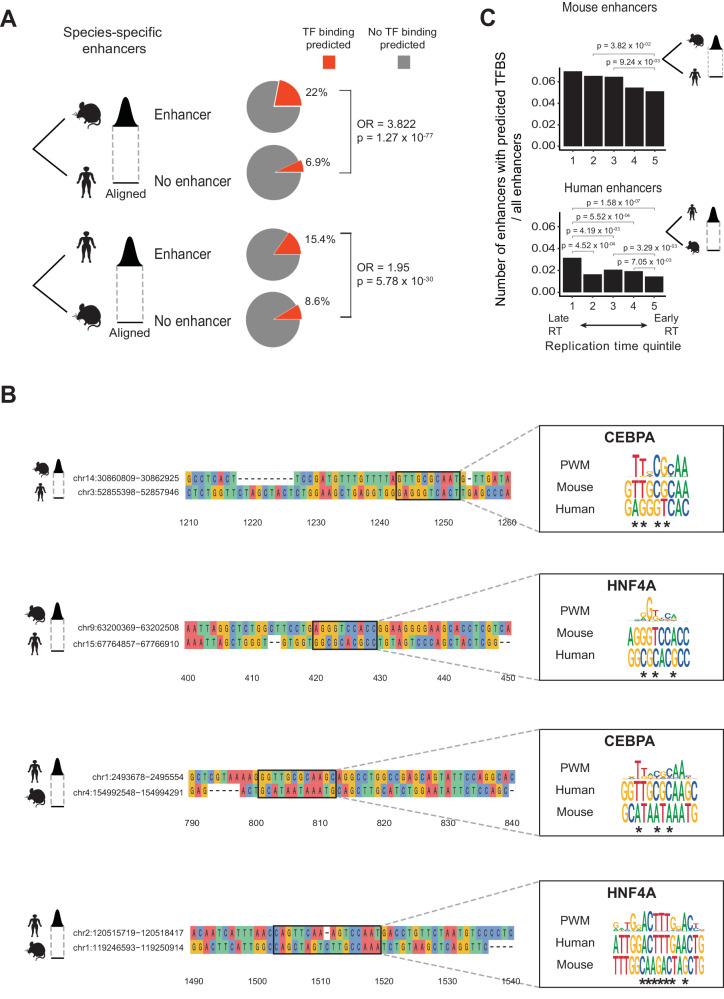
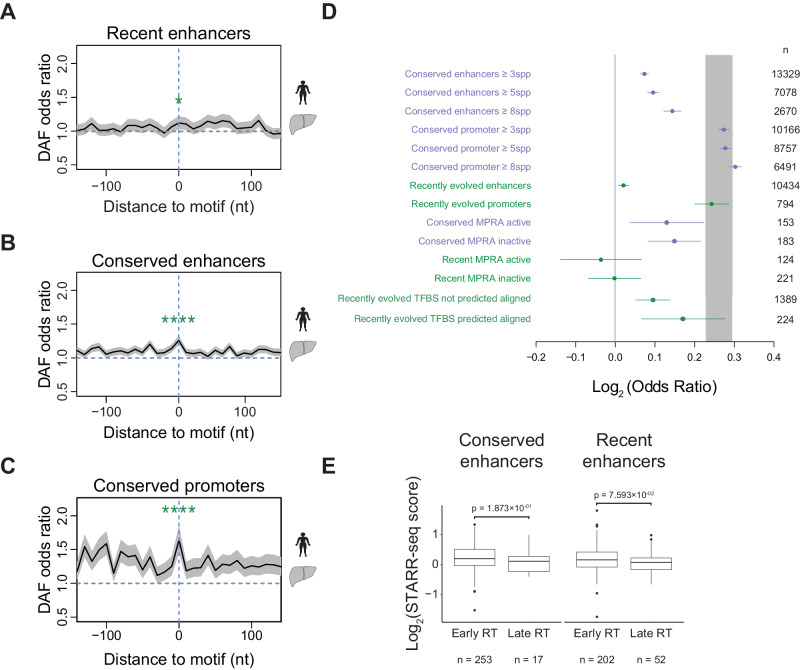
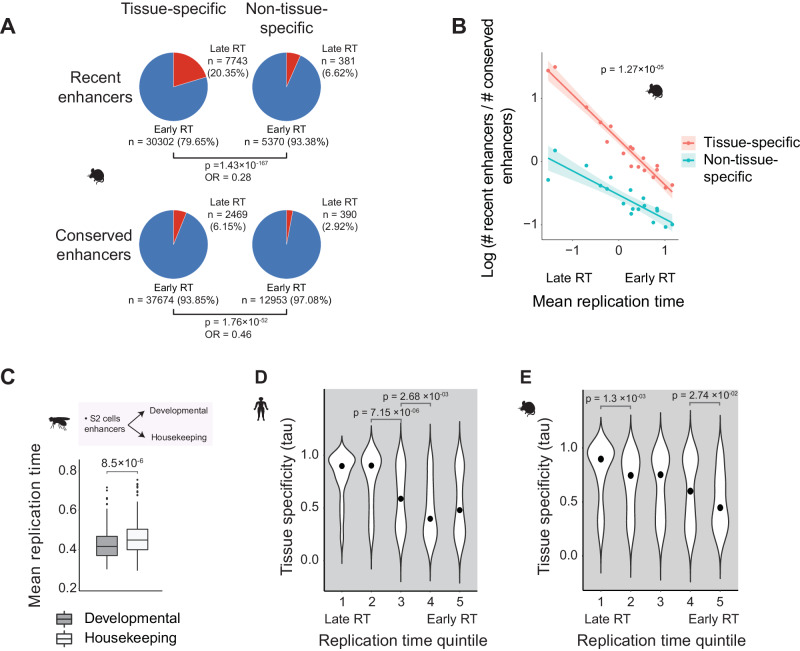
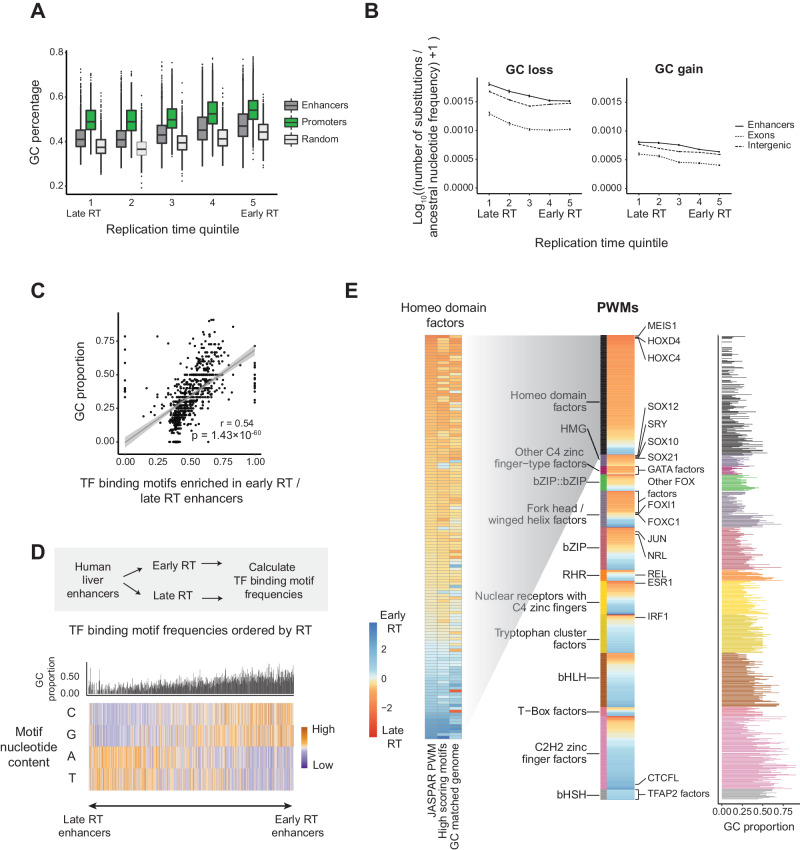
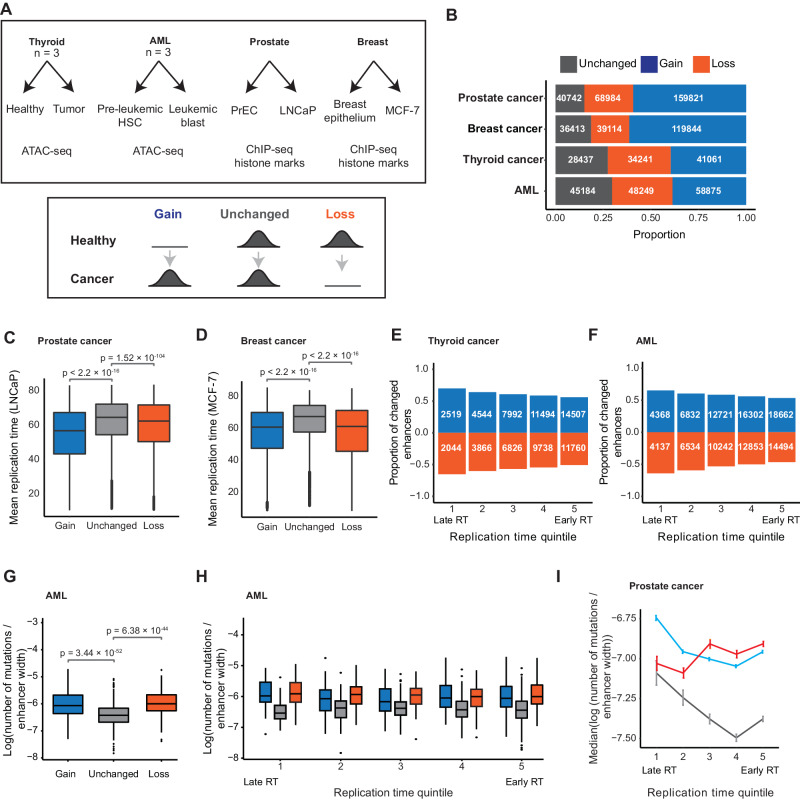
Enhancers are fast-evolving genomic sequences that control spatiotemporal gene expression patterns. By examining enhancer turnover across mammalian species and in multiple tissue types, we uncover a relationship between the emergence of enhancers and genome organization as a function of germline DNA replication time. While enhancers are most abundant in euchromatic regions, enhancers emerge almost twice as often in late compared to early germline replicating regions, independent of transposable elements. Using a deep learning sequence model, we demonstrate that new enhancers are enriched for mutations that alter transcription factor (TF) binding. Recently evolved enhancers appear to be mostly neutrally evolving and enriched in eQTLs. They also show more tissue specificity than conserved enhancers, and the TFs that bind to these elements, as inferred by binding sequences, also show increased tissue-specific gene expression. We find a similar relationship with DNA replication time in cancer, suggesting that these observations may be time-invariant principles of genome evolution. Our work underscores that genome organization has a profound impact in shaping mammalian gene regulation.


Conflict of interest statement

The authors declare no competing interests.

Figures

Fig. 1
Fig. 1. Enhancer turnover is coupled to germline replication timing.
A Mouse enhancers are defined based on combinations of histone marks. B Definition of mouse recent and conserved enhancers. Recent enhancers are defined as regions with mouse-specific histone marks enrichment. Conserved enhancers are aligned to regions with regulatory activity in at least two other species. C Replication time across 200 kb blocks of the mouse genome (n = 8966 blocks) in PGC (n = 2 cell lines), SSC cells (n = 2 cell lines), and early somatic cell types (n = 22 cell lines). Row clustering (blocks) was carried out with k-means clustering; columns are cell-type clusters generated with hierarchical clustering. Row clusters were ordered from early (top) to late (bottom) DNA replication timing, across columns (cell-type clusters). D Numbers of recent and conserved enhancers in regions of (C) with constitutively early (blue), constitutively late (red), and dynamic (gray) replication time. E Enhancer turnover as the log fold change of conserved vs. recent enhancers for the 200 kb clusters across mean germline replication time calculated across PGC (n = 2) and SSP cell lines (n = 2). Shaded areas represent clusters with constitutive DNA replication time. F Scatterplot of mean germline replication time (PGC + SSP) across the 18 clusters shown in (C). P value from a two-sided test of the Pearson correlation coefficient. Shaded areas represent a 95% confidence interval (CI) of the best fits. G Scatterplot of germline mean DNA replication time (PGC + SSP) and log10-transformed numbers of recent and conserved enhancers. Each data point is a cluster defined in (C). The shaded region represents the 95% CI of the line of best fit. H Mean PGC and SSC DNA replication time of poised and active mouse enhancers separated by tissue and type. I Mean germline DNA replication time (PGC + SSP) versus enhancer turnover by tissue and enhancer type. Each data point corresponds to a cluster in (C). The shaded region is the 95% CI of the line of best fit. J The number of recent/conserved enhancers overlapping recent/ancestral retrotransposons (Fisher’s exact test, p < 2.2 × 10−16, two-sided, odds ratio = 2.99).
Fig. 2
Fig. 2. Deep-learning model links changes in TF binding sites with enhancer turnover.
A Deep-learning domain adaptive model trained with HNF4A and CEBPA binding sites in mouse and human genomes. Prediction on species-specific enhancers and their aligned non-enhancer sequences in the other species. The pie charts show the percentage of enhancers and matched non-enhancer regions with predicted HNF4A and CEBPA TFBSs with a probability threshold 0.9. Fisher’s exact test two-sided p values are shown for each enhancer vs non-enhancer comparison. B Examples of species-specific liver candidate enhancers and their sequence alignments to the other species where binding is not predicted in (A). Boxed alignment of a motif identified in the species possessing the enhancer (top sequence) and its alignment to the species without the enhancer (bottom sequence). The motif’s position-weighted matrix (PWM) logo is on the right. The logo is on the negative strand in the last example. * denotes changes to PWM in the orthologous sequence without peak; Details on the data processing of this figure is available in Supplemental Methods. C Numbers of mouse- and human-specific enhancers with predicted TFBSs divided by the total number of enhancers across replication time quintiles. The difference in enhancer proportions was tested using a one-sided Fisher’s exact test between all pairs of DNA replication time quintiles, testing for a higher proportion in the latest quintile (alternative = “greater”). P values are indicated for significant tests (p ≤ 0.05).
Fig. 3
Fig. 3. Enhancers do not show strong signatures of purifying selection.
Derived Allele Frequency (DAF) odds ratio for recently evolved (A) and conserved human liver enhancers (B) and conserved promoters (C) compared to background genomic regions as a measure of selection pressure. Promoters and enhancers were centered based on the location of liver-specific functional motifs. p = 0.01 and 4.34 × 10−12 for recent and conserved enhancers, and p = 8.58 × 10−16 for promoters (two-sided Fisher’s exact test, significance code *P ≤ 0.05 and ****P ≤ 0.0001). In (AC), the shaded areas represent a 95% confidence interval from sampling the data with replacement (Methods). D Log2-transformed odds ratio of DAF scores for conserved and recent enhancers and promoters. Conservation was defined using multiple thresholds (number of species). Active and inactive enhancers were separated using STARR-seq scores to measure enhancer activity in HepG2 cells (Methods). DAF Log ORs for recently evolved human enhancers aligned to the mouse genome where TFBS were detected or not detected using the deep-learning model trained for HNF4A and CEBPA in Fig. 2 are shown. The middle points represent the log2-transformed odds ratio values from a Fisher’s test comparing the proportion of rare and common variants against the genome. Error bars represent the 95% confidence intervals of Fisher’s exact test. Numbers of elements are shown on the right. E Log2 transformed STARR-seq activity of human liver recent and conserved enhancers separated into early (RT >0.5) and late (RT <−0.5) replicating. The quartiles in box plots represent the 25th, 50th (median), and 75th percentiles. The interquartile range (IQR) represents the difference between the 75th and 25th percentiles. The upper whiskers extend to the maximum value of data within 1.5 IQR above the 75th percentile. The lower whiskers extend to the minimum value in the data within 1.5 IQR below the 25th percentile. Outliers are values above the upper whiskers or below the lower whiskers. A two-sided Mann–Whitney U-test p value is shown in each case. The number of enhancers is indicated in each case.
Fig. 4
Fig. 4. Tissue-specific enhancers are enriched at late replicating regions.
A The proportions of early and late replicating enhancers for tissue-specific and non-tissue-specific mouse recent and conserved enhancers (defined with four tissues: brain, liver, muscle, testis) (Two-sided Fisher’s exact test, p, and odds ratio values are shown in each case). B Mean mouse germline DNA replication time versus enhancer turnover rate, defined as log (number of recent enhancers/number of conserved enhancers), for tissue-specific and non-tissue-specific enhancers (shown in red and blue, respectively) across the 18 DNA replication time clusters shown in Fig. 2C. R2 = 0.95 (two-sided Pearson correlation p value = 6.43 × 10−12) and 0.78 (two-sided Pearson correlation p value = 1.19 × 10−06) for tissue-specific and non-tissue-specific enhancers, respectively. ANCOVA p value for the difference in slope is shown. The shaded area represents a 95% confidence interval of the best fit. C Mean replication time of developmental and housekeeping fruit fly enhancers (one-sided Mann–Whitney U-test housekeeping versus developmental, alternative = “greater,” n = 200 enhancers each class). The quartiles represent the 25th, 50th (median), and 75th percentiles. The interquartile range (IQR) represents the difference between the 75th and 25th percentiles. The upper whiskers extend to the maximum value of data within 1.5 IQR above the 75th percentile, and the lower whiskers extend to the minimum value in the data within 1.5 IQR below the 25th percentile. Outliers are values above the upper whiskers or below the lower whiskers. D, E Violin plots of tissue-specific expression scores (tau values) of human and mouse TFs separated into five quintiles depending on their respective motif enrichments at early versus late replicating enhancers (one-sided Mann–Whitney U-test, pairwise comparison of later vs. earlier replicating quintile, alternative = “greater,” significance code: ‘ns’ P > 0.05, *P ≤ 0.05, **P ≤ 0.01, and ****P ≤ 0.0001). P values for the significant (p ≤ 0.05) comparisons of consecutive quintiles are shown. Across the panel, mouse germline replication times are calculated as the mean across PGC and SSC cells, and human replication times are from H9 cells.
Fig. 5
Fig. 5. AT-rich motifs are associated with developmental TFs and are overrepresented at late replication time in mammals.
A GC percentage of human liver enhancers and promoters and random genomic regions across replication time quintiles (random regions were sampled from the non-genic areas of the genome, excluding promoters and enhancers) (n = 28,175, 11,520, and 5000 enhancers, promoters, and genomic background, respectively). Difference in GC% across DNA replication time quintiles was significant for every type of sequence (Supplementary Table 3). Quartiles, whiskers, and outliers are defined in Fig. 3E. B Mean non-CpG substitutions at liver enhancers, exonic, and intergenic regions across H9 replication time quintiles. Substitutions calculated between humans and the inferred common ancestor of Homo and Pan. The number of substitutions was adjusted by their ancestral nucleotide frequency, and log10 transformed. Error bars represent standard error (the number of regions per quintile is shown in Supplementary Table 4). C Scatterplot of the proportion of GC for TF binding motifs based on enrichment at early versus late replicating human liver enhancers. Two-sided Pearson correlation coefficient and p value are shown. The shaded area represents the 95% confidence interval of the best fit. D The bar plot shows the GC proportion of each motif. Heatmap of the GC/AT nucleotide content of TF binding motifs ordered based on their relative enrichment at early versus late replicating human liver enhancers (n = 5538 each replication time). Each column shows a human TF binding motif from the JASPAR database). E Relative enrichment of TF binding motifs at early versus late replicating liver enhancers grouped by TF class (center heatmap). The GC content of the motifs is shown on the right. Bars are colored by TF Class. Only TF classes with more than ten TFs are shown. The heatmap on the left shows the relative enrichment of homeodomain factors in early versus late replicating enhancers using JASPAR human motifs (left column) and using only the highest scoring motifs (mid column) (Methods). The column on the right shows the relative enrichment of homeodomain factors in early versus late GC%-matched genome background.
Fig. 6
Fig. 6. Enhancer turnover is enriched at late replication time in cancer.
A Overview of the enhancer datasets in cancer and matched healthy tissues and cell lines (top). Gained, unchanged, and lost enhancers were defined in each cancer type (bottom). B Proportions of unchanged, gained, and lost enhancers in each cancer type. C, D Replication time of gains, unchanged enhancers, and losses in the prostate (C) and breast (D) cancer (two-sided Mann–Whitney U-test; p value is shown for each comparison). A similar trend exists in thyroid cancer and AML (Supplementary Fig. 18B, C). The quartiles represent the 25th, 50th (median), and 75th percentiles. The interquartile range (IQR) is the difference between the 75th and 25th percentiles. The upper whiskers extend to the maximum value of data within 1.5 IQR above the 75th percentile, and the lower whiskers extend to the minimum value in the data within 1.5 IQR below the 25th percentile. Outliers are values above the upper whiskers or below the lower whiskers. E, F Proportions of enhancer gains and losses in thyroid cancer (E) and AML (F) are relative to the number of unchanged enhancers across replication time quintiles. Proportions of losses were multiplied by (−1). G Log transformed the number of mutations normalized by enhancer width for AML gains, losses, and unchanged enhancers (two-sided Mann–Whitney U-test; p value is shown for each comparison). The boxplot quartiles and outliers were defined as in (C, D). H Log transformed the number of mutations normalized by enhancer width in AML across replication time quintiles (two-sided Mann–Whitney U-test). The boxplot quartiles and outlier values were defined as in (C, D). I Median log-transformed number of mutations normalized by enhancer width at prostate cancer gains, unchanged enhancers, and losses across replication time quintiles (error bars represent standard error). The numbers of enhancers and mutations in each cancer type are in Supplementary Table 2. Cell type-specific replication timing datasets are used (Methods). The numbers of enhancers in each group in panels C, D, GI are shown in Supplementary Table 5.

Similar articles

Cited by

References

    1. Blow MJ, et al. ChIP-Seq identification of weakly conserved heart enhancers. Nat. Genet. 2010;42:806–810. doi: 10.1038/ng.650. - DOI - PMC - PubMed
    1. Schmidt D, et al. Five-vertebrate ChIP-seq reveals the evolutionary dynamics of transcription factor binding. Science. 2010;328:1036–1040. doi: 10.1126/science.1186176. - DOI - PMC - PubMed
    1. Villar D, et al. Enhancer evolution across 20 mammalian species. Cell. 2015;160:554–566. doi: 10.1016/j.cell.2015.01.006. - DOI - PMC - PubMed
    1. Arnold CD, et al. Quantitative genome-wide enhancer activity maps for five Drosophila species show functional enhancer conservation and turnover during cis-regulatory evolution. Nat. Genet. 2014;46:685–692. doi: 10.1038/ng.3009. - DOI - PMC - PubMed
    1. Fueyo, R., Judd, J., Feschotte, C. & Wysocka, J. Roles of transposable elements in the regulation of mammalian transcription. Nat. Rev. Mol. Cell Biol. 23, 481–497 (2022). - PMC - PubMed

Publication types

Substances