. 2024 Apr 24;15(1):3444.
doi: 10.1038/s41467-024-47593-x.

F-actin architecture determines the conversion of chemical energy into mechanical work

Affiliations

F-actin architecture determines the conversion of chemical energy into mechanical work

Ryota Sakamoto et al. Nat Commun. .

Abstract

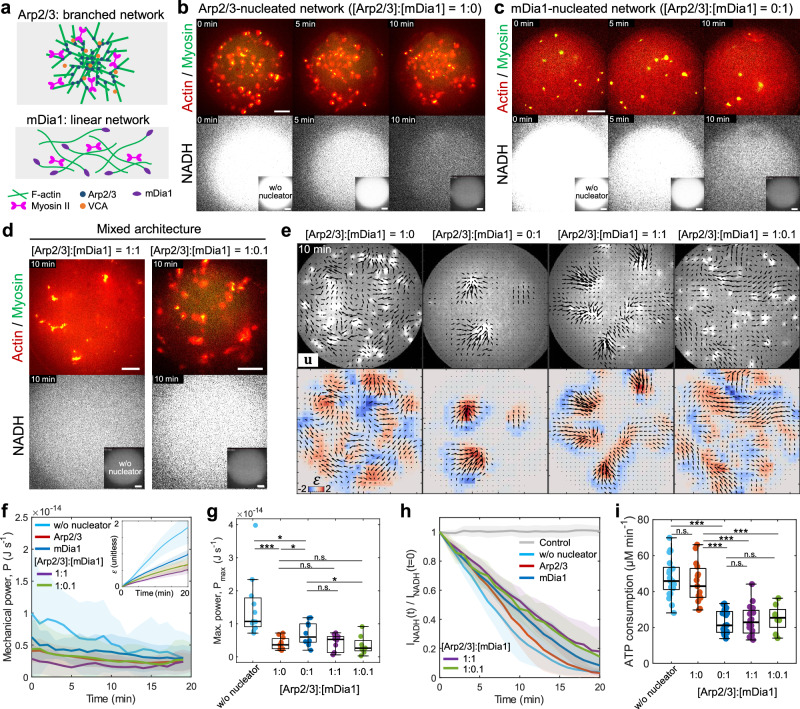
Mechanical work serves as the foundation for dynamic cellular processes, ranging from cell division to migration. A fundamental driver of cellular mechanical work is the actin cytoskeleton, composed of filamentous actin (F-actin) and myosin motors, where force generation relies on adenosine triphosphate (ATP) hydrolysis. F-actin architectures, whether bundled by crosslinkers or branched via nucleators, have emerged as pivotal regulators of myosin II force generation. However, it remains unclear how distinct F-actin architectures impact the conversion of chemical energy to mechanical work. Here, we employ in vitro reconstitution of distinct F-actin architectures with purified components to investigate their influence on myosin ATP hydrolysis (consumption). We find that F-actin bundles composed of mixed polarity F-actin hinder network contraction compared to non-crosslinked network and dramatically decelerate ATP consumption rates. Conversely, linear-nucleated networks allow network contraction despite reducing ATP consumption rates. Surprisingly, branched-nucleated networks facilitate high ATP consumption without significant network contraction, suggesting that the branched network dissipates energy without performing work. This study establishes a link between F-actin architecture and myosin energy consumption, elucidating the energetic principles underlying F-actin structure formation and the performance of mechanical work.


Conflict of interest statement

The authors declare no competing interests.

Figures

Fig. 1
Fig. 1. ATP consumption rate measurement using NADH-coupled assay and mechanical power estimation.
a Schematic of the free energy released upon ATP hydrolysis (ΔGATP) converted to the mechanical work performed by myosin on actin network contraction (Wmyo). Ediss is the dissipated energy not used for work. fmyo is the force generated by single motors. b Schematic of the NADH-coupled assay. c NADH fluorescence dependence on ADP concentration in the NADH-coupled assay. The initial NADH concentration is fixed at 460 µM (n = 466 droplets and N = 8 independent experiments). d Schematic showing actomyosin-encapsulated droplets coupled to the NADH assay. e, f Time-lapse images showing the contraction of actomyosin with myosin concentration at 12.5 nM (e) and 50 nM (f) (actin in red, myosin in green) and the NADH fluorescence (in white). g NADH fluorescence over time normalized by the initial time point (n = 7 and N = 4 in control only containing NADH; n = 11 and N = 3 for actin only; n = 8 and N = 3 for 12.5 nM; n = 7 and N = 3 for 25 nM; n = 9 and N = 3 for 50 nM). h Boxplot showing the ATP consumption rate in (g) (n = 11 and N = 3 for actin only; n = 12 and N = 4 for 12.5 nM; n = 10 and N = 4 for 25 nM; n = 10 and N = 4 for 50 nM). i ATPase activity calculated by the ATP consumption rate in (h) divided by the concentration of actin or myosin (n = 11 and N = 3 for actin only; n = 12 and N = 4 for 12.5 nM; n = 10 and N = 4 for 25 nM; n = 10 and N = 4 for 50 nM). j Actomyosin network contraction (left) with 50 nM myosin. Black arrows are the total displacement over 10 min and vector magnitudes are normalized by its maximum. Colormap represents local strain fields (right). k Mean compressive strain of the actin network over time (n = 6 and N = 3 for 12.5 nM; n = 5 and N = 3 for 25 nM; n = 10 and N = 9 for 50 nM). l Instantaneous power of the actin network over time (n = 6 and N = 3 for 12.5 nM; n = 5 and N = 3 for 25 nM; n = 12 and N = 10 for 50 nM). m Maximum instantaneous power performed by myosin extracted from (l) (n = 6 and N = 3 for 12.5 nM; n = 5 and N = 3 for 25 nM; n = 11 and N = 10 for 50 nM). n Scatter plot showing the maximum power dependence on ATP consumption rate (n = 6 and N = 3 for 12.5 nM; n = 5 and N = 3 for 25 nM; n = 11 and N = 10 for 50 nM). Individual data is shown as small markers. The dashed line is the linear fitting to the individual data. Data are presented as mean ± SD (c, g, k, l, n) or boxplots where the interquartile range (IQR) is between Q1 (25th percentile) and Q3 (75th percentile), the center line indicates the median, whiskers are extended to Q3  +  1.5 × IQR and Q1 − 1.5 × IQR (h, i, m); *p < 0.05; **p < 0.01; ***p < 0.001 in a two-sided Wilcoxon rank sum test. n.s., not significant. Scale bars, 10 µm. Source data are provided as a Source Data file.
Fig. 2
Fig. 2. Polarity of F-actin bundles controls mechanical power and ATP consumption rate.
a Schematic showing the unipolar bundles crosslinked by fascin (top) and mixed polar bundles crosslinked by fimbrin (bottom). b, c Time-lapse images showing the contraction of the actin network crosslinked by fascin (b, 1 µM) and fimbrin (c, 1 µM) (actin in red, myosin in green), and the NADH fluorescence (in white). d, e PIV analysis on actomyosin network contraction for fascin (d) and fimbrin-crosslinked network (e). Black vectors are the total displacement over 10 min and vector magnitudes are normalized by the maximum displacement (left). The colormap represents local strain fields (right). f Instantaneous power over time (n = 12 droplets and N = 10 independent experiments in without crosslinkers; n = 8 and N = 7 in fascin; n = 6 and N = 6 in fimbrin; n = 6 and N = 3 in α-actinin). Inset shows mean compressive strain over time. g Boxplot showing the maximum instantaneous power performed by myosin extracted from (f) (n = 12 droplets and N = 10 independent experiments in without crosslinkers; n = 8 and N = 7 in fascin; n = 7 and N = 7 in fimbrin; n = 8 and N = 4 in α-actinin). h NADH fluorescence over time normalized by the initial time point (n = 7 and N = 4 in control; n = 9 and N = 3 in without crosslinkers; n = 5 and N = 3 in fascin; n = 6 and N = 3 in fimbrin; n = 7 and N = 4 in α-actinin). i Boxplot showing the ATP consumption rate in (h) (n = 13 and N = 4 in without crosslinkers; n = 5 and N = 3 in fascin; n = 6 and N = 3 in fimbrin; n = 9 and N = 4 in α-actinin). Scale bars, 10 µm. Data are presented as mean ± SD (f, h) or boxplots where the interquartile range (IQR) is between Q1 (25th percentile) and Q3 (75th percentile), the center line indicates the median, whiskers are extended to Q3  +  1.5 × IQR and Q1 − 1.5 × IQR (g and i); **p < 0.01; ***p < 0.001 in a two-sided Wilcoxon rank sum test. n.s., not significant. Source data are provided as a Source Data file.
Fig. 3
Fig. 3. Branched and linear F-actin architecture alter mechanical power and ATP consumption rate.
a Schematic showing the Arp2/3-nucleated branched network (top) and the mDia1-nucleated linear network (bottom). b, c Time-lapse images showing the contraction of the actin network nucleated by the Arp2/3 complex (b, 300 nM Arp2/3) and mDia1 (c, 300 nM mDia1) (actin in red, myosin in green), and the NADH fluorescence (in white). d Snapshots showing the contraction of the mixed architecture nucleated by [Arp2/3]:[mDia1] = 1:1 (left) and [Arp2/3]:[mDia1] = 1:0.1 (right) and the NADH fluorescence (bottom) at 10 min. The total nucleator concentration is fixed at 300 nM. e Actomyosin network contraction (top) for different Arp2/3 to mDia1 ratio. Black vectors are the total displacement over 10 min and vector magnitudes are normalized by the maximum displacement. The colormap represents local strain fields (bottom). f Instantaneous power over time (n = 12 droplets and N = 11 independent experiments in without nucleators; n = 10 and N = 9 in Arp2/3 only; n = 9 and N = 7 in mDia1 only; n = 9 and N = 6 in [Arp2/3]:[mDia1] = 1:1; n = 8 and N = 4 in [Arp2/3]:[mDia1] = 1:0.1). Inset shows the mean compressive strain over time. g Boxplot showing the maximum instantaneous power performed by myosin extracted from (f) (n = 11 droplets and N = 10 independent experiments in without nucleators; n = 11 and N = 10 in Arp2/3 only; n = 10 and N = 8 in mDia1 only; n = 10 and N = 7 in [Arp2/3]:[mDia1] = 1:1; n = 8 and N = 4 in [Arp2/3]:[mDia1] = 1:0.1). h NADH fluorescence over time normalized by the initial time point (n = 12 and N = 6 in control; n = 17 and N = 7 in without nucleators; n = 15 and N = 9 for Arp2/3 only; n = 20 and N = 10 in mDia1 only; n = 16 and N = 8 in [Arp2/3]:[mDia1] = 1:1; n = 8 and N = 4 in [Arp2/3]:[mDia1] = 1:0.1). i Boxplot showing the ATP consumption rate in (h) (n = 12 and N = 6 in control; n = 21 and N = 9 in without nucleators; n = 15 and N = 9 for Arp2/3 only; n = 20 and N = 10 in mDia1 only; n = 16 and N = 8 in [Arp2/3]:[mDia1] = 1:1; n = 8 and N = 4 in [Arp2/3]:[mDia1] = 1:0.1). Scale bars, 10 µm. Data are presented as mean ± SD (f, h) or boxplots where the interquartile range (IQR) is between Q1 (25th percentile) and Q3 (75th percentile), the center line indicates the median, whiskers are extended to Q3  +  1.5 × IQR and Q1 − 1.5 × IQR (g, i); *p < 0.05; ***p < 0.001 in a two-sided Wilcoxon rank sum test. n.s., not significant. Source data are provided as a Source Data file.
Fig. 4
Fig. 4. F-actin architecture controls the ATP consumption rate of myosin II.
a The summary of the architectural regulation of ATP consumption. The mechanical work and ATP consumption rate of myosin II in crosslinked bundles are controlled by the polarity of the bundle structure. Unipolar bundles enable contraction while consuming a large amount of ATP, whereas mixed polarity bundles suppress both mechanical work and ATP consumption rates. On the other hand, the branched network dissipates mechanical work while allowing for high ATP consumption. In contrast, a linear actin network allows for contraction while slowing down ATP consumption. The dynamic steady-state maintained by gelsolin-based severing enhances ATP consumption rates. b Maximum instantaneous power dependence on ATP consumption rates (n = 11 droplets and N = 10 independent experiments in control (spontaneously polymerized non-crosslinked network at 50 nM myosin); n = 6 and N = 4 in control at 12.5 nM myosin; n = 6 and N = 3 in fascin; n = 5 and N = 3 in fimbrin; n = 6 and N = 3 in α-actinin; n = 6 and N = 3 in Arp2/3; n = 6 and N = 4 in mDia1; n = 9 and N = 6 in [Arp2/3]:[mDia1]=1:1 mixed network). The dashed line represents the fitting between control (filled circle) and control at 12.5 nM myosin (empty circle). The large points are mean ±SD. Individual data is shown as small points. c Schematic summarizing the F-actin architectural control of mechanical power and ATP consumption rate by myosin. Source data are provided as a Source Data file.

Similar articles

Cited by

References

    1. Shamipour S, et al. Bulk actin dynamics drive phase segregation in zebrafish oocytes. Cell. 2019;177:1463–1479. doi: 10.1016/j.cell.2019.04.030. - DOI - PubMed
    1. Ishihara K, et al. Topological morphogenesis of neuroepithelial organoids. Nat. Phys. 2023;19:177–183. - PMC - PubMed
    1. Ajeti V, et al. Wound healing coordinates actin architectures to regulate mechanical work. Nat. Phys. 2019;15:696–705. doi: 10.1038/s41567-019-0485-9. - DOI - PMC - PubMed
    1. Vicente-Manzanares M, Ma X, Adelstein RS, Horwitz AR. Non-muscle myosin II takes centre stage in cell adhesion and migration. Nat. Rev. Mol. Cell Biol. 2009;10:778–790. doi: 10.1038/nrm2786. - DOI - PMC - PubMed
    1. Lappalainen P, Kotila T, Jegou A, Romet-Lemonne G. Biochemical and mechanical regulation of actin dynamics. Nat. Rev. Mol. Cell Biol. 2022;23:836–852. doi: 10.1038/s41580-022-00508-4. - DOI - PubMed

Publication types