. 2024 Apr 24;15(1):3475.
doi: 10.1038/s41467-024-47664-z.

High clonal diversity and spatial genetic admixture in early prostate cancer and surrounding normal tissue

Affiliations

High clonal diversity and spatial genetic admixture in early prostate cancer and surrounding normal tissue

Ning Zhang et al. Nat Commun. .

Abstract

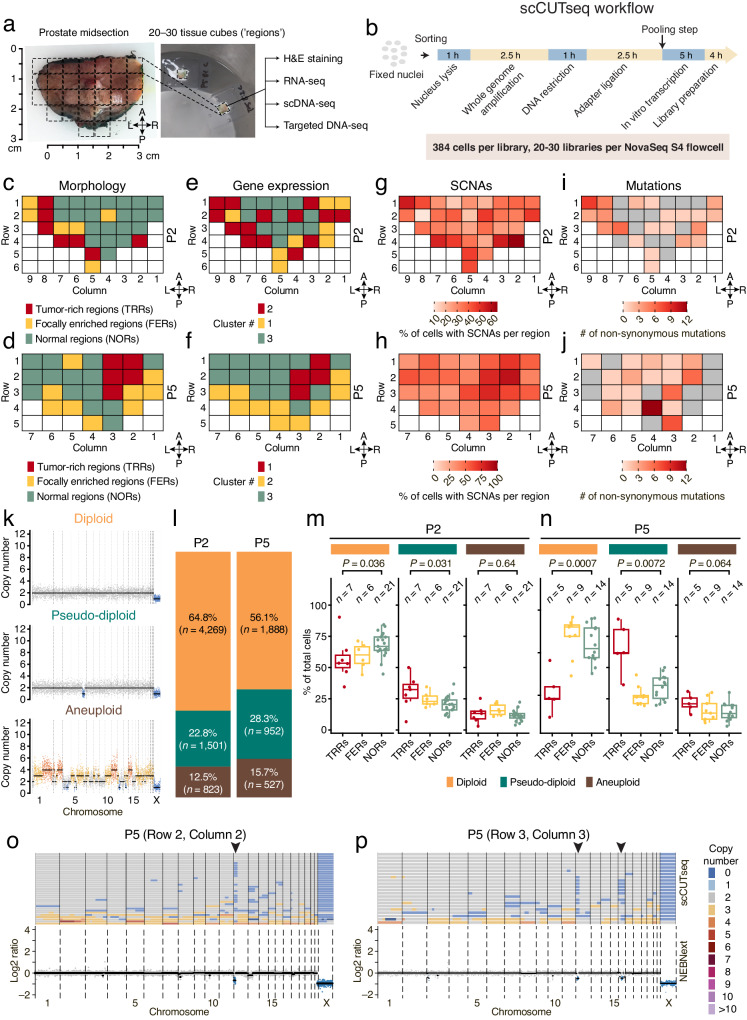
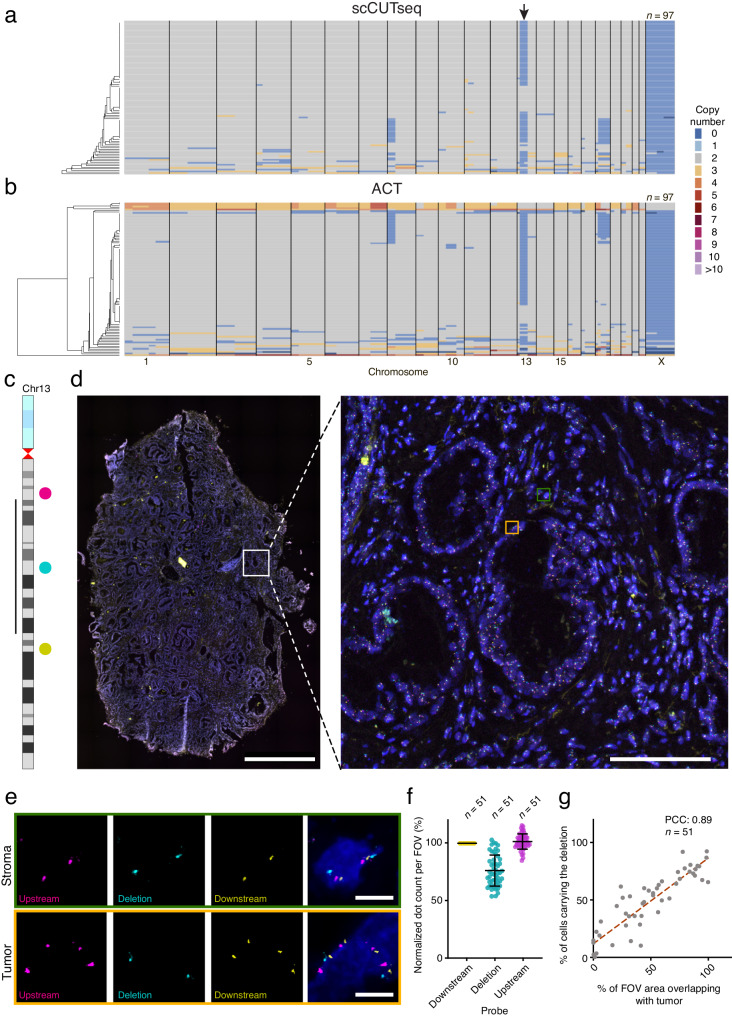
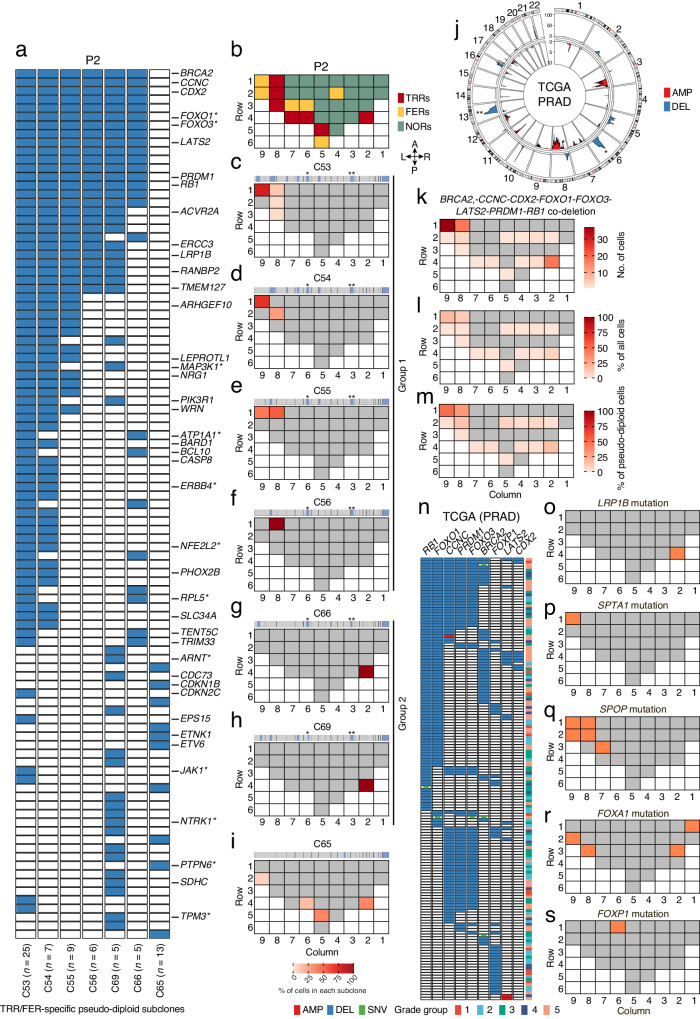
Somatic copy number alterations (SCNAs) are pervasive in advanced human cancers, but their prevalence and spatial distribution in early-stage, localized tumors and their surrounding normal tissues are poorly characterized. Here, we perform multi-region, single-cell DNA sequencing to characterize the SCNA landscape across tumor-rich and normal tissue in two male patients with localized prostate cancer. We identify two distinct karyotypes: 'pseudo-diploid' cells harboring few SCNAs and highly aneuploid cells. Pseudo-diploid cells form numerous small-sized subclones ranging from highly spatially localized to broadly spread subclones. In contrast, aneuploid cells do not form subclones and are detected throughout the prostate, including normal tissue regions. Highly localized pseudo-diploid subclones are confined within tumor-rich regions and carry deletions in multiple tumor-suppressor genes. Our study reveals that SCNAs are widespread in normal and tumor regions across the prostate in localized prostate cancer patients and suggests that a subset of pseudo-diploid cells drive tumorigenesis in the aging prostate.


Conflict of interest statement

The authors declare no competing interests.

Figures

Fig. 1
Fig. 1. SCNAs and mutations are widespread in prostates from patients with localized prostate cancer.
a Photograph of one of the prostate samples (P5) and of two frozen tissue cubes (‘regions’) excised from the same sample. The dashed grid marks (roughly) the regions in the corresponding maps in (d, f, h, j). b scCUTseq workflow. c, d Schematic maps displaying the histopathological classification of regions of the two prostate samples (P2 and P5, respectively). Each cell in the grid represents a tissue region, white cells indicate absence of tissue. e, f Similar to (c, d) but displaying the classification of each tissue region based on clustering of RNA-seq data (see Supplementary Fig. 5). g, h Percentage of all cells carrying at least one SCNA in each region of P2 and P5, respectively. i, j Schematic map showing the number of non-synonymous SNVs in P2 and P5, respectively. The anatomical orientation of the maps in c-j is shown by the four arrows near each map. A, anterior. P, posterior. L, left. R, right. k Representative copy number profiles (500 kb resolution) of diploid, pseudo-diploid and aneuploid cells. l Fraction of each karyotype shown in (k) in P2 and P5. n, number of cells. m, n Percentage of each karyotype exemplified in (k) in tumor-rich regions (TRRs), focally enriched regions (FERs) and normal regions (NORs) in P2 and P5, respectively. n, number of regions. P, Wilcoxon test, two-tailed. Boxplots extend from the 25th to the 75th percentile, horizontal bars represent the median, and whiskers extend from –1.5 × IQR to +1.5 × IQR from the closest quartile. IQR, inter-quartile range. o Copy number profiles (500 kb resolution, each row represents a single cell) from nuclei extracted from one region in sample P5 (top) and corresponding bulk copy number profile (500 kb resolution) from the same region (bottom). The arrowhead pinpoints a subclonal deletion that was detected by both scCUTseq and bulk DNA-seq. p As in (o) but for a different region in sample P5. A link to the Source Data for this figure is provided in the Data Availability statement.
Fig. 2
Fig. 2. Pseudo-diploid cells are characterized by high clonal and spatial heterogeneity.
a Phylogenetic Newick tree of pseudo-diploid cells identified in sample P2. Each leaf in the tree corresponds to one pseudo-diploid cell. b Copy number profiles (500 kb resolution) of the pseudo-diploid cells in the phylogenetic tree shown in (a). n, number of cells. c Fraction of the genome amplified (AMP) or deleted (DEL) in each subclone identified in P2 and P5, respectively. df As in (ac) but for prostate sample P5. g, h Shannon entropy of each pseudo-diploid cell subclone (C) identified in P2 and P5, respectively. The most localized and widespread subclones in each sample are labeled (see Supplementary Figs. 17 and 18 for the distribution map of each subclone). i, j Distribution of the mean Shannon entropy of pseudo-diploid subclones inside tumor-rich regions (TRRs), focally enriched regions (FERs) and normal regions (NORs) in P2 and P5, respectively. Each dot represents one region. P, Wilcoxon test, two-tailed. n, number of tissue regions for TRRs, FERs, and NORs, respectively. Boxplots extend from the 25th to the 75th percentile, horizontal bars represent the median, and whiskers extend from –1.5 × IQR to +1.5 × IQR from the closest quartile, where IQR is the inter-quartile range. k, l Spatial distribution of the cells belonging to the five most localized pseudo-diploid subclones (C) identified in sample P2 and P5, respectively, and corresponding histopathological classification of each region, as in Fig. 1c, d. n, number of cells in each subclone. The anatomical orientation of the maps is as in Fig. 1c–j. A link to the Source Data for this figure is provided in the Data Availability statement.
Fig. 3
Fig. 3. Validation and spatial mapping of pseudo-diploid cells identified by scCUTseq.
a, b Single-cell copy number profiles (500 kb resolution) obtained by applying scCUTseq (a) or Acoustic Cell Tagmentation (ACT) (b) to nuclei extracted from a single tumor-rich region in prostate sample P6. n, number of cells. The arrow indicates a subclonal deletion on chr13 q-arm detected by both scCUTseq and ACT. c Chr13 ideogram showing the location of the three DNA FISH probes (colored dots) used to detect the chr13 deletion spanning the region indicated by the vertical bar on the left and corresponding to the deletion marked by the arrows in (a, b). d Whole-slide low-magnification (25X) imaging after DNA FISH was performed using the probes shown in (c). The white squared region is magnified on the right. Scale bars, 1 mm (left) and 100 μm (right). e Examples of nuclei with both chr13 copies intact (stroma) or with one of the two copies carrying the deletion shown in (c) (tumor). White arrows indicate missing cyan dots, which correspond to the FISH probe targeting the deleted region. The nuclei shown are 100X magnification zoom-in views of the same-color squared regions in (d). Scale bars, 5 μm. f Quantification of the number of fluorescent dots corresponding to each of the DNA FISH probes in (c), across 51 (n) fields of view (FOVs) imaged at high magnification (100X) in the whole-slide image shown in (d). The number of dots in each color was normalized to the number of yellow dots, corresponding to the probe downstream of the deleted region, as shown in (c). Each dot represents one FOV. Error bars span from –1.5 × IQR to +1.5 × IQR from the closest quartile. IQR, inter-quartile range. Horizontal bar, median. g Correlation between the fraction of cells carrying the deletion in each of the FOVs (n) analyzed in (f), and the proportion of the area of the corresponding FOVs that overlaps with regions annotated as tumor (see Supplementary Fig. 23). Dashed red line: linear regression. PCC, Pearson’s correlation coefficient. A link to the Source Data for this figure is provided in the Data Availability statement.
Fig. 4
Fig. 4. Tumor suppressor genes lost in highly localized pseudo-diploid subclones are putative drivers of early prostate tumorigenesis.
a OncoPrint plot showing genes classified as tumor-suppressor genes (TSGs) in the Catalogue of Somatic Mutations in Cancer (COSMIC) that were deleted (blue rectangles) in pseudo-diploid subclones (C) localized exclusively in tumor-rich regions (TRRs) or focally enriched regions (FERs) in prostate sample P2. n, number of pseudo-diploid cells in each subclone. Asterisks indicate genes annotated both as TSGs and as oncogenes (context-dependent TSGs) in COSMIC. b As in Fig. 1c. ci Spatial distribution of the seven pseudo-diploid subclones (C) shown in (a). The median copy number profile of each subclone is shown on top of the corresponding tissue map. Asterisks indicate regions on chr6 (*) and chr13 (**) that are deleted in many subclones. j Circos plot showing chromosomal regions frequently amplified (AMP) or deleted (DEL) (identified using GISTIC) across 492 (n) prostate adenocarcinoma (PRAD) samples in The Cancer Genome Atlas (TCGA). Y-axis, –log10(q-value). The asterisks mark the regions on chr6 and 13 that were found deleted in multiple pseudo-diploid subclones, as shown in (ch). km Spatial distribution of the pseudo-diploid cells carrying a co-deletion of the indicated eight TSGs in sample P2. n OncoPrint plot displaying TCGA PRAD samples with an amplification (AMP), deletion (DEL) or mutation (SNV) of the eight TSGs shown in (km) plus FOXP1. Each row in the plot corresponds to one TCGA PRAD sample and the corresponding Grade Group is shown in the colorbar on the right. os Schematic maps showing where the indicated genes were found mutated (non-synonymous SNVs) in sample P2. Gray cells indicate tissue regions in which the indicated gene was not altered. White cells indicate absence of tissue. The anatomical orientation of all the maps in (ci) and (os) is as in (b). A link to the Source Data for this figure is provided in the Data Availability statement.

References

    1. Watkins TBK, et al. Pervasive chromosomal instability and karyotype order in tumour evolution. Nature. 2020;587:126–132. doi: 10.1038/s41586-020-2698-6. - DOI - PMC - PubMed
    1. Knouse KA, Davoli T, Elledge SJ, Amon A. Aneuploidy in cancer: seq-ing answers to old questions. Annu. Rev. Cancer Biol. 2017;1:335–354. doi: 10.1146/annurev-cancerbio-042616-072231. - DOI
    1. Harbers L, et al. Somatic copy number alterations in human cancers: an analysis of publicly available data from the cancer genome atlas. Front. Oncol. 2021;11:700568. doi: 10.3389/fonc.2021.700568. - DOI - PMC - PubMed
    1. Baca SC, et al. Punctuated evolution of prostate cancer genomes. Cell. 2013;153:666–677. doi: 10.1016/j.cell.2013.03.021. - DOI - PMC - PubMed
    1. Gao R, et al. Punctuated copy number evolution and clonal stasis in triple-negative breast cancer. Nat. Genet. 2016;48:1119–1130. doi: 10.1038/ng.3641. - DOI - PMC - PubMed

Publication types