. 2024 Apr 24;15(1):3443.
doi: 10.1038/s41467-024-47877-2.

Single cell tracing of Pomc neurons reveals recruitment of 'Ghost' subtypes with atypical identity in a mouse model of obesity

Affiliations

Single cell tracing of Pomc neurons reveals recruitment of 'Ghost' subtypes with atypical identity in a mouse model of obesity

Stéphane Leon et al. Nat Commun. .

Abstract

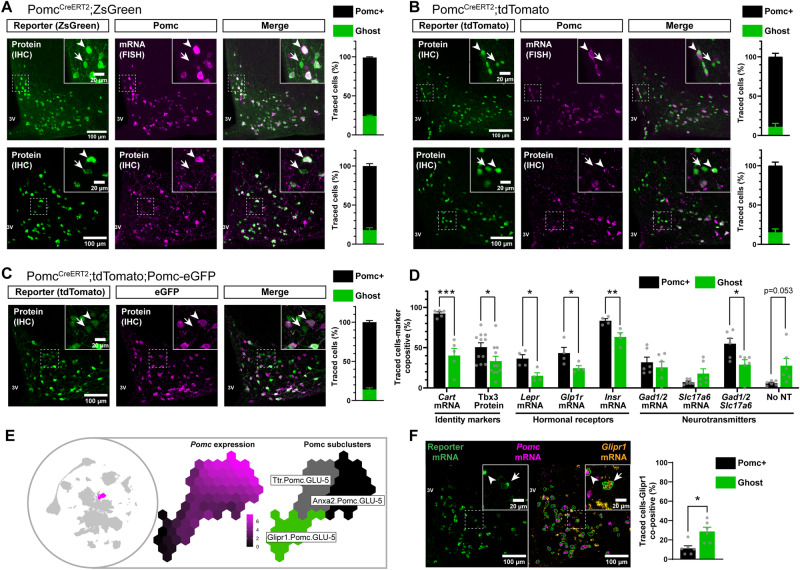
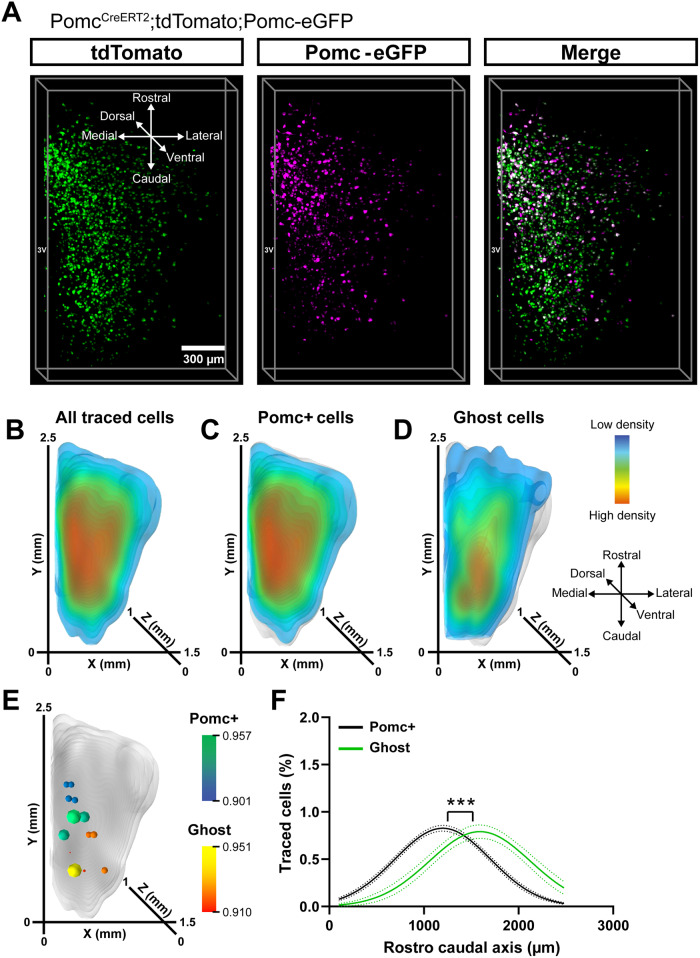
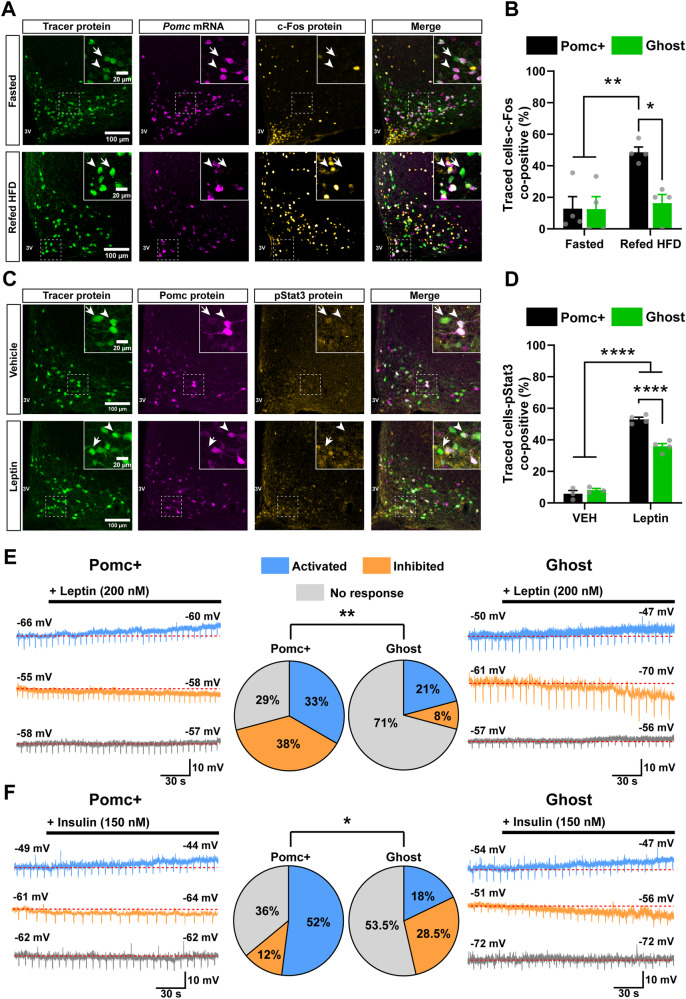
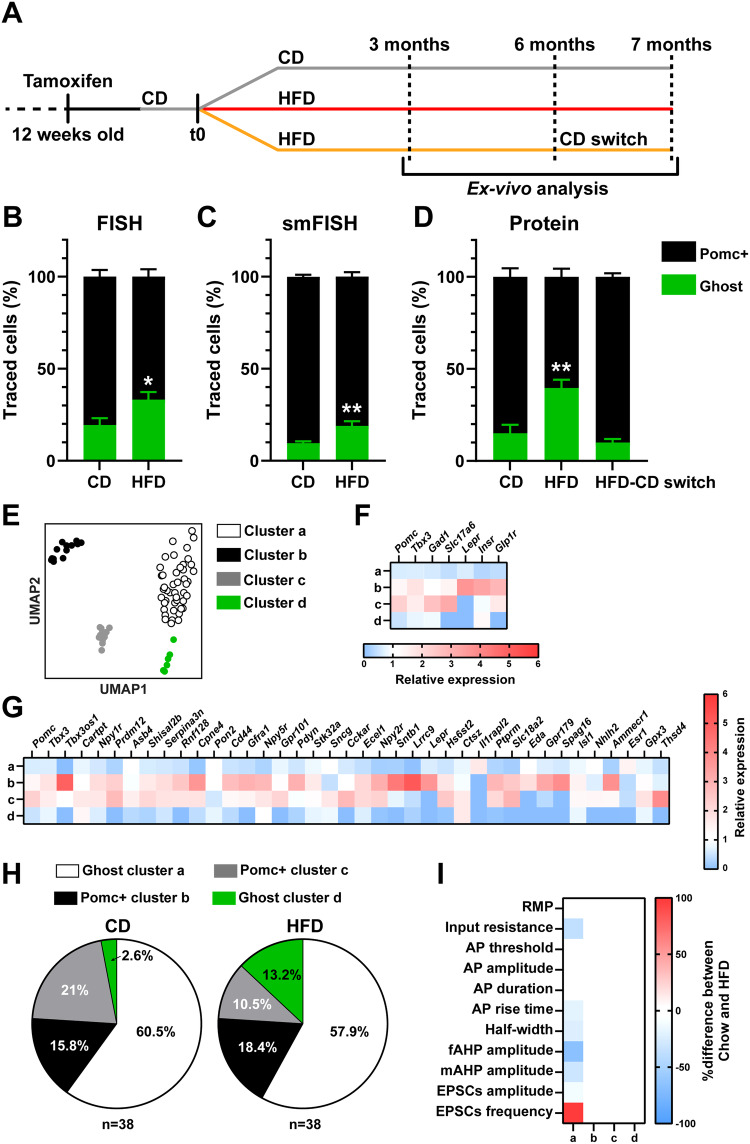
The hypothalamus contains a remarkable diversity of neurons that orchestrate behavioural and metabolic outputs in a highly plastic manner. Neuronal diversity is key to enabling hypothalamic functions and, according to the neuroscience dogma, it is predetermined during embryonic life. Here, by combining lineage tracing of hypothalamic pro-opiomelanocortin (Pomc) neurons with single-cell profiling approaches in adult male mice, we uncovered subpopulations of 'Ghost' neurons endowed with atypical molecular and functional identity. Compared to 'classical' Pomc neurons, Ghost neurons exhibit negligible Pomc expression and are 'invisible' to available neuroanatomical approaches and promoter-based reporter mice for studying Pomc biology. Ghost neuron numbers augment in diet-induced obese mice, independent of neurogenesis or cell death, but weight loss can reverse this shift. Our work challenges the notion of fixed, developmentally programmed neuronal identities in the mature hypothalamus and highlight the ability of specialised neurons to reversibly adapt their functional identity to adult-onset obesogenic stimuli.


Conflict of interest statement

The authors declare no competing interests.

Figures

Fig. 1
Fig. 1. Lineage tracing of Pomc neurons in adult chow-fed mice reveals subtypes with atypical molecular identity.
A Detection and quantification of Pomc+ and Ghost neurons in PomcCreERT2;ZsGreen male mice by analyzing reporter cells (ZsGreen) positive (Pomc + ) or negative (Ghost) for Pomc mRNA (FISH, n = 11 mice) or Pomc protein (IHC, n = 5 mice). B Detection and quantification of Pomc+ and Ghost neurons in PomcCreERT2;tdTomato male mice by analyzing reporter cells (tdTomato) positive (Pomc + ) or negative (Ghost) for Pomc mRNA (FISH, n = 3 mice) or Pomc protein (IHC, n = 4 mice). C Detection and quantification of Pomc+ and Ghost neurons in PomcCreERT2;tdTomato;Pomc-eGFP male mice (n = 4) by analyzing reporter cells (tdTomato) positive (Pomc + ) or negative (Ghost) for endogenous eGFP protein by IHC. D Quantification of Pomc+ and Ghost neurons co-expressing detectable mRNA or protein levels of several Pomc neuronal functional markers in PomcCreERT2;ZsGreen or PomcCreERT2;tdTomato male mice. Cart mRNA was assessed by smFISH (n = 5 mice), Tbx3 by IHC (n = 11 mice), hormone receptors by smFISH (n = 4 mice), and neurotransmitter-related markers by smFISH (n = 6 mice). E Pomc neurons in the hypothalamus by the scRNAseq atlas HypoMap. Left: Global Uniform Manifold Approximation and Projection (UMAP) with Pomc-cluster position highlighted. Middle: Summarised Pomc expression levels within the POMC-cluster. Right: Pomc neuron subclusters. F Representative image and quantification of the percentage of Pomc+ and Ghost neurons co-postive for Glipr1 mRNA by smFISH in PomcCreERT2;tdTomato male mice (n = 6). Pomc: pro-opiomelanocortin, AgRP: agouti-related protein, Npy: neuropeptide y, Kiss: kisspeptin, Cart: cocaine-and amphetamine-regulated transcript, Tbx3: T-box gene 3, Lepr: leptin receptor, Glp1r: glucagon-like peptide-1 receptors Gad1/2: Glutamate decarboxylase 1 and 2, Slc17a6: vesicular glutamate transporter 2, IHC: immunohistochemistry, FISH fluorescence in situ hybridisation, smFISH single molecule fluorescence in situ hybridisation, NT neurotransmitter. Glipr1: Glioma pathogenesis-related protein 1. Pomc+ neurons are indicated by arrowheads, Ghost neurons by arrows. Data in (AD, and F) are mean ± s.e.m. from 3 independent experiments. n indicates the individual biological values. Data in (AD and F) were obtained 2 weeks after adult onset (12-week-old mice) administration of tamoxifen. In D: ***P = 0.0004 (Cart), *P = 0.0453 (Tbx3), *P = 0.0129 (Lepr), *P = 0.049 (Glp1r), **P = 0.0117 (Insr),*P = 0.016 (Slc17a6) by two-tailed t test. In F, *P = 0.0154 by two-tailed t-test. Source data are provided as a Source Data file.
Fig. 2
Fig. 2. Ghost neurons show a distinct spatial distribution under chow-diet.
A Representative 3D reconstruction of populations expressing tdTomato, Pomc-eGFP (hemi-arcuate nucleus), and the combined signal in PomcCreERT2;tdTomato;Pomc-eGFP male mice (n = 3) 2 weeks after adult onset (12-week-old mice) administration of tamoxifen. Isosurface density plots of the whole traced cell population (B), the Pomc+ subset (C) and Ghost neurons (D). Grey shaded areas in (D, E) represent the whole traced cell population. E Statistical representation of the differences in distribution between the Pomc+ cells and Ghost cells using a two-tailed t test. P values are plotted as spheres within the space occupied by the neurons (background). The size and colour of the spheres indicate the significance values in a range from green to blue (Pomc + ) and yellow to red (Ghost). F Cumulative distribution of the Pomc+ and Ghost subpopulations for the rostro-caudal spatial axis. Data are shown as non-linear fitted curves (Gaussian). ***P < 0.001 with extra-sum-of-squares F-test comparison. Data were obtained from 2 independent experiments. n indicates the individual biological values. Source data are provided as a Source Data file.
Fig. 3
Fig. 3. Ghost cells have atypical sensitivity to nutritional and hormonal cues.
A Representative FISH/IHC images of the tdTomato reporter (protein), Pomc (mRNA) and c-FOS (protein) in PomcCreERT2;tdTomato male mice challenged with fasting (24 h, n = 4) or fasting followed by refeeding (2 h, n = 4). B Quantification of Pomc+ versus Ghost neurons positive for c-FOS relative to (A). C Representative IHC images of the tdTomato reporter, Pomc protein, and pStat3 in CD-fed PomcCreERT2;tdTomato male mice injected subcutaneously with vehicle (n = 3) or leptin (5 mg/kg; n = 4) 45 min before brain harvest. D Quantification of the percentage of reporter cells (tdTomato) positive for pStat3 in Pomc+ versus Ghost neurons relative to (C). E, F Ex-vivo whole cell patch-clamp recording of Ghost and Pomc+ neurons in PomcCreERT2;tdTomato;Pomc-eGFP male mice following leptin (200 nM) or insulin (150 nM) challenge. Representative traces of Pomc+ or Ghost neurons are shown on the left and right. Middle: % of activated cells (Δ resting membrane potential ≥+2 mV, Δ input resistance ≥10% change) in response to leptin (E, blue; Pomc + : n = 8; Ghost: n = 5) or insulin (F, blue; Pomc + : n = 13; Ghost: n = 5), inhibited cells (Δ resting membrane potential ≤−2 mV, Δ input resistance ≥10% change) in response to leptin (E, orange; Pomc + : n = 9; Ghost: n = 2) or insulin (F, orange; Pomc + : n = 3; Ghost: n = 8) and non-responsive cells (grey; Leptin: Pomc + : n = 7; Ghost: n = 17; insulin: Pomc + : n = 9; Ghost: n = 15). Downward deflections in current-clamp recordings represent the membrane voltage responses to constant hyperpolarizing currents. Dotted lines represent the resting membrane potential. 16 total mice for leptin and 17 for insulin were analyzed in this experiment. pStat3: phosphorylated transducer and activator of transcription-3, CD: chow diet, HFD: high fat diet. In (A, C) arrowheads define Pomc+ neurons, arrows define Ghost neurons. All mice were studied 2 weeks after adult onset (12-week-old mice) administration of tamoxifen. n indicates the individual biological values. Data are mean ± s.e.m from 2 independent experiments and were analyzed by 2-way ANOVA followed by Tukey’s post-test. In (B), **P = 0.0176 and *P = 0.091. In (D), ****P < 0,0001. Data in (E, F) were obtained from 3 independent experiments analyzed by chi-squared test. Source data are provided as a Source Data file.
Fig. 4
Fig. 4. Ghost cell recruitment in HFD-induced obesity.
A Reporter mice were treated with tamoxifen at 12 weeks of age and exposed to HFD, CD or (HFD-CD switch) for different durations 2 weeks later (t0). B, C Quantification of Pomc+ and Ghost neurons in PomcCreERT2;ZsGreen male mice fed with CD or HFD (6 months). Pomc mRNA was analyzed by FISH (B, n = 8 per group) or smFISH (C, n = 6 per group). D Quantification by IHC of Pomc+ and Ghost neurons in PomcCreERT2;ZsGreen male mice fed with CD (n = 4), HFD (7 months, n = 4), or exposed to HFD-CD switch (n = 3). E UMAP representation of 76 neurons analyzed by patch-seq in PomcCreERT2;tdTomato male mice exposed to CD (n = 5) or HFD (n = 5) for 6 months. We collected n = 38 cells from CD mice and n = 38 from HFD mice. We identified 4 main clusters: a (45 cells), b (13 cells), c (12 cells) and d (6 cells). F Heatmap of the relative gene expression (mean expression one cluster relative to the others) of Typical Pomc+ markers altered in Ghost neurons based on the data in Fig. 1D. G Heatmap of the relative gene expression (mean expression of one cluster relative to the others) of Pomc-neuron specific genes from HypoMAP in the clusters identified in (E). H Change in the % of cells in each cluster between the CD and HFD conditions. I Effects of HFD exposure (6 months) on electrophysiological parameters in the different clusters that were significantly different (HFD vs. CD) by two-tailed t test. RMP resting membrane potential. AP action potential. fAHP fast afterhyperpolarization. mAHP medium afterhyperpolarization. EPSCs: excitatory post synaptic currents. HFD high fat diet, CD chow diet. Data in (BD) are mean ± s.e.m from 3 (B, C) or 2 (D) independent experiments. Data in (E) were obtained from 3 independent experiments. n indicates the individual biological values. In (B, C) *P = 0.0207 and **P = 0.0087 by two-tailed t test (CD Ghost vs HFD Ghost). In (D), **P = 0.0058 (CD Ghost vs HFD Ghost) and **P = 0.0022 (HFD Ghost vs HFD-CD Ghost) by ANOVA followed by Tukey’s post-test. Data in (H) are shown as a percentage of the total population P = 0,0004 by chi-squared test. Source data are in the Source Data file.

References

    1. Deneris ES, Hobert O. Maintenance of postmitotic neuronal cell identity. Nat. Neurosci. 2014;17:899–907. doi: 10.1038/nn.3731. - DOI - PMC - PubMed
    1. Lipinski M, et al. KAT3-dependent acetylation of cell type-specific genes maintains neuronal identity in the adult mouse brain. Nat. Commun. 2020;11:2588. doi: 10.1038/s41467-020-16246-0. - DOI - PMC - PubMed
    1. Mills JC, Stanger BZ, Sander M. Nomenclature for cellular plasticity: are the terms as plastic as the cells themselves? EMBO J. 2019;38:e103148. doi: 10.15252/embj.2019103148. - DOI - PMC - PubMed
    1. Zeltser LM. Developmental influences on circuits programming susceptibility to obesity. Front. Neuroendocrinol. 2015;39:17–27. doi: 10.1016/j.yfrne.2015.07.002. - DOI - PMC - PubMed
    1. Bouret SG. Developmental programming of hypothalamic melanocortin circuits. Exp. Mol. Med. 2022;54:403–413. doi: 10.1038/s12276-021-00625-8. - DOI - PMC - PubMed

Publication types

Substances