. 2024 Apr 24;15(1):3468.
doi: 10.1038/s41467-024-47437-8.

Functional synergy of a human-specific and an ape-specific metabolic regulator in human neocortex development

Affiliations

Functional synergy of a human-specific and an ape-specific metabolic regulator in human neocortex development

Lei Xing et al. Nat Commun. .

Abstract

Metabolism has recently emerged as a major target of genes implicated in the evolutionary expansion of human neocortex. One such gene is the human-specific gene ARHGAP11B. During human neocortex development, ARHGAP11B increases the abundance of basal radial glia, key progenitors for neocortex expansion, by stimulating glutaminolysis (glutamine-to-glutamate-to-alpha-ketoglutarate) in mitochondria. Here we show that the ape-specific protein GLUD2 (glutamate dehydrogenase 2), which also operates in mitochondria and converts glutamate-to-αKG, enhances ARHGAP11B's ability to increase basal radial glia abundance. ARHGAP11B + GLUD2 double-transgenic bRG show increased production of aspartate, a metabolite essential for cell proliferation, from glutamate via alpha-ketoglutarate and the TCA cycle. Hence, during human evolution, a human-specific gene exploited the existence of another gene that emerged during ape evolution, to increase, via concerted changes in metabolism, progenitor abundance and neocortex size.


Conflict of interest statement

O.H. occasionally serves on advisory boards for Bayer AG and Gedeon Richter and has designed and lectured at educational events for these companies. The remaining authors declare no competing interests.

Figures

Fig. 1
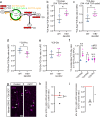
Fig. 1. Ape-specific GLUD2 enhances the increase by human-specific ARHGAP11B in bRG abundance, but not that in bIP abundance.
a Primate-specific genes that are preferentially expressed in NPCs, grouped according to their first appearance in either monkeys, apes, or human (data from Florio et al.). b Immunofluorescence of E14.5 wildtype (WT), ARHGAP11B-transgenic (11B), GLUD2-transgenic (GLUD2) and ARHGAP11B + GLUD2 double-transgenic (11B + GLUD2) mouse neocortex for phosphovimentin (pVim, magenta). Arrows indicate mitotic BPs with basal and/or apical process (bRG); arrowheads indicate mitotic BPs without basal and/or apical process (bIPs). ce Quantification of pVim+ APs (c), pVim+ bIPs (d) and pVim+ bRG (e), using immunostained cryosections obtained as in b. n = 4 (WT), 5 (11B), 5 (GLUD2) and 10 (11B + GLUD2) biologically independent embryos in c. n = 7 (WT), 7 (11B), 5 (GLUD2) and 9 (11B + GLUD2) biologically independent embryos in (d, e). Each symbol represents one independent embryo. Data are presented as mean values +/- SD; * p = 0.159 (WT v.s. 11B in d); * p = 0.0495 (WT v.s. 11B + GLUD2 in d); ** p = 0.0044 (11B v.s. 11B + GLUD2 in e); **p = 0.0026 (GLUD2 vs. 11B + GLUD2 in e); *** p < 0.0001. f, g, Immunofluorescence of E14.5 wildtype (WT), ARHGAP11B-transgenic (11B), GLUD2-transgenic (GLUD2) and ARHGAP11B + GLUD2 double-transgenic (11B + GLUD2) mouse neocortex for Pax6 (green) and Tbr2 (magenta). Dotted lines indicate the border between ventricular zone (VZ) and subventricular zone (SVZ). Boxed areas in f are shown at higher magnification in (g). h Quantification of Pax6+Tbr2– BPs, using immunostained cryosections obtained as in f. n = 6 (WT), 5 (11B), 4 (GLUD2) and 6 (11B + GLUD2) biologically independent embryos. Each symbol represents one independent embryo. Data are presented as mean values +/- SD; *p < 0.049; **p < 0.0094 (11B vs. 11B + GLUD2); ** p = 0.0013 (GLUD2 vs. 11B + GLUD2); **** p < 0.0001. ANOVA followed by Tukey–Kramer tests were used for all analysis. Scale bars: 20 µm in b, f; 10 µm in g. Source data are provided as a Source Data file.
Fig. 2
Fig. 2. GLAST is required for the enhancement by GLUD2 of the ARHGAP11B-mediated increase in bRG abundance.
a 13C5-glutamate (Glu) levels in bRG, expressed as normalized peak areas (arbitrary units, A.U.). WT or ARHGAP11B + GLUD2 double-transgenic (11B + GLUD2) mouse neocortical tissue at E14.5 was incubated with 0.5 mM of 13C5-glutamate (Glu) or unlabeled glutamate (control, Ctrl) for 2 h, followed by isolation of bRG and quantification of 13C5-glutamate (for details, see Methods). n = 400,000 cells from 12 biologically independent embryos per group, examined over 4 independent experiments. Each symbol represents one independent experiment. Data are presented as mean values +/- SD; **** p < 0.0001, N.S., not significant. b Immunofluorescence of E14.5 ARHGAP11B + GLUD2 double-transgenic and wildtype GLAST (GLAST WT) mouse neocortex and ARHGAP11B + GLUD2 double-transgenic and GLAST knockout (GLAST KO) mouse neocortex for phosphovimentin (pVim, magenta). Arrowhead indicates a mitotic BP with a basal process (bRG); arrow indicates a mitotic BP without a radial process (bIP). BV, blood vessel. c, Quantification of pVim+ APs (left), pVim+ bIPs (middle) and pVim+ bRG (right), using immunostained cryosections obtained as in (b). n = 6 biologically independent embryos per group. Each symbol represents one independent embryo. Data are presented as mean values +/- SD; ** p = 0.0065, to-tailed Mann-Whitney test. d Immunofluorescence of E14.5 ARHGAP11B + GLUD2 double-transgenic and wildtype GLAST (GLAST WT) mouse neocortex and ARHGAP11B + GLUD2 double-transgenic and GLAST knockout (GLAST KO) mouse neocortex for Pax6 (cyan) and Tbr2 (magenta). Dotted lines indicate the border between the ventricular zone and subventricular zone. e Quantification of Pax6+Tbr2– BPs (bRG, top) and Pax6–Tbr2+ BPs (bIPs, bottom), using immunostained cryosections obtained as in F. n = 6 biologically independent embryos per group. Each symbol represents one independent embryo. Data are presented as mean values +/- SD; ** p < 0.0066, t = 3.411, df=10, two-tailed Student’s t test. f Fetal human neocortical tissue at GW15 was subjected to FFT culture for 72 h in the absence (Control) or presence of 200 μM of the glutamate uptake inhibitor PDC, followed by immunofluorescence for pVim (magenta), SOX2 (white) and TBR2 (green). g, h Quantification of (g) abventricular pVim+TBR2+ cells (mitotic bIPs, left) and pVim+TBR2– cells (mitiotic bRG, right), and (h) SOX2+TBR2+ cells (bIPs, left) and SOX2+TBR2– cells (bRG. right) in the OSVZ, using immunostained cryosections obtained as in f and comprising GW12-15. Cell numbers are expressed as a ratio of PDC treatment to control. n = 3 biologically independent fetal human neocortices. Each symbol represents one an independent female human neocortex. The red lines at 1.0 indicate the ratio obtained if PDC treatment would have had no effect. Black lines, mean ratio; N.S., not significant; * p < 0.0483, t = 4.385, df=2, one sample t test; ** p < 0.0018, t = 23.71, df = 2, one sample t test. Scale bars in b, d, f: 50 µm. Source data are provided as a Source Data file.
Fig. 3
Fig. 3. Increased aspartate production from glutamate via the TCA cycle in ARHGAP11B + GLUD2 bRG, and its relevance for bRG proliferation in fetal human neocortex.
a Schematic illustration of selected aspects of glutamate metabolism. 13C5-glutamate (Glu) can be metabolized to 13C5-glutamine (Gln), to 13C5-proline (Pro), and to either 13C4-aspartate (Asp) generated via αKG and oxaloacetate (OAA) through one three-quarter (¾) TCA cycle (orange) or 13C2-aspartate generated through one full TCA cycle (green) followed by one three-quarter (¾) TCA cycle. 13C atoms are indicated by red circles. b–f WT or ARHGAP11B + GLUD2 double-transgenic (11B + GLUD2) mouse neocortical tissue at E14.5 was incubated with 0.5 mM of 13C5-glutamate for 2 h, followed by isolation of bRG and metabolome analysis (for details, see Methods). n = 500,000 cells from 15 biologically independent embryos per group, examined over 5 independent experiments. Each symbol represents one independent experiment. Data are presented as mean values +/- SD. * p = 0.0165, t = 3.021, df=8 in b; * p = 0.026, t = 2.727, df=8 in c; * p = 0.041, t = 2.433, df=8 in d; * p = 0.025, t = 2.972, df=6; ** p = 0.0077, t = 3.936, df=6; all tests are two-tailed Student’s t test. be, Values of 13C4-aspartate (Asp) (b), 13C2-aspartate (Asp) (c), 13C5-proline (Pro) (d) and 13C5-glutamine (Gln) (e), each expressed as a ratio to that of 13C5-glutamate (Glu), in bRG from WT (blue) and ARHGAP11B + GLUD2 double-transgenic (magenta) mouse neocortex at E14.5. f, Values of 13C2-aspartate (Asp), 13C4-aspartate (Asp) and 13C5-proline (Pro), each expressed as a ratio to that of 13C5-glutamate (Glu), in aRG (blue) and bRG (magenta) from ARHGAP11B + GLUD2 double-transgenic mouse neocortex at E14.5. g Fetal human neocortical tissue at GW13 was subjected to FFT culture for 72 h in the absence (Control) or presence of 10 μM of the GOT1/2 inhibitor iGOT, followed by immunofluorescence for pVim (magenta). h, i, Quantification of (h) abventricular pVim+ cells without radial processes (mitotic bIPs) and (i) pVim+ cells with radial processes (mitiotic bRG), using immunostained cryosections obtained as in g and comprising GW12-15. Cell numbers are expressed as a ratio of iGOT treatment to control. n = 3 biologically independent fetal human neocortices. Each symbol represents one independent female human neocortex. The red lines at 1.0 indicate the ratio obtained if iGOT treatment would have had no effect. Black lines, mean ratio. * p = 0.0089, t = 10.54, df=2, one sample t test. Error bars, SD; N.S., not significant; Scale bars in g: 10 µm. Source data are provided as a Source Data file.
Fig. 4
Fig. 4. Extracellularly supplied αKG alone suffices to increase bRG abundance in embryonic wildtype mouse neocortex and rescues the reduction in bRG abundance upon ARHGAP11B inhibition in fetal human neocortex.
a Immunofluorescence of E13.5 mouse neocortical tissue, incubated for 48 h without (Control) or with 1 mM ETaKG, for phosphovimentin (pVim, magenta). Arrow indicates a mitotic BP with a basal (bRG); arrowheads indicate mitotic BPs without radial processes (bIPs). b–d Quantification of pVim+ APs (b), pVim+ bIPs (BPs without radial processes, c) and pVim+ bRG (BPs with radial processes, d), using immunostained cryosections obtained as in (a). n = 7 biologically independent embryos per group. Each symbol represents one independent embryo. Data are presented as mean values +/- SD; * p = 0.0215, t = 2.641, df=12; *** p = 0.0003, t = 5.023, df=12; all tests are two-tailed Student’s t test. e GW13 human neocortical tissue electroporated with a plasmid encoding GFP, together with either an empty vector (Control) or a human ARHGAP11A220-expressing plasmid (11A220), was incubated for 48 h in the absence (Control, 11A220) or presence (11A220) of 0.5 mM ETaKG (11A220+ETaKG). Upon the three types of treatment, the tissue was subjected to immunofluorescence for PCNA (magenta), TBR2 (white), and GFP (green). Boxed areas in the triple-immunofluorescence images are shown at higher magnification at the right of each image, and show the individual immunofluorescence signals. Selected PCNA + TBR2–GFP+ cycling BPs (bRG) are outlined by dashed white lines; one selected PCNA–TBR2+ GFP+ newborn neuron is outlined by dotted white lines; selected PCNA+TBR2+GFP+ cycling BPs (bIPs) are outlined by solid white lines. f–h Quantification of the percentage of GFP+ cells in the VZ that are PCNA+ (f), and of GFP+ cells in the SVZ that are PCNA+TBR2– (bRG, g) or PCNA+TBR2+ (bIPs, h), upon control, 11A220 and 11A220+ETaKG treatment, using immunostained cryosections obtained as in e. n = 3 biologically independent fetal human neocortices. Each symbol represents one independent female human neocortex. Data are presented as mean values +/- SD; * p = 0.038 (Control v.s. 11A220); * P = 0.043 (11A220 v.s. 11A220+ETaKG), ANOVA followed by Tukey–Kramer tests. Scale bars in a and e: 20 µm. Source data are provided as a Source Data file.

References

    1. Rakic P. Evolution of the neocortex: a perspective from developmental biology. Nat. Rev. Neurosci. 2009;10:724–735. doi: 10.1038/nrn2719. - DOI - PMC - PubMed
    1. Stephan H, Frahm H, Baron G. New and revised data on volumes of brain structures in insectivores and primates. Folia Primatol (Basel) 1981;35:1–29. doi: 10.1159/000155963. - DOI - PubMed
    1. Azevedo FA, et al. Equal numbers of neuronal and nonneuronal cells make the human brain an isometrically scaled-up primate brain. J. Comp. Neurol. 2009;513:532–541. doi: 10.1002/cne.21974. - DOI - PubMed
    1. Sun T, Hevner RF. Growth and folding of the mammalian cerebral cortex: from molecules to malformations. Nat. Rev. Neurosci. 2014;15:217–232. doi: 10.1038/nrn3707. - DOI - PMC - PubMed
    1. Fiddes IT, et al. Human-specific NOTCH2NL genes affect notch signaling and cortical neurogenesis. Cell. 2018;173:1356–1369,. doi: 10.1016/j.cell.2018.03.051. - DOI - PMC - PubMed

Publication types