

DCDC2 inhibits hepatic stellate cell activation and ameliorates CCl4-induced liver fibrosis by suppressing Wnt/β-catenin signaling
- PMID: 38658618
- PMCID: PMC11043443
- DOI: 10.1038/s41598-024-59698-w
DCDC2 inhibits hepatic stellate cell activation and ameliorates CCl4-induced liver fibrosis by suppressing Wnt/β-catenin signaling
Abstract
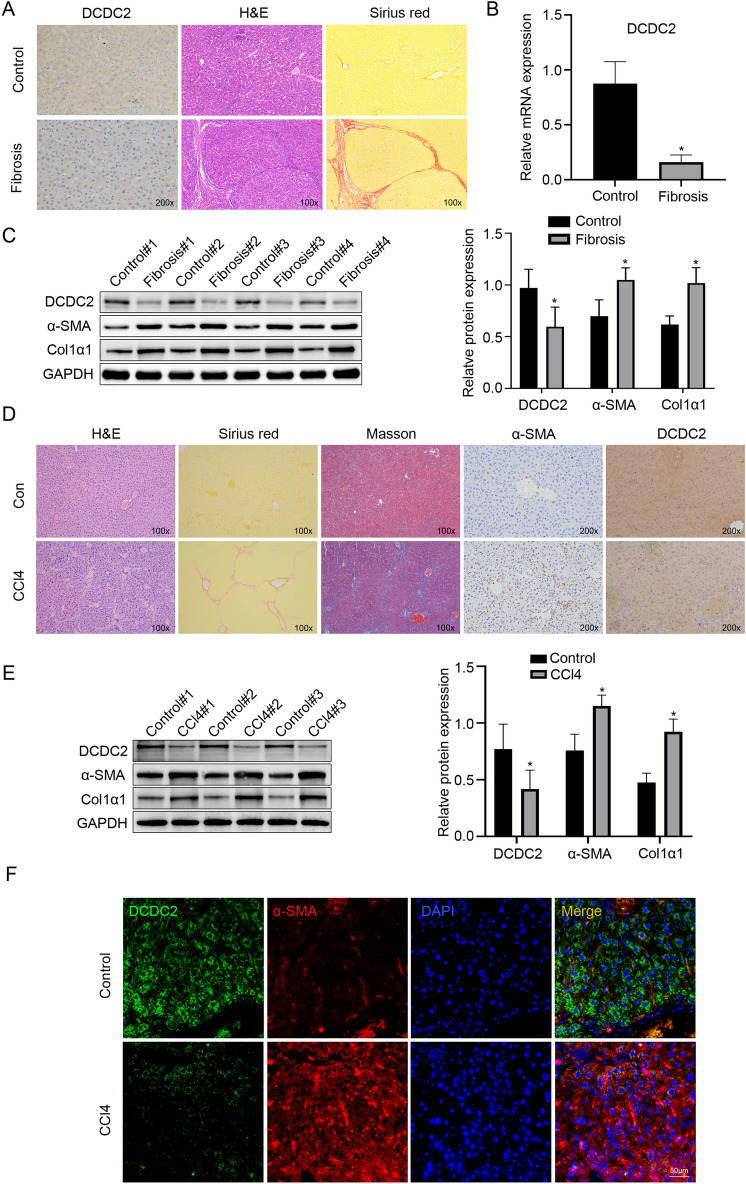
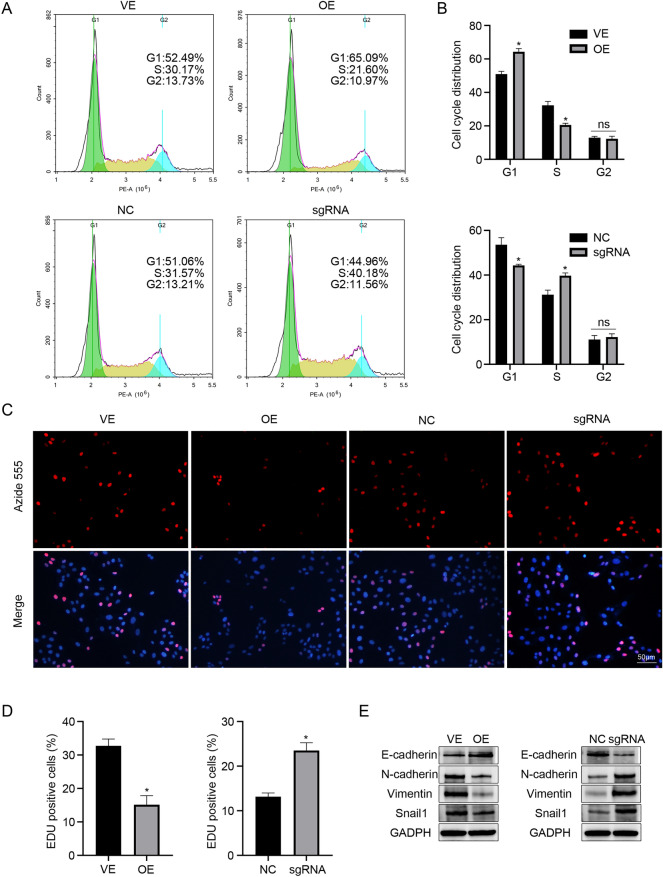
Liver fibrosis, as a consequence of chronic liver disease, involves the activation of hepatic stellate cell (HSC) caused by various chronic liver injuries. Emerging evidence suggests that activation of HSC during an inflammatory state can lead to abnormal accumulation of extracellular matrix (ECM). Investigating novel strategies to inhibit HSC activation and proliferation holds significant importance for the treatment of liver fibrosis. As a member of the doublecortin domain-containing family, doublecortin domain containing 2 (DCDC2) mutations can lead to neonatal sclerosing cholangitis, but its involvement in liver fibrosis remains unclear. Therefore, this study aims to elucidate the role of DCDC2 in liver fibrosis. Our findings revealed a reduction in DCDC2 expression in both human fibrotic liver tissues and carbon tetrachloride (CCl4)-induced mouse liver fibrotic tissues. Furthermore, exposure to transforming growth factor beta-1(TGF-β1) stimulation resulted in a dose- and time-dependent decrease in DCDC2 expression. The overexpression of DCDC2 inhibited the expression of α-smooth muscle actin (α-SMA) and type I collagen alpha 1 (Col1α1), and reduced the activation of HSC stimulated with TGF-β1. Additionally, we provided evidence that the Wnt/β-catenin signaling pathway was involved in this process, wherein DCDC2 was observed to inhibit β-catenin activation, thereby preventing its nuclear translocation. Furthermore, our findings demonstrated that DCDC2 could attenuate the proliferation and epithelial-mesenchymal transition (EMT)-like processes of HSC. In vivo, exogenous DCDC2 could ameliorate CCl4-induced liver fibrosis. In summary, DCDC2 was remarkably downregulated in liver fibrotic tissues of both humans and mice, as well as in TGF-β1-activated HSC. DCDC2 inhibited the activation of HSC induced by TGF-β1 in vitro and fibrogenic changes in vivo, suggesting that it is a promising therapeutic target for liver fibrosis and warrants further investigation in clinical practice.
Keywords: DCDC2; Hepatic stellate cell activation; Liver fibrosis; Wnt/β-catenin signaling.
© 2024. The Author(s).
Conflict of interest statement
The authors declare no competing interests.
Figures


Similar articles
-
Oligo-peptide I-C-F-6 inhibits hepatic stellate cell activation and ameliorates CCl4-induced liver fibrosis by suppressing NF-κB signaling and Wnt/β-catenin signaling.J Pharmacol Sci. 2018 Mar;136(3):133-141. doi: 10.1016/j.jphs.2018.01.003. Epub 2018 Feb 2. J Pharmacol Sci. 2018. PMID: 29501581
-
Blockade of YAP alleviates hepatic fibrosis through accelerating apoptosis and reversion of activated hepatic stellate cells.Mol Immunol. 2019 Mar;107:29-40. doi: 10.1016/j.molimm.2019.01.004. Epub 2019 Jan 11. Mol Immunol. 2019. PMID: 30639476
-
Phillygenin Inhibits TGF-β1-induced Hepatic Stellate Cell Activation and Inflammation: Regulation of the Bax/Bcl-2 and Wnt/β-catenin Pathways.Inflammation. 2024 Aug;47(4):1403-1422. doi: 10.1007/s10753-024-01984-w. Epub 2024 Feb 23. Inflammation. 2024. PMID: 38393550
-
The involvement of the Wnt/β-catenin signaling cascade in fibrosis progression and its therapeutic targeting by relaxin.Biochem Pharmacol. 2024 May;223:116130. doi: 10.1016/j.bcp.2024.116130. Epub 2024 Mar 13. Biochem Pharmacol. 2024. PMID: 38490518 Review.
-
Exploring Fibrosis Pathophysiology in Lean and Obese Metabolic-Associated Fatty Liver Disease: An In-Depth Comparison.Int J Mol Sci. 2024 Jul 5;25(13):7405. doi: 10.3390/ijms25137405. Int J Mol Sci. 2024. PMID: 39000518 Free PMC article. Review.
Cited by
-
Liraglutide inhibits the proliferation of rat hepatic stellate cells under high glucose conditions by suppressing the ERK signaling pathway.Sci Rep. 2025 Apr 17;15(1):13360. doi: 10.1038/s41598-025-97872-w. Sci Rep. 2025. PMID: 40246983 Free PMC article.
-
Signaling pathways that activate hepatic stellate cells during liver fibrosis.Front Med (Lausanne). 2024 Sep 18;11:1454980. doi: 10.3389/fmed.2024.1454980. eCollection 2024. Front Med (Lausanne). 2024. PMID: 39359922 Free PMC article. Review.
References
Publication types
MeSH terms
Substances
Grants and funding
LinkOut - more resources
Full Text Sources
Medical
Molecular Biology Databases
Research Materials
