. 2024 Apr;628(8009):818-825.
doi: 10.1038/s41586-024-07310-6. Epub 2024 Apr 24.

Antisense oligonucleotide therapeutic approach for Timothy syndrome

Affiliations

Antisense oligonucleotide therapeutic approach for Timothy syndrome

Xiaoyu Chen et al. Nature. 2024 Apr.

Abstract

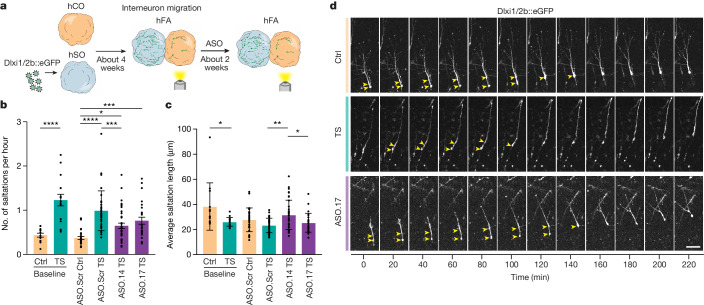
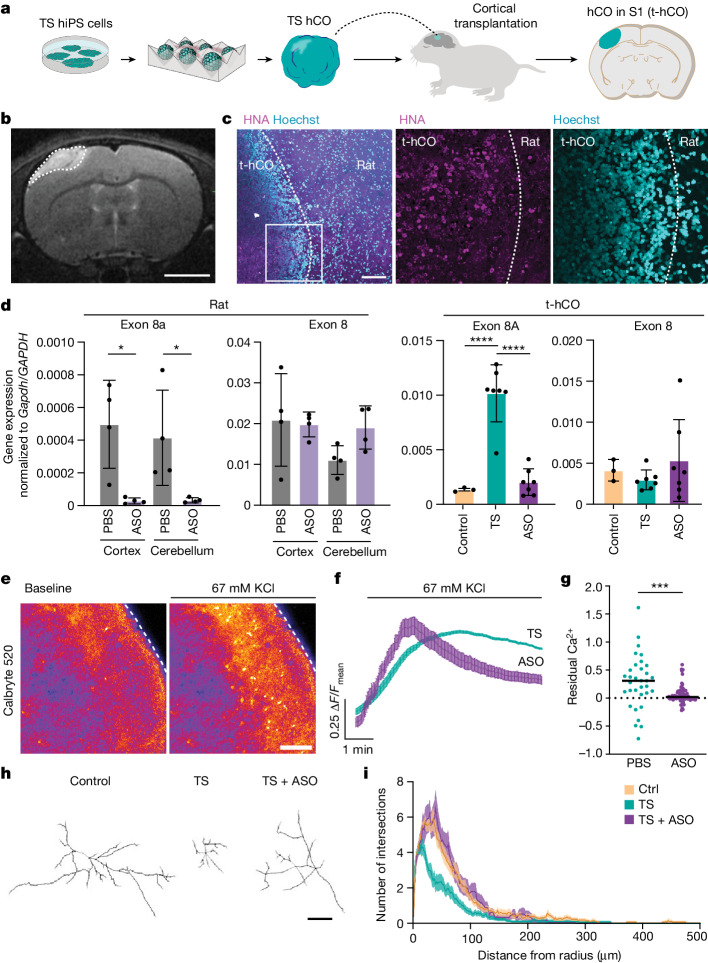
Timothy syndrome (TS) is a severe, multisystem disorder characterized by autism, epilepsy, long-QT syndrome and other neuropsychiatric conditions1. TS type 1 (TS1) is caused by a gain-of-function variant in the alternatively spliced and developmentally enriched CACNA1C exon 8A, as opposed to its counterpart exon 8. We previously uncovered several phenotypes in neurons derived from patients with TS1, including delayed channel inactivation, prolonged depolarization-induced calcium rise, impaired interneuron migration, activity-dependent dendrite retraction and an unanticipated persistent expression of exon 8A2-6. We reasoned that switching CACNA1C exon utilization from 8A to 8 would represent a potential therapeutic strategy. Here we developed antisense oligonucleotides (ASOs) to effectively decrease the inclusion of exon 8A in human cells both in vitro and, following transplantation, in vivo. We discovered that the ASO-mediated switch from exon 8A to 8 robustly rescued defects in patient-derived cortical organoids and migration in forebrain assembloids. Leveraging a transplantation platform previously developed7, we found that a single intrathecal ASO administration rescued calcium changes and in vivo dendrite retraction of patient neurons, suggesting that suppression of CACNA1C exon 8A expression is a potential treatment for TS1. Broadly, these experiments illustrate how a multilevel, in vivo and in vitro stem cell model-based approach can identify strategies to reverse disease-relevant neural pathophysiology.


Conflict of interest statement

Stanford University holds patents for the generation of cortical organoids/spheroids and assembloids (listing S.P.P., F.B. as inventors), a patent application for ASO (listing S.P.P., X.C. and F.B. as inventors) and a patent application for transplantation of organoids (listing S.P.P. and O.R. as inventors).

Figures

Fig. 1
Fig. 1. The TS G406R variant enhances inclusion of CACNA1C exon 8A in human neurons.
a, Schematics illustrating the TS pathogenic variant in the alternatively spliced exon 8A (left) and the resulting gain-of-function channel variant (right). The heterozygous G>A variant (black arrow) is located towards the 3′ end of exon 8A. b, Generation of hCO from control (Ctrl) and TS hiPS cells. c, Schematic of the RFLP assay. Left, PCR products amplified from hCO cDNA; the exon 8-containing amplicon is recognized by restriction enzyme BamHI; exon 8A, 8 and 7–9 amplicons have different molecular weights on agarose gel. Right, RFLP gel image of control and TS hCO at days 30, 60 and 90 of differentiation. Each column represents a hCO derived from different hiPS cell lines. L, ladder. d, Next-generation sequencing of amplicons generated from day 60 hCO. Left, PCR products were obtained using a forward primer targeting exon 7 and a reverse primer targeting exon 9; both primers have an Illumina adaptor at their 5′. Right, proportions of exon 8A WT, exon 8A TS, exon 8 and exons 7–9 are shown (n = 3 for WT hCO, n = 3 for TS hCO). Data presented as mean ± s.d. One-way analysis of variance (ANOVA) with Tukey’s post hoc test: for control hCO, F2,6 = 3.246, P = 0.1108; for TS hCO, F3,8 = 50.28, P < 0.0001. ****P < 0.0001, ***P < 0.001, **P < 0.01. e, Generation of minigene splicing reporters for exons 8 and 8A of CACNA1C. Left, experimental strategy for testing minisplicing reporters in HEK293T cells. Right, a CACNA1C DNA fragment (isolated from TS hiPS cells) was inserted into a pDup4-1backbone resulting in two vectors, pDup8-8A-WT and pDup8-8A-TS. bp, base pairs. Source Data
Fig. 2
Fig. 2. Screening of ASOs that can reduce exon 8A in favour of exon 8 CACNA1C isoforms in human neural cells.
a, ASO design. Arrow denotes the location of the TS variant. b, RT–qPCR of exons 8A and 8 in ASO-treated dissociated TS hCO differentiated for 152 days. hCO derived from n = 2 TS hiPS cell lines (nos. 9-2 and 8-3) were dissociated and plated. For both TS lines, 10 μM ASO was added to two separated wells resulting in a total of four data points. RNA extraction was carried out 3 days post-exposure. Data are mean + s.e.m. c, RT–qPCR analysis of exons 8A and 8 of ASO-treated hCO. Data are mean + s.d. Three TS hiPS cell lines were used (n = 3). One-way ANOVA with Tukey’s post hoc test: for exon 8A, F5,12 = 8.870, P = 0.0010, *P < 0.05, **P < 0.01; for exon 8, F5,12 = 0.6689, P = 0.6546. d, RFLP analysis from c. The size of corresponding amplicons is annotated (black arrowheads). e, Serial concentration dilutions of ASO.14 were used to evaluate dose-dependent splicing modulation on CACNA1C in hCO. ASO.14 was applied at differentiation day 30 (n = 3 individual hCO from three hiPS cell lines, left) and at day 90 (n = 4 individual hCO from two hiPS cell lines, right). Data presented as mean ± s.d. One-way ANOVA with Tukey’s post hoc test: day 30, F5,12 = 5.131, P = 0.0095; day 90, F5,18 = 36.81, P < 0.0001, ****P < 0.0001. f, Flow cytometry of hCO (day 152) following 2 days of incubation with 1 μM Cy5-ASO.14. hCO were dissociated and stained with neuronal cell surface protein CD90; non-treated hCO were used as control (Supplementary Fig. 1). Source Data
Fig. 3
Fig. 3. ASO exposure rescues delayed channel inactivation in TS cortical neurons.
a, Strategy used to evaluate the effect of ASO on human neurons. b, Representative traces of depolarization-induced calcium responses measured by Fura-2 imaging (control scramble (Scr), n = 55 cells; TS scramble, n = 31 cells; TS + ASO.14, n = 24 cells). Data presented as mean ± s.e.m. c, Residual calcium in ASO-treated neurons (days 100–120 of differentiation). Left, data pooled across hiPS cell lines; right, data separated by cell line. Each dot represents one cell (n = 2,017 cells); Kruskal–Wallis test, P < 0.0001. Control versus TS, ****P < 0.0001; TS versus ASO.14, ***P < 0.001; TS versus ASO.17, ****P < 0.0001; TS versus ASO.18, ****P < 0.0001. Data presented as mean ± s.e.m. DIC, differential interference contrast. d, Representative example of patch-clamp recordings from AAV-SYN1::eYFP-infected hCO neurons. Scale bar, 20 µm e, Representative examples of barium currents following 5 s depolarization steps (–70 to –25, –15 and –5 mV, respectively). f, Summary graph of barium current inactivation (percentage of inactivated current compared with amplitude of peak current at 2 s) for maximal current. Ctrl Scr, n = 14 cells from two lines; TS Scr, n = 22 cells from two lines; TS ASO.17, n = 14 cells from two lines; TS ASO.14, n = 10 cells from one line. Data presented as mean ± s.d. One-way ANOVA with Tukey’s post hoc test, F3,56 = 25.34, P < 0.0001, ****P < 0.0001. Source Data
Fig. 4
Fig. 4. ASO exposure rescues delayed migration defects in TS hFA.
a, Strategy used to test the effect of ASO on interneuron migration using hFA. Preceding fusion of hSO and hCO, hSO were infected with cortical interneuron reporter Lenti-Dlxi1/2b::eGFP around day 40. Imaging was performed at 4 weeks following assembly and again at 2 weeks post ASO incubation. b, Saltation frequency of Dlxi1/2b::eGFP+ migrating cortical interneurons in hFA. Pre ASO exposure, n = 13 Ctrl cells and n = 16 TS cells; post ASO exposure, n = 30 Ctrl ASO.Scr, n = 37 TS ASO.Scr, n = 38 TS ASO.14 and n = 26 TS ASO.17 cells. Data presented as mean ± s.d. One-way ANOVA with Tukey’s post hoc test for post-ASO exposure groups, F3,125 = 14.03, P < 0.0001, ****P < 0.0001, ***P = 0.0009, *P = 0.0177. Two-tailed unpaired t-test with Welch’s correction was used to compare baseline control and TS, ****P < 0.0001. c, Saltation length of Dlxi1/2b::eGFP+ migrating cortical interneurons in hFA. Data presented as mean ± s.d. One-way ANOVA with Tukey’s post hoc test for post-ASO exposure groups, F3,125 = 5.648, P = 0.0012, **P = 0.0007, *P = 0.0376. Two-tailed unpaired t-test with Welch’s correction was used to compare baseline control and TS, *P = 0.0386. d, Representative images of saltatory movement (yellow arrowheads) of Dlxi1/2b::eGFP+ migrating cortical interneurons; scale bar, 50 μm. Source Data
Fig. 5
Fig. 5. ASO delivery in vivo rescues TS-related phenotypes in transplanted human TS cells.
a, Schematic illustrating transplantation of hCO (t-hCO) into rat somatosensory cortex. b, Representative MRI showing t-hCO (scale bar, 4 mm). c, Immunostaining in t-hCO for the human-specific marker HNA (scale bar, 2 mm). d, RT–qPCR analysis of t-hCO (days 162–258) and rat neural tissue following ASO injection. Data presented as mean ± s.d. Left, exons 8A and 8 of rat Cacna1c in cerebral cortex and cerebellum (n = 4 animals per group); two-sided unpaired student’s t-tests were used to compare ASO versus PBS in cortex (P = 0.0129) and ASO versus PBS in cerebellum (P = 0.0382). Right, exons 8A and 8 of human CACNA1C (Ctrl, n = 4; TS, n = 7; TS + ASO, n = 7; t-hCO. each point represents either qPCR or average qPCR value from t-hCO from the same animal. The same t-hCO samples were also used for the RFLP assay shown in Extended Data Fig. 10a). One-way ANOVA with Tukey’s post hoc test: for exon 8A, F2,14 = 40.40, P < 0.0001, ****P < 0.0001; for exon 8, F2,14 = 0.8211, P = 0.4601. e, Calbryte 520-based calcium imaging of t-hCO. Slices of t-hCO were incubated with the dye for 1 h and then imaged on a confocal microscope before and after stimulation by 67 mM KCl; scale bar, 100 μm. f, Representative traces of responses to Calbryte 520 imaging. g, Residual calcium in Calbryte 250-based imaging of t-hCO (PBS treated, n = 33; ASO.14, n = 77; Mann–Whitney test, two-tailed, ***P = 0.0002). h, Representative images of cell morphology tracing with Golgi staining; scale bar, 50 μm. i, Sholl analysis of Ctrl, TS and TS + ASO neurons in t-hCO (n = 24 Ctrl t-hCO neurons, n = 24 TS t-CO neurons, n = 11 TS + ASO t-hCO neurons). Data presented as mean ± s.e.m. Source Data
Extended Data Fig. 1
Extended Data Fig. 1. The TS variant causes abnormal splicing of CACNA1C in human neurons in vitro.
a. RT-qPCR analysis of the exon 8A (left) and exon 8 (right) of CACNA1C during hCO differentiation. Data are shown as mean ± s.d. Dots represent individual samples collected from different differentiations and different hiPS cell lines (day 30: n = 9 Ctrl and n = 8 TS; day 60: n = 3 Ctrl and n = 6 TS; day 90: n = 14 Ctrl and n = 12 TS). One-way ANOVA with Bonferroni test: exon 8A, F5, 49 = 29.05, P < 0.0001, TS vs Ctrl, day 30, P > 0.9999; day 60, ****P < 0.0001; day 90, ***P = 0.0009. exon 8, F5, 49 = 10.32,P < 0.0001, TS vs. Ctrl, day 30, P > 0.9999; day 60, P = 0.6449; day 90, **P = 0.0098. b. Next-generation sequencing of the amplicons generated from day 60 hCO. The PCR products were obtained using a forward primer targeting exon 7 and a reverse primer targeting exon 9 (both primers have an Illumina adapter at their 5’). c. Sequencing validation of the minigene splicing reporter vectors. The c.1216 G > A TS variant is annotated in red. d. Schematic illustrating possible splicing outcomes from splicing reporters pDup8-8aWT and. pDup8-8aTS. e. Sequencing of the amplicons generated from the cDNA of transfected HEK293T cells (n = 4; Data are presented as mean ± s.d. One-way ANOVA with Tukey’s post hoc test: F7,24 = 2295, P < 0.0001, ****P < 0.0001). Source Data
Extended Data Fig. 2
Extended Data Fig. 2. CACNA1C splicing and the role of PTBP1.
a. qPCR of exon 8A and exon 8 in human cerebral cortex at postconceptional week 21 and 22 (n = 2 samples), and postnatal frontal cerebral cortex at age of 3 and 18 years (n = 2 samples). Data are presented as mean ± s.e.m. Each dot represents a piece of tissue individually processed for RNA. Statistical analysis was not performed. b. Exon 8A (hum.12879.s20) and exon 8 (hum.12879.s18) splicing patterns across developmental stages in human forebrain and cerebellum. Data from Evo-devo Alternative Splicing: https://apps.kaessmannlab.org/alternative-splicing (ref. ). c. PTBP1 gene expression during differentiation of hCO (left) and in BrainSpan. Data plotted from: http://solo.bmap.ucla.edu/shiny/GECO/. The vertical bar indicates birth. Shaded areas represent 95% confidence intervals and vertical gray areas denote the prenatal to postnatal transition (ref. ). d. Experimental strategy to explore the role of PTBP1 in exon 8/8A splicing. pDup8-8A-WT and pDup8-8A-TS were transfected either with or without the PTBP1-encoding plasmid. RNA was extracted at 3 days post transfection and cDNA was amplified and loaded onto a 2% agarose gel. e. Gel image of the PCR product amplifying the cDNA from the transfected mini-splicing reporters and PTBP1. RNA was extracted at 3 days post-transfection and cDNA was amplified and loaded onto a 2% agarose gel. f. Next generation sequencing of the amplicons generated from the cDNA of transfected HEK293T cells (n = 3 independent experiments). Data are presented as mean ± s.d. One-way ANOVA with multiple comparisons between conditions with PTBP1 or without PTBP1. For pDup8-8A-WT, F5,12 = 48.56, P < 0.0001, ****P < 0.0001, ***P = 0.0002. For pDup8-8A-TS, F5,12 = 10599, P < 0.0001, ****P < 0.0001. Source Data
Extended Data Fig. 3
Extended Data Fig. 3. ASOs modulate CACNA1C splicing in human neurons.
a. Amplicon sequencing of the ASO-treated hCO (differentiation day 60, 10 μM ASO). Left: percent of PCR products. Right: data from the left panel separated by TS lines. b. RFLP of ASOs-treated hCO for 15 days (upper) and 30 days (lower). c. RT-qPCR of exon 8A (differentiation day 30, 1 μM ASO, n = 3). One-way ANOVA with Tukey’s post hoc test: F4,10 = 18.59, P = 0.0001, ***P < 0.0001. d. qPCR of exon 8A and 8 (1 μM ASO). (n = 6 for day 30 ASO.14; n = 12 for day 60 ASO.14; n = 10 for day 90 ASO.14; n = 6 for TS ASO.Scr; n = 5 for non-TS ASO.Scr.) One-way ANOVA with Tukey’s post hoc test: for exon 8A, F4, 34 = 27.91, P < 0.0001; **** P < 0.0001; for exon 8, F4, 34 = 0.4948, P = 0.7396. e. RT-qPCR of exon 8A (left) and exon 8 (right) (1 μM ASO, n = 3). One-way ANOVA with Tukey’s post hoc test: for exon 8A, F5,12 = 18.96, P < 0.0001, ****P < 0.0001, ***P = 0.0001; for exon 8, F5, 12 = 3.654, P = 0.0306, *P < 0.05. f. RT-qPCR of exon 8A (differentiation day 75, 1 μM ASO) (n = 3 for TS and TS ASO except for ASO.17 1 μM where n = 2 and this was not included in the comparison, n = 6 for non-TS control). One-way ANOVA with Dunnett’s correction: for ASO.17, F5,15 = 10.33, P = 0.0002; **P < 0.005, ***P ≤ 0.0005; for ASO.18, F6,17 = 7.900, P = 0.0004; **P < 0.005. g. qPCR of exon 8A (differentiation day 74, 1 μM) (n = 3 for ASO.17, n = 4 for ASO.18, n = 6 for non-TS control). One-way ANOVA with Tukey’s post hoc test to compare ASO.17 and ASO.18 to ASO.Scr: F11,32 = 9.775, P < 0.0001; ****P < 0.0001. Each dot represents an individual hCO from a different hiPS cell line for c-g. Data are presented as mean ± s.d. for c-g. Source Data
Extended Data Fig. 4
Extended Data Fig. 4. Western blot of human CaV1.2 in ASO-treated hCO.
a. Western blot of hCO treated with ASO.14, ASO.17, ASO.18 or ASO.Scr (differentiation day 70-80). b. CaV1.2 protein blot normalized to GAPDH. Each dot represents an individual sample containing 2–3 hCO from an independent experiment (Ctrl: n = 8; TS Scr: n = 8; TS ASO.14: n = 6; TS ASO.17: n = 6; TS ASO.18: n = 6). Data are presented as mean ± s.d. One-way ANOVA with Tukey’s post hoc test: F4,31 = 0.3548, P = 0.8387. c. Raw images of the western blots corresponding to ab. Source Data
Extended Data Fig. 5
Extended Data Fig. 5. Cy5-labeled ASO in hCO.
a. CTIP2 and SATB2 immunostaining in hCO (differentiation day 210) dissociated and cultured in 2D. Cy5-ASO.14 was added to the 2D culture for 3 days before immunostaining. b. RT-qPCR analysis of exon 8A and exon 8 from TS hCO that were incubated with ASOs for 3 days. n = 3 hCO derived from 3 TS hiPS cells. Data are presented as mean ± s.d. One-way ANOVA with Tukey’s post hoc test: for exon 8A, F4,10 = 18.66, P = 0.0001, ***P < 0.001, **P < 0.01; for exon 8, F4, 10 = 1.370, P = 0.3117. Source Data
Extended Data Fig. 6
Extended Data Fig. 6. ASO toxicity and off-target effects.
a. TUNEL staining (red) in dissociated TS neurons exposed to ASOs for 2 days. hCO derived from 3 TS lines (differentiation day 210) were used. Hoechst (blue) stains DNA. DNase treatment was used as a positive control (scale bar 50 μm). b. Percentage of TUNEL+ cells from 6a. Each dot represents the averaged percentage of TUNEL+ cells on multiple images from one coverslip. Three TS lines were used (n = 3). F3,20 = 13.13, P < 0.0001; ****P < 0.0001, **P = 0.0033. c. Immunocytochemistry of cleaved caspase 3 (c-Cas3) in dissociated TS neurons (differentiation day 210) exposed to ASOs for 2 days (n = 3 TS lines; scale bar 50 μm). d. Percentage of c-Cas3+ cells. Each dot represents the average percentage of c-Cas3 from multiple images taken from one coverslip (n = 3 TS lines). F2,6 = 0.03288, P = 0.9678. e. Human TLR9 reporter HEK 293 cells assay to measure NF-κB-dependent TLR9 signaling. The hTLR9 ligand ODN was used as a positive control. Three independent experiments were performed. Two-way ANOVA: F4,48 = 379.1, P < 0.0001; ****P < 0.0001. f. qPCR of CACNA1D, USP28, TEME105 and DGKK to evaluate off target effects. hCO were exposed to 1 μM ASOs for 3 days (n = 3 TS lines and 3 control lines). For CACNA1D, F4,10 = 0.2715, P = 0.8897; for USP28, F4,10 = 0.5381, P = 0.7114; for DGKK, F4,10 = 0.4405, P = 0.7769; for TEME105, F4,10 = 1.012, P = 0.4461. Data are presented as mean ± s.d. in b, d-f. One-way ANOVA with Tukey’s post hoc test for b, d and f. Source Data
Extended Data Fig. 7
Extended Data Fig. 7. Impact of different CACNA1C isoform ratios on calcium signaling and threshold estimates for ASO rescue.
a. Experimental design. Each condition contains a mix of two plasmids encoding either the WT or the TS CaV1.2 that are co-transfected with plasmids encoding the β1b, α2δ subunit of the channel plus GCaMP6-x. b. Representative images of GCaMP imaging before and after 67 mM KCl application. Transfected cells contain only WT CaV1.2 (upper panel) or only TS CaV1.2 (lower panel). Scale bar 100 μm. c. Representative traces of chemically induced intracellular GCaMP signal. (0% TS + 100% WT, n = 257 cells; 2.5% TS + 97.5% WT, n = 388 cells; 7.5% TS + 92.5% WT, n = 335 cells; 17.5% TS + 82.5% WT, n = 325 cells; 100% TS + 0% WT, n = 190 cells). Data are presented as mean ± s.e.m. d. Comparison of residual Ca2+ measured after 67 mM KCl application. Each dot represents one cell (n = 11,228 cells). One-way ANOVA with Dunnett’s correction was used was used to compare TS CaV1.2 to WT: F11, 11266 = 68.73, P < 0.0001, ****P < 0.0001. e. Experimental procedure for evaluating rescue by ASOs at various concentrations. f. Representative images of GCaMP6f imaging acquired before and after 67 mM KCl application to control (upper panel) and TS neurons (lower panel) neurons. Control and TS neurons are derived from isogenic hiPS cells (242 to 254 days of differentiation). Scale bar 50 μm. g. Comparison of residual Ca2+ measured by GCaMP6f after 67 mM KCl exposure. Each dot represents one cell (n = 1,527 cells). One-way ANOVA with Dunnett’s correction was used to compare ASO.14, ASO.17 and ASO.18 to TS ASO.Scr: F13, 1513 = 20.45, P < 0.0001; ****P < 0.0001. Source Data
Extended Data Fig. 8
Extended Data Fig. 8. Patch-clamp of ASO-treated TS and control neurons.
a. I-V curves of barium current amplitudes recorded from hCO neurons. I-V curves were fitted with Boltzmann exponential functions (Ctrl scramble, n = 11 cells; TS scramble, n = 15 cells, TS + ASO, n = 13 cells). Data are mean ± s.e.m. A mixed-effects model with the Geisser-Greenhouse correction was used for comparison among groups: F2,36 = 1.021, P = 0.3706. b. Upper: representative traces of barium currents in 3-second-long pre-pulse depolarization to –100 mV, –70 mV, –20 mV and 0 mV followed by 3-second-long test pulse depolarization to 0 mV. Lower: representative traces of barium currents in the test pulse depolarizations after pre-pulse depolarization. c. Voltage dependence of barium current inactivation with a test pulse to 0 mV after a series of pre-pulses from –110 mV to +40 mV with an increment of 10 mV. d. Voltage-dependent inactivation curves of Ctrl and TS + ASO were fitted with exponential functions (Ctrl Scr: n = 14 cells from 2 hiPS cell lines; TS Scr: n = 15 cells from 2 hiPS cell lines; TS ASO.17: n = 6 cells and TS ASO.14: n = 6 cells from 2 hiPS cell lines). Data are presented as mean ± s.e.m. A mixed-effects model with the Geisser-Greenhouse correction was used for comparison among groups: F2,38 = 16.42, P < 0.0001. Turkey’s multiple comparisons test was used for comparison between TS and TS + ASO groups. *P = 0.0132, ***P < 0.001, ****P < 0.0001. Source Data
Extended Data Fig. 9
Extended Data Fig. 9. ASO delivery and effectiveness in rats that contain no t-hCO.
a. Sequence alignment between exon 8a of rat Cacna1c and exon 8A of human CACNA1C. Red boxes indicate mismatched nucleotides. b. Schematic showing injection of 80 μg ASO.14 into the rat cisterna magna. Rat brain, cerebellum and spinal cord were collected 5 days post-injection. c. RT-qPCR analysis of rat Cacna1c exon 8a and exon 8 after ASO injection (n = 2 animals; for each sample, 2 pieces of adjacent tissue (technical replicates) were collected for each brain region: cortex, cerebellum and spinal cord). Data are presented as mean ± s.d. Source Data
Extended Data Fig. 10
Extended Data Fig. 10. Effect of in vivo ASO administration on dendrite morphology in TS.
a. RFLP analysis of t-hCO. Upper panel: n = 3 control, n = 4 TS, n = 4 for TS + ASO t-hCO. Lower panel: n = 3 t-hCO per group. The two gel columns for each conditions represent two pieces cut from same t-hCO. The same t-hCO were used for qPCR shown in Fig. 5d. b. Western blot of t-hCO treated with ASO.14 or PBS. Data are presented as mean ± s.d. n = 3 individual t-hCO extracted from the rat cortex. One-way ANOVA with Tukey’s post hoc test: F2,6 = 0.07231, P = 0.9310. Gel source data is shown in Supplementary Fig. 2. c. Representative images of cell morphology tracing using Golgi staining. d. Analysis of area under the curve (n = 24 control t-hCO neurons, n = 24 TS t-CO neurons, n = 11 TS + ASO t-hCO neurons). F2,56 = 8.134, P = 0.0008; **P = 0.0012. e. Quantification of intersection peak radius (n = 24 control t-hCO neurons, n = 24 TS t-CO neurons, n = 11 TS + ASO t-hCO neurons). F2,56 = 8.225, P = 0.0007; **P = 0.0013. f. Comparison of the longest dendrite length among groups (n = 24 control t-hCO neurons, n = 24 TS t-CO neurons, n = 11 TS ASO t-hCO neurons). F2,56 = 3.266, P = 0.0455; *P = 0.0352. g. Comparison of total dendrite length among groups (n = 24 control t-hCO neurons, n = 24 TS t-CO neurons, n = 11 TS + ASO t-hCO neurons). F2,56 = 7.826, P = 0.0010; **P = 0.0017. For d-g, Data are presented as mean ± s.d. and one-way ANOVA with Dunnett’s correction was used. Source Data

Comment in

  • ASO to treat Timothy syndrome.
    Crunkhorn S. Crunkhorn S. Nat Rev Drug Discov. 2024 Jun;23(6):420. doi: 10.1038/d41573-024-00075-7. Nat Rev Drug Discov. 2024. PMID: 38714847 No abstract available.

References

    1. Splawski, I. et al. Severe arrhythmia disorder caused by cardiac L-type calcium channel mutations. Proc. Natl Acad. Sci. USA102, 8089–8096 (2005). 10.1073/pnas.0502506102 - DOI - PMC - PubMed
    1. Paşca, S. P. et al. Using iPSC-derived neurons to uncover cellular phenotypes associated with Timothy syndrome. Nat. Med.17, 1657–1662 (2011). 10.1038/nm.2576 - DOI - PMC - PubMed
    1. Birey, F. et al. Assembly of functionally integrated human forebrain spheroids. Nature545, 54–59 (2017). 10.1038/nature22330 - DOI - PMC - PubMed
    1. Birey, F. et al. Dissecting the molecular basis of human interneuron migration in forebrain assembloids from Timothy syndrome. Cell Stem Cell29, 248–264 (2022). 10.1016/j.stem.2021.11.011 - DOI - PubMed
    1. Krey, J. F. et al. Timothy syndrome is associated with activity-dependent dendritic retraction in rodent and human neurons. Nat. Neurosci.16, 201–209 (2013). 10.1038/nn.3307 - DOI - PMC - PubMed

Publication types

MeSH terms

Supplementary concepts