. 2024 May;629(8013):843-850.
doi: 10.1038/s41586-024-07324-0. Epub 2024 Apr 24.

Phylogenomics and the rise of the angiosperms

Alexandre R Zuntini #  1 Tom Carruthers #  1 Olivier Maurin  1 Paul C Bailey  1 Kevin Leempoel  1 Grace E Brewer  1 Niroshini Epitawalage  1 Elaine Françoso  1   2 Berta Gallego-Paramo  1 Catherine McGinnie  1 Raquel Negrão  1 Shyamali R Roy  1 Lalita Simpson  3 Eduardo Toledo Romero  1 Vanessa M A Barber  1 Laura Botigué  4 James J Clarkson  1 Robyn S Cowan  1 Steven Dodsworth  5 Matthew G Johnson  6 Jan T Kim  7 Lisa Pokorny  1   8 Norman J Wickett  9 Guilherme M Antar  10   11 Lucinda DeBolt  12 Karime Gutierrez  12 Kasper P Hendriks  13   14 Alina Hoewener  15 Ai-Qun Hu  1 Elizabeth M Joyce  3   16 Izai A B S Kikuchi  17 Isabel Larridon  1 Drew A Larson  18 Elton John de Lírio  10 Jing-Xia Liu  19 Panagiota Malakasi  1 Natalia A S Przelomska  1   5 Toral Shah  1 Juan Viruel  1 Theodore R Allnutt  20 Gabriel K Ameka  21 Rose L Andrew  22 Marc S Appelhans  23 Montserrat Arista  24 María Jesús Ariza  25 Juan Arroyo  24 Watchara Arthan  1 Julien B Bachelier  26 C Donovan Bailey  27 Helen F Barnes  20 Matthew D Barrett  3 Russell L Barrett  28 Randall J Bayer  29 Michael J Bayly  30 Ed Biffin  31 Nicky Biggs  1 Joanne L Birch  30 Diego Bogarín  14   32 Renata Borosova  1 Alexander M C Bowles  33 Peter C Boyce  34 Gemma L C Bramley  1 Marie Briggs  1 Linda Broadhurst  35 Gillian K Brown  36 Jeremy J Bruhl  22 Anne Bruneau  37 Sven Buerki  38 Edie Burns  1 Margaret Byrne  39 Stuart Cable  1 Ainsley Calladine  31 Martin W Callmander  40 Ángela Cano  41 David J Cantrill  20 Warren M Cardinal-McTeague  42 Mónica M Carlsen  43 Abigail J A Carruthers  1 Alejandra de Castro Mateo  24 Mark W Chase  1   44 Lars W Chatrou  45 Martin Cheek  1 Shilin Chen  46   47 Maarten J M Christenhusz  1   48   49 Pascal-Antoine Christin  50 Mark A Clements  35 Skye C Coffey  51 John G Conran  52 Xavier Cornejo  53 Thomas L P Couvreur  54 Ian D Cowie  55 Laszlo Csiba  1 Iain Darbyshire  1 Gerrit Davidse  43 Nina M J Davies  1 Aaron P Davis  1 Kor-Jent van Dijk  56 Stephen R Downie  57 Marco F Duretto  28 Melvin R Duvall  58 Sara L Edwards  1 Urs Eggli  59 Roy H J Erkens  14   60   61 Marcial Escudero  24 Manuel de la Estrella  62 Federico Fabriani  45 Michael F Fay  1 Paola de L Ferreira  63   64 Sarah Z Ficinski  1 Rachael M Fowler  30 Sue Frisby  1 Lin Fu  65 Tim Fulcher  1 Mercè Galbany-Casals  66 Elliot M Gardner  67 Dmitry A German  68 Augusto Giaretta  69 Marc Gibernau  70 Lynn J Gillespie  71 Cynthia C González  72 David J Goyder  1 Sean W Graham  17 Aurélie Grall  1 Laura Green  1 Bee F Gunn  20 Diego G Gutiérrez  73 Jan Hackel  1   74 Thomas Haevermans  75 Anna Haigh  1 Jocelyn C Hall  76 Tony Hall  1 Melissa J Harrison  3 Sebastian A Hatt  1 Oriane Hidalgo  77 Trevor R Hodkinson  78 Gareth D Holmes  20 Helen C F Hopkins  1 Christopher J Jackson  20 Shelley A James  51 Richard W Jobson  28 Gudrun Kadereit  79 Imalka M Kahandawala  1 Kent Kainulainen  80 Masahiro Kato  81 Elizabeth A Kellogg  82 Graham J King  83 Beata Klejevskaja  84 Bente B Klitgaard  1 Ronell R Klopper  85   86 Sandra Knapp  87 Marcus A Koch  88 James H Leebens-Mack  89 Frederic Lens  14 Christine J Leon  1 Étienne Léveillé-Bourret  90 Gwilym P Lewis  1 De-Zhu Li  19 Lan Li  91 Sigrid Liede-Schumann  92 Tatyana Livshultz  93   94 David Lorence  95 Meng Lu  1 Patricia Lu-Irving  28 Jaquelini Luber  96 Eve J Lucas  1 Manuel Luján  1 Mabel Lum  97 Terry D Macfarlane  51 Carlos Magdalena  1 Vidal F Mansano  96 Lizo E Masters  1 Simon J Mayo  1 Kristina McColl  28 Angela J McDonnell  98 Andrew E McDougall  56 Todd G B McLay  20 Hannah McPherson  28 Rosa I Meneses  99 Vincent S F T Merckx  14 Fabián A Michelangeli  100 John D Mitchell  100 Alexandre K Monro  1 Michael J Moore  101 Taryn L Mueller  102 Klaus Mummenhoff  13 Jérôme Munzinger  103 Priscilla Muriel  104 Daniel J Murphy  20 Katharina Nargar  3   35 Lars Nauheimer  3 Francis J Nge  31 Reto Nyffeler  105 Andrés Orejuela  106   107 Edgardo M Ortiz  15 Luis Palazzesi  73 Ariane Luna Peixoto  96 Susan K Pell  108 Jaume Pellicer  77 Darin S Penneys  109 Oscar A Perez-Escobar  1 Claes Persson  110 Marc Pignal  75 Yohan Pillon  111 José R Pirani  10 Gregory M Plunkett  100 Robyn F Powell  1 Ghillean T Prance  1 Carmen Puglisi  1   43 Ming Qin  65 Richard K Rabeler  18 Paul E J Rees  1 Matthew Renner  28 Eric H Roalson  112 Michele Rodda  113 Zachary S Rogers  114 Saba Rokni  1 Rolf Rutishauser  105 Miguel F de Salas  115 Hanno Schaefer  15 Rowan J Schley  116 Alexander Schmidt-Lebuhn  35 Alison Shapcott  117 Ihsan Al-Shehbaz  43 Kelly A Shepherd  51 Mark P Simmons  118 André O Simões  119 Ana Rita G Simões  1 Michelle Siros  1   120 Eric C Smidt  121 James F Smith  38 Neil Snow  122 Douglas E Soltis  123 Pamela S Soltis  123 Robert J Soreng  124 Cynthia A Sothers  1 Julian R Starr  125 Peter F Stevens  43 Shannon C K Straub  126 Lena Struwe  127 Jennifer M Taylor  91 Ian R H Telford  22 Andrew H Thornhill  22   31   52 Ifeanna Tooth  28 Anna Trias-Blasi  1 Frank Udovicic  20 Timothy M A Utteridge  1 Jose C Del Valle  24 G Anthony Verboom  128 Helen P Vonow  31 Maria S Vorontsova  1 Jurriaan M de Vos  129 Noor Al-Wattar  1 Michelle Waycott  31   52 Cassiano A D Welker  130 Adam J White  131 Jan J Wieringa  14 Luis T Williamson  56 Trevor C Wilson  28 Sin Yeng Wong  132 Lisa A Woods  28 Roseina Woods  1 Stuart Worboys  3 Martin Xanthos  1 Ya Yang  133 Yu-Xiao Zhang  134 Meng-Yuan Zhou  19 Sue Zmarzty  1 Fernando O Zuloaga  135 Alexandre Antonelli  1   110   136   137 Sidonie Bellot  1 Darren M Crayn  3 Olwen M Grace  1   106 Paul J Kersey  1 Ilia J Leitch  1 Hervé Sauquet  28 Stephen A Smith  18 Wolf L Eiserhardt  1   64 Félix Forest  1 William J Baker  138   139
Affiliations

Phylogenomics and the rise of the angiosperms

Alexandre R Zuntini et al. Nature. 2024 May.

Abstract

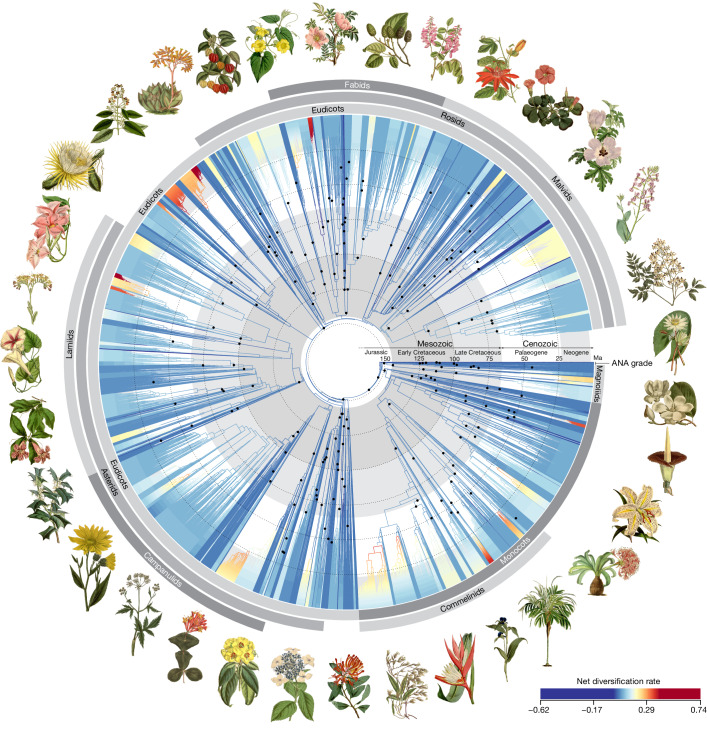
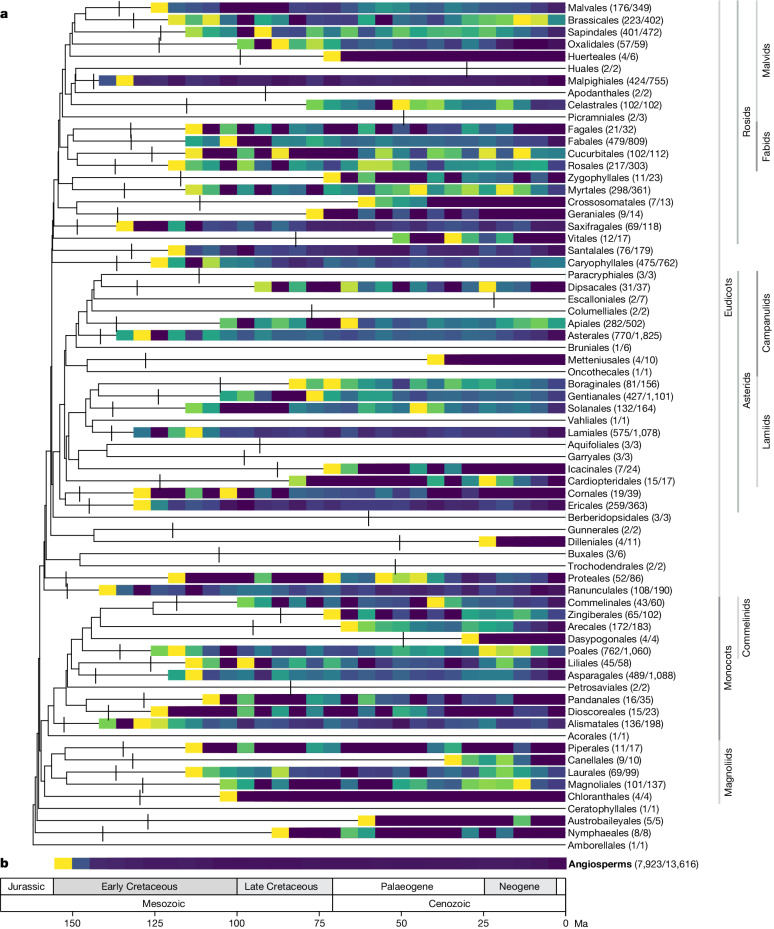
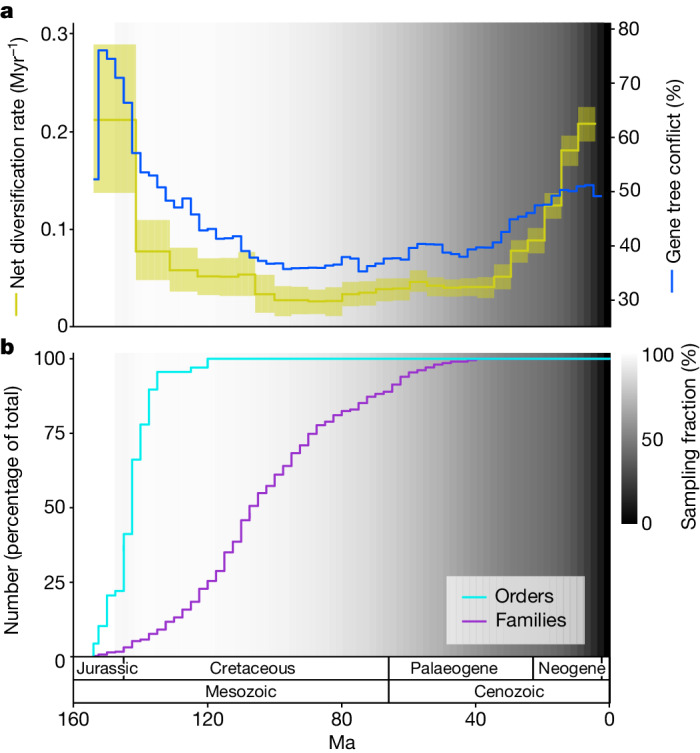
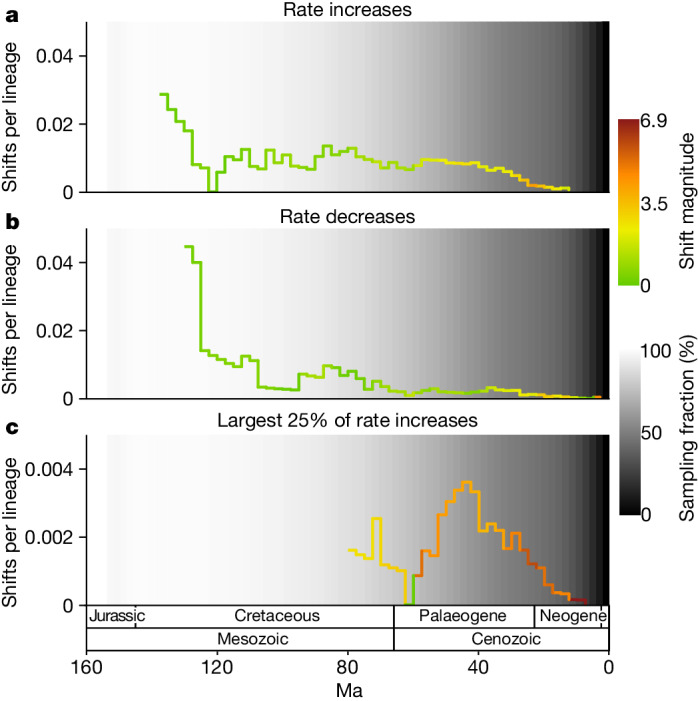
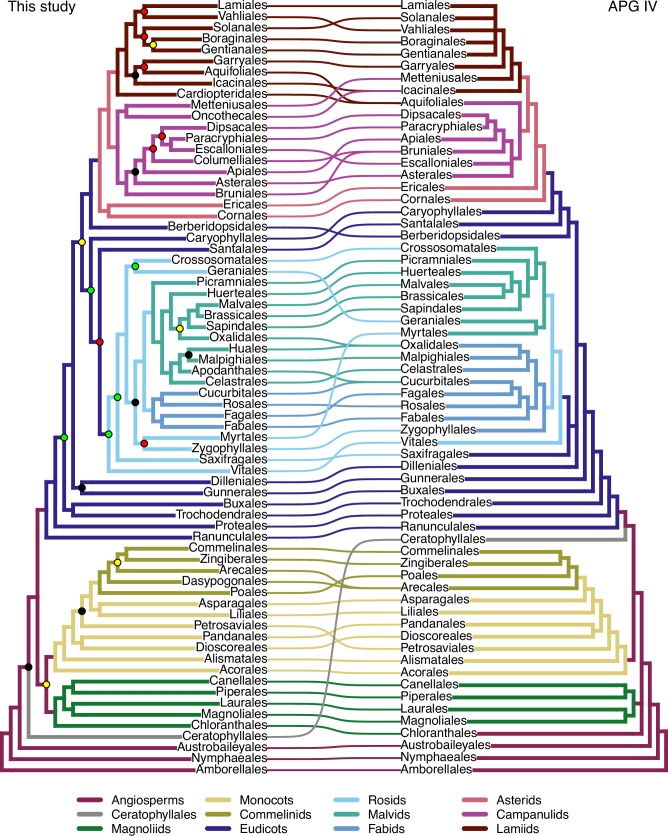
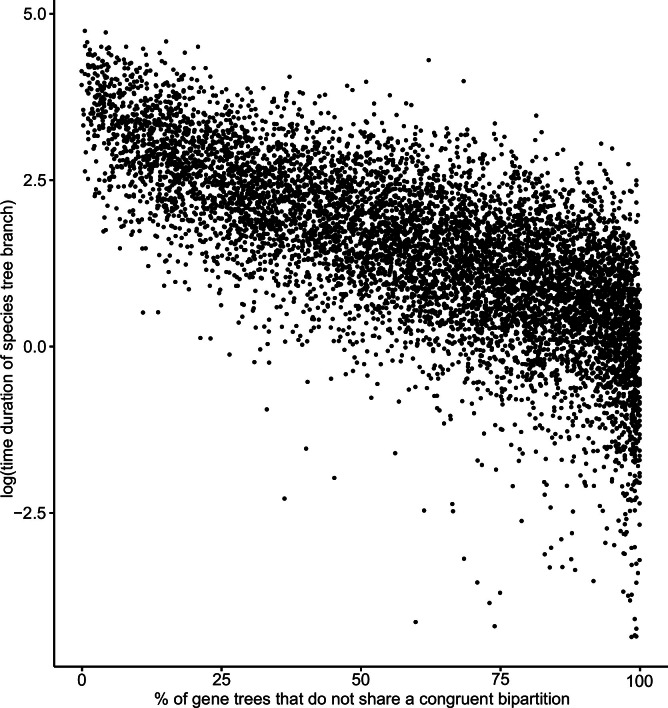
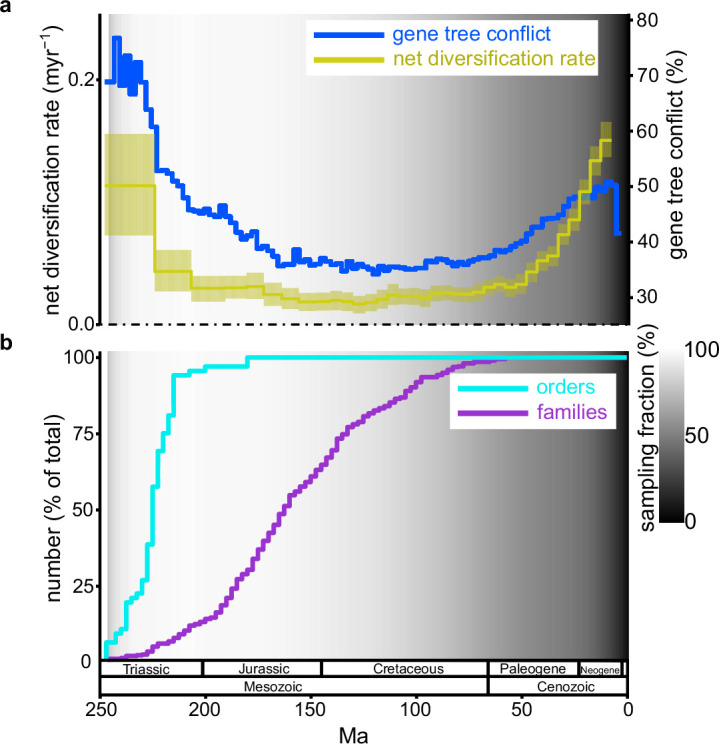
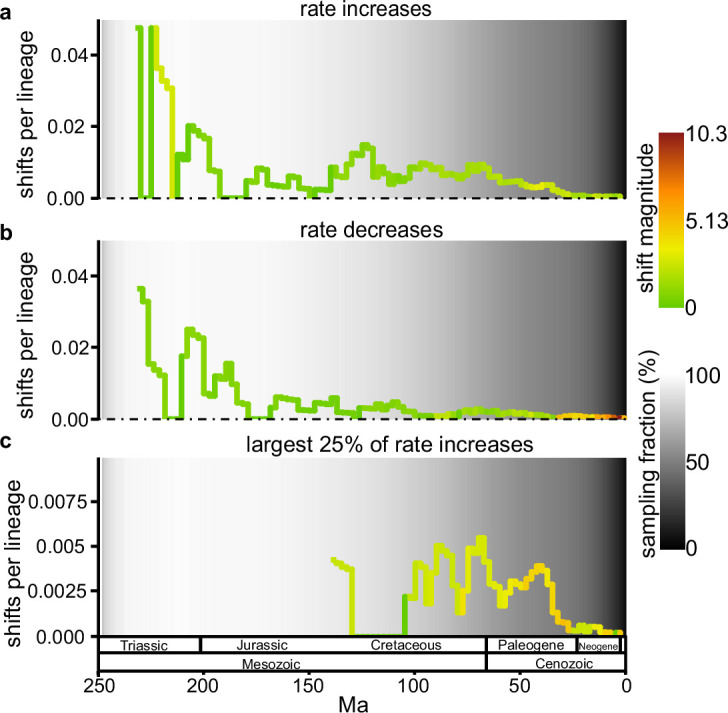
Angiosperms are the cornerstone of most terrestrial ecosystems and human livelihoods1,2. A robust understanding of angiosperm evolution is required to explain their rise to ecological dominance. So far, the angiosperm tree of life has been determined primarily by means of analyses of the plastid genome3,4. Many studies have drawn on this foundational work, such as classification and first insights into angiosperm diversification since their Mesozoic origins5-7. However, the limited and biased sampling of both taxa and genomes undermines confidence in the tree and its implications. Here, we build the tree of life for almost 8,000 (about 60%) angiosperm genera using a standardized set of 353 nuclear genes8. This 15-fold increase in genus-level sampling relative to comparable nuclear studies9 provides a critical test of earlier results and brings notable change to key groups, especially in rosids, while substantiating many previously predicted relationships. Scaling this tree to time using 200 fossils, we discovered that early angiosperm evolution was characterized by high gene tree conflict and explosive diversification, giving rise to more than 80% of extant angiosperm orders. Steady diversification ensued through the remaining Mesozoic Era until rates resurged in the Cenozoic Era, concurrent with decreasing global temperatures and tightly linked with gene tree conflict. Taken together, our extensive sampling combined with advanced phylogenomic methods shows the deep history and full complexity in the evolution of a megadiverse clade.


Conflict of interest statement

The authors declare no competing interests.

Figures

Fig. 1
Fig. 1. Time-calibrated phylogenetic tree for angiosperms based on 353 nuclear genes.
All 64 orders, all 416 families and 58% (7,923) of genera are represented. The young tree is illustrated here (maximum constraint at the root node of 154 Ma), with branch colours representing net diversification rates. Black dots at nodes indicate the phylogenetic placement of fossil calibrations based on the updated AngioCal fossil calibration dataset. Note that calibrated nodes can be older than the age of the corresponding fossils owing to the use of minimum age constraints. Arcs around the tree indicate the main clades of angiosperms as circumscribed in this paper. ANA grade refers to the three consecutively diverging orders Amborellales, Nymphaeales and Austrobaileyales. Plant portraits illustrating key orders were sourced from Curtis’s Botanical Magazine (Biodiversity Heritage Library). These portraits, by S. Edwards, W. H. Fitch, W. J. Hooker, J. McNab and M. Smith, were first published between 1804 and 1916 (for a key to illustrations see Supplementary Table 2). A high-resolution version of this figure can be downloaded from 10.5281/zenodo.10778206 (ref. ).
Fig. 2
Fig. 2. Diversification dynamics across angiosperms.
The results illustrated are based on the young tree (maximum constraint at the root node of 154 Ma). a, Time-calibrated summary phylogenetic tree with LTT plots rendered as heatmaps for all orders with four or more sampled genera. The log-transformed increase in the number of lineages is depicted in 5 Myr intervals, omitting crown nodes, which disproportionately altered the visualization; crown node locations are indicated by vertical lines. The yellow to blue colour scale represents steep to shallow slopes. For each order, the numbers of sampled and total genera are provided. b, A global LTT heatmap for all angiosperms is shown at the bottom of the figure as a whole.
Fig. 3
Fig. 3. Angiosperm-wide diversification and gene tree conflict through time.
The results illustrated are based on the young tree (maximum constraint at the root node of 154 Ma). See Extended Data Fig. 5 for results based on the old tree. a, Estimated net diversification rate through time (yellow, left y axis) and the level of gene tree conflict through time (blue, right y axis). Net diversification rates are estimated with a model that enables speciation rates to vary between time intervals; the line is the posterior mean and the yellow shaded area is the 95% highest posterior density. Gene tree conflict is calculated from the percentage of gene trees that do not share a congruent bipartition with each species tree branch, with the plotted value being the mean across all species tree branches that cross each 2.5 Myr time slice. b, Cumulative percentage of extant orders and families that have originated through time. In both a and b, the background grey-scale gradient is the estimated percentage of extant lineages represented in the species tree through time (sampling fraction).
Fig. 4
Fig. 4. Summary of lineage-specific diversification rate shifts estimated by BAMM.
The results illustrated are based on the young tree (maximum constraint at the root node of 154 Ma). See Extended Data Fig. 6 for results based on the old tree. a, Diversification rate increases per LTT. The colour corresponds to the average magnitude of the rate increases during the time period. b, Equivalent to a but for rate decreases. c, Equivalent to a but focusing on the largest 25% of diversification rate increases. In a, b and c, the number of shifts is from the maximum a posteriori shift configuration with the prior for the number of shifts set to 10 and the background grey-scale gradient is the estimated percentage of extant lineages represented in the species tree through time (sampling fraction).
Extended Data Fig. 1
Extended Data Fig. 1. Tanglegram at ordinal level between this work (left) and the APG IV schematic tree (right).
Branches colours represent the clades according to the composition proposed in each work. Posterior probability is presented only for nodes without maximum support. Coloured circles in the left tree represent the posterior probability of each node as: maximum (absent), between 1 and 0.95 (green), between 0.95 and 0.75 (yellow), between 0.75 and 0.5 (red), below 0.5 (black).
Extended Data Fig. 2
Extended Data Fig. 2. Comparison of node age estimates in the eight time-calibrated phylogenetic trees.
Each point represents a node and corresponds to the percentage difference in age estimates for that node between the two trees that are compared in each plot.
Extended Data Fig. 3
Extended Data Fig. 3. Comparison of stem ages of families and orders inferred in this study and Ramírez-Barahona et al..
a and b, Stem age comparison between our young tree (maximum constraint at the root node of 154 Ma) and the dataset CC_complete of Ramírez-Barahona et al.. a, Ages in each study, coloured according to taxonomic rank and b, Age differences, calculated as age in this study minus age in Ramírez-Barahona et al. c and d, Stem ages comparison between our old tree (maximum constraint at the root node of 247 Ma) and the dataset UC_complete from Ramírez-Barahona et al. c, Ages in each study, coloured according to taxonomic rank and d, Age differences, calculated as age in this study minus age in Ramírez-Barahona et al..
Extended Data Fig. 4
Extended Data Fig. 4. Correlation between branch time duration and percentage of gene trees that do not share a congruent bipartition for the branch.
The results are based on the young tree (maximum constraint at the root node of 154 Ma). For each branch in the young tree, the percentage of gene trees that do not share a congruent bipartition with the species tree branch is plotted against the logarithm of the time duration for the branch.
Extended Data Fig. 5
Extended Data Fig. 5. Angiosperm-wide diversification and gene tree conflict through time.
This is equivalent to Fig. 3 but for the old tree (maximum constraint at the root node of 247 Ma). a, Estimated net diversification rate through time (yellow, left y-axis) and the level of gene tree conflict through time (blue, right y-axis). Net diversification rates are estimated with a model that enables speciation rates to vary between time intervals; the line is the posterior mean and the yellow shaded area is the 95% highest posterior density. Gene tree conflict is calculated from the percentage of gene trees that do not share a congruent bipartition with each species tree branch, with the plotted value being the mean across all species tree branches that cross each 2.5 Myr time slice. b, Cumulative percentage of extant orders and families that have originated through time. In both a and b, the background grey-scale gradient is the estimated percentage of extant lineages represented in the species tree through time (“sampling fraction”).
Extended Data Fig. 6
Extended Data Fig. 6. Summary of lineage-specific diversification rate shifts estimated by BAMM.
This is equivalent to Fig. 4, but for the old tree (maximum constraint at the root node of 247 Ma). a, Diversification rate increases per lineage through time. The colour corresponds to the average magnitude of the rate increases during the time period. b, Equivalent to a, but for rate decreases. c, Equivalent to a, but focusing on the largest 25% of diversification rate increases. In a, b and c, the number of shifts is extracted from the maximum a posteriori shift configuration, the prior for the number of shifts is set to 10 and the background grey-scale gradient is the estimated percentage of extant lineages represented in the species tree through time (“sampling fraction”).

Comment in

  • Two steps beyond.
    Tena G. Tena G. Nat Plants. 2024 May;10(5):695. doi: 10.1038/s41477-024-01719-7. Nat Plants. 2024. PMID: 38773272 No abstract available.

References

    1. Diamond, J. Evolution, consequences and future of plant and animal domestication. Nature418, 700–707 (2002). 10.1038/nature01019 - DOI - PubMed
    1. Govaerts, R., Nic Lughadha, E., Black, N., Turner, R. & Paton, A. The World Checklist of Vascular Plants, a continuously updated resource for exploring global plant diversity. Sci. Data8, 215 (2021). 10.1038/s41597-021-00997-6 - DOI - PMC - PubMed
    1. Chase, M. W. et al. Phylogenetics of seed plants: an analysis of nucleotide sequences from the plastid gene rbcL. Ann. Missouri. Bot. Gard.80, 528–580 (1993). 10.2307/2399846 - DOI
    1. Li, H.-T. et al. Plastid phylogenomic insights into relationships of all flowering plant families. BMC Biol.19, 232 (2021). 10.1186/s12915-021-01166-2 - DOI - PMC - PubMed
    1. Ramírez-Barahona, S., Sauquet, H. & Magallón, S. The delayed and geographically heterogeneous diversification of flowering plant families. Nat. Ecol. Evol.4, 1232–1238 (2020). 10.1038/s41559-020-1241-3 - DOI - PubMed

Substances