. 2024 May;629(8011):417-425.
doi: 10.1038/s41586-024-07254-x. Epub 2024 Apr 24.

PGE2 limits effector expansion of tumour-infiltrating stem-like CD8+ T cells

Affiliations

PGE2 limits effector expansion of tumour-infiltrating stem-like CD8+ T cells

Sebastian B Lacher et al. Nature. 2024 May.

Abstract

Cancer-specific TCF1+ stem-like CD8+ T cells can drive protective anticancer immunity through expansion and effector cell differentiation1-4; however, this response is dysfunctional in tumours. Current cancer immunotherapies2,5-9 can promote anticancer responses through TCF1+ stem-like CD8+ T cells in some but not all patients. This variation points towards currently ill-defined mechanisms that limit TCF1+CD8+ T cell-mediated anticancer immunity. Here we demonstrate that tumour-derived prostaglandin E2 (PGE2) restricts the proliferative expansion and effector differentiation of TCF1+CD8+ T cells within tumours, which promotes cancer immune escape. PGE2 does not affect the priming of TCF1+CD8+ T cells in draining lymph nodes. PGE2 acts through EP2 and EP4 (EP2/EP4) receptor signalling in CD8+ T cells to limit the intratumoural generation of early and late effector T cell populations that originate from TCF1+ tumour-infiltrating CD8+ T lymphocytes (TILs). Ablation of EP2/EP4 signalling in cancer-specific CD8+ T cells rescues their expansion and effector differentiation within tumours and leads to tumour elimination in multiple mouse cancer models. Mechanistically, suppression of the interleukin-2 (IL-2) signalling pathway underlies the PGE2-mediated inhibition of TCF1+ TIL responses. Altogether, we uncover a key mechanism that restricts the IL-2 responsiveness of TCF1+ TILs and prevents anticancer T cell responses that originate from these cells. This study identifies the PGE2-EP2/EP4 axis as a molecular target to restore IL-2 responsiveness in anticancer TILs to achieve cancer immune control.


Conflict of interest statement

J.P.B., S.B.L., A.-M.P., P.K. and S.K. are preparing a patent application that includes work in this manuscript.

Figures

Fig. 1
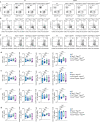
Fig. 1. EP2/EP4 deficiency permits CD8+ T cell-mediated tumour immune control.
a, Tumour growth profiles of 2 × 105 Ptgs1/Ptgs2−/− or control BRAFV600E melanoma cells transplanted into WT mice, Ptger2−/−Ptger4fl/fl mice and Cd4crePtger2−/−Ptger4fl/fl mice (n = 10 each). b, Growth profiles of 2 × 106 Panc02 cells transplanted into WT mice, Ptger2−/−Ptger4fl/fl mice and Cd4crePtger2−/−Ptger4fl/fl mice (n = 8 each). ce, WT mice, Ptger2−/−Ptger4fl/fl mice and Cd4crePtger2−/−Ptger4fl/fl mice were subcutaneously (s.c.) injected with 2 × 106 control or Ptgs1/Ptgs2−/− BRAFV600E cells and TILs were analysed 11 days later by flow cytometry. c, Plots showing the frequencies of CD8+ and CD4+ TILs among CD45+ immune cells and expression of the activation marker CD44. d, Quantification of TIL numbers (CD8+ TILs: Ptgs1/Ptgs2−/− into WT, n = 9; control into WT, n = 10; control into Ptger2−/−Ptger4fl/fl, n = 7; control into Cd4crePtger2−/−Ptger4fl/fl, n = 10; CD4+ TILs: Ptgs1/Ptgs2−/− into WT, n = 8; control into WT, n = 10; control into Ptger2−/−Ptger4fl/fl; n = 7; control into Cd4crePtger2−/−Ptger4fl/fl, n = 8). e, TIL frequencies (Ptgs1/Ptgs2−/− into WT, n = 8; control into WT, n = 8; control into Ptger2−/−Ptger4fl/fl, n = 7; control into Cd4crePtger2−/−Ptger4fl/fl, n = 8). f, Effect of CD8+ and CD4+ T cell depletion on control BRAFV600E tumour growth in Cd4crePtger2−/−Ptger4fl/fl mice (Cd4crePtger2−/−Ptger4fl/fl, n = 8; WT, n = 9). Data in a, b and df are pooled from two (b,f) or three (a,d,e) independent experiments and depicted as the mean ± s.e.m. Plots in c show data for 1 tumour representative of n = 7 tumours from 2 independent experiments. P values are from two-way analysis of variance (ANOVA) with Bonferroni’s correction for multiple testing (a,b,f) or one-way ANOVA with Dunnett’s multiple-comparison test (d,e). NS, not significant (P ≥ 0.05). Source Data
Fig. 2
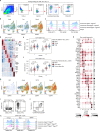
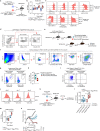
Fig. 2. Ablation of T cell-intrinsic EP2/EP4 signalling rescues CD8+ T cell expansion and effector differentiation in PGE2-producing tumours.
ag, scRNA-seq analyses of CD8+ TILs in control BRAFV600E tumours from Ptger2−/−Ptger4fl/fl mice, Cd4crePtger2−/−Ptger4fl/fl mice and GzmbcePtger2−/−Ptger4fl/fl mice (n = 4 each). a, Experimental design. b, Uniform manifold approximation and projection (UMAP) plot of 12,516 CD8+ TILs coloured according to cluster classification. c, Visualization of Tcf7 and Havcr2 transcript levels. d, PCPT plot showing expression levels of selected genes. e, Developmental trajectory prediction by unsupervised slingshot analysis. f,g, Comparison of CD8+ TIL clusters among Ptger2−/−Ptger4fl/fl mice, Cd4crePtger2−/−Ptger4fl/fl mice and GzmbcrePtger2−/−Ptger4fl/fl mice. f, Density analysis. g, Quantification relative to cluster 1 (n = 4 each). h,i, scTCR-seq analyses of CD8+ TILs from n = 3 tumours for each group. h, UMAP visualizations of T cell clonotype distribution. i, Quantification of T cell clonotype frequency. jn, TIM-3+ effector CD8+ T cell differentiation in tumour tissue. Cd4crePtger2−/−Ptger4fl/fl mice bearing control BRAFV600E tumours were injected with FTY720 or NaCl as control. j, Experimental design. k, Representative flow cytometry plots showing TCF1 and TIM-3 expression among CD44+CD8+ TILs. l, Average percentages of CD8+ TIL populations across n = 6 tumours. m, Quantification of CD8+ TIL numbers (n = 6). n, Analysis of tumour mass (n = 10). Anti-CD8β, antibody-mediated CD8+ T cell depletion in the absence of FTY720 treatment. Data in ah are from one experiment. Data in g are depicted as box plots extending from the 25th to 75th percentiles with the median as the centre and the whiskers corresponding to the minimum and maximum values. Data in k–n are pooled from two (k,l,m) or three (n) independent experiments and depicted as the mean ± s.e.m. P values are from two-way ANOVA with Bonferroni’s correction for multiple testing (g) or one-way ANOVA with Tukey’s multiple-comparison test (m,n). Plots in k show data for 1 tumour representative for n = 6 tumours from 2 independent experiments. Source Data
Fig. 3
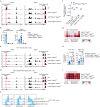
Fig. 3. PGE2 impairs CD8+ T cell expansion and effector differentiation from TCF1+ cells by inhibiting IL-2 signalling.
a, TF activity in TCF1+CD8+ TILs from control BRAFV600E tumours in Cd4crePtger2−/−Ptger4fl/fl mice and GzmbcrePtger2−/−Ptger4fl/fl mice (relative to Ptger2−/−Ptger4fl/fl mice). b, Effect of PGE2 on ex vivo expansion of TCF1+CD8+ TILs sorted from Ptgs1/Ptgs2−/− BRAFV600E tumours (n = 3). c,d, Effect of PGE2 on expansion (c) and proliferation (d) of repetitively activated TCF1+CD8+ T cells from in vitro T cell cultures (n = 4). eh, Analysis of repetitively activated TCF1+CD8+ T cells by RNA-seq (n = 4). e, Experimental design. f, principal component (PC) analysis based on all DEGs. g, Volcano plot showing the effect of PGE2 exposure on gene expression in TCF1+CD8+ T cells stimulated with anti-CD3/CD28 and IL-2. h, GSEA of hallmark pathways based on g. *Pathways significantly regulated; NES, normalized enrichment score. i,j, Effect of PGE2 exposure on IL-2-dependent pSTAT5 induction in repetitively activated TCF1+CD8+ T cells. Cells were treated with 33 U ml–1 IL-2. j, n = 3. k, Expansion of repetitively activated TCF1+CD8+ T cells treated or untreated with PGE2 and stimulated as indicated (n = 3). ln, WT or Cd4crePtger2−/−Ptger4fl/fl TCF1+CD8+ T cells from in vitro T cell cultures were incubated with or without PGE2 for 20 h before stimulation with IL-2 (l,m) or anti-CD3/CD28 and IL-2 (n). l, Flow cytometry plot showing pSTAT5 signalling after 30 min. Cells were treated with 33 U ml–1 IL-2. m, Quantification of pSTAT5 (n = 3). n, Quantification of T cell expansion (n = 3). Data in b and c are pooled from two independent experiments. Data in j, k, m and n are representative of two independent experiments. Plots in d, i and l show data for 1 T cell culture representative of n = 6 T cell cultures analysed in 2 independent experiments. For b, c, k and n, horizontal lines and error bars indicate the mean ± s.e.m. For j and m, box plots indicate the median. P values are from unpaired t-tests. In g, DEGs (P < 0.05; fold change ≥ 2) were identified by Wald test with multiple testing using the Benjamini–Hochberg method. Source Data
Fig. 4
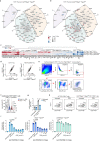
Fig. 4. EP2/EP4-deficient tumour antigen-specific CD8+ T cells expand in PGE2-producing tumours and mediate tumour immune control.
a, Experimental design for bf. b, Flow cytometric plots of CD8+ T cells from tdLNs and tumours from the indicated days. c,d, Numbers of expanded OT-I CD8+ T cells in tdLNs (c) and tumours (d) at indicated time points (n = 6). e,f, Analysis of CD44 and CXCR6 expression in Cd4crePtger2−/−Ptger4fl/fl OT-I cells. e, Flow cytometry plots. f, Subset frequencies (n = 6). gj, Effect of CD122/CD132 blockade on OT-I T cell expansion in tumours. gj, Effect of anti-CD122 and anti-CD132 (anti-CD122/CD132) treatment on OT-I TIL expansion in WT mice with control or Ptgs1/Ptgs2−/− BRAFV600E-OVA tumours or with MC38-OVA tumours, analysed 11 days after tumour transplantation. g,h, Flow cytometry plots (g) and OT-I TIL numbers (h) in BRAFV600E-OVA tumours (n = 6). i,j, Flow cytometry plots (i) and OT-I TIL numbers (j) in MC38-OVA tumours (n = 10). k, Experimental design for l and m with MC38-OVA tumours. l, Flow cytometry plot (left) and quantification (right) of OT-I TILs at day 10 (n = 6). m, Flow cytometry plots showing the population size of TIM-3+CXCR6+ cells among control and Cd122−/− Cd4crePtger2−/−Ptger4fl/fl OT-I TILs. n, WT mice received 1 × 103 naive OT-I T cells or 1 × 103 naive Cd4crePtger2−/−Ptger4fl/fl OT-I T cells intravenously (i.v.) and were transplanted s.c. with 2 × 106 MC38-OVA cells before analysis of tumour growth over time (n = 10). Asterisk indicates that termination criteria were reached. Data in c, d, f, h, j, l and n are pooled from two (c,d,h,l) or three (f,j,n) independent experiments and depicted as box plots extending from the 25th to 75th percentiles with the median as the centre and the whiskers corresponding to minimum and maximum values (c,d,h,j,l) or shown as the mean ± s.e.m. (f,n). Plots in b, e, g, i, l and m show data for 1 sample representative of n = 6 samples analysed in 2 (b,g,l,m) or 3 (e,i) independent experiments. P values are from paired t-tests (l), one-way ANOVA with Tukey’s multiple-comparison test (c,d) or Dunnett’s multiple-comparison test (h,j), or two-way ANOVA with Bonferroni’s correction for multiple testing (n). Source Data
Extended Data Fig. 1
Extended Data Fig. 1. Cd4crePtger2−/−Ptger4fl/fl, GzmbcrePtger2−/−Ptger4fl/fl and Ptger2−/−Ptger4fl/fl mice exhibit normal T cell profiles.
Flow cytometric analysis of CD8+ and CD4+ T cells in spleens and inguinal lymph nodes (LN) of WT, Ptger2−/−Ptger4fl/fl, Cd4crePtger2−/−Ptger4fl/fl and GzmbcPtger2−/−Ptger4fl/fl mice (n = 8 per group). a-c, Representative plots showing a, CD4+ and CD8+ T cell frequency among live CD45+ cells or T cell subset composition among b, CD4+ T cells or c, CD8+ T cells as measured by CD44 and CD62L marker expression. d-g, Quantification of total cell numbers and subset composition for d, CD8+ T cells in LN (n = 8 per group), e, CD4+ T cells in LN (n = 8 per group), f, splenic CD8+ T cells (n = 5 per group) and g, splenic CD4+ T cells (n = 5 per group), based on a-c. Plots in a-c show data for one sample representative for n = 5–8 samples from two independent experiments. Data in d-g are pooled from two independent experiments and depicted as box plots extending from the 25th to 75th percentiles with the median as centre and whiskers corresponding to minimum and maximum values. P ≥ 0.05, not significant (NS) as determined by one-way ANOVA with Dunnett’s multiple-comparison test. Source Data
Extended Data Fig. 2
Extended Data Fig. 2. Cd4crePtger2−/−Ptger4fl/fl mice reject PGE2-producing tumours.
Growth profiles following s.c. inoculation of cancer cell lines into WT, Ptger2−/−Ptger4fl/fl or Cd4crePtger2−/−Ptger4fl/fl mice. a, Individual profiles of 2 × 105 control or Ptgs1/Ptgs2−/− BRAFV600E tumour cells (n = 10). b, Growth of 2 × 105 Ptgs1/Ptgs2−/− BRAFV600E melanoma cells transplanted into Rag1−/− mice (n = 4) or WT mice with or without CD8+ T cell depletion (n = 5 per group). c, Individual profiles of 2 × 106 Panc02 tumour cells (n = 8). d, Individual profiles of 2 × 105 MC38 tumour cells (n = 6). e, Representation of all profiles shown in d. Data in a-e are pooled from two (b,c,d,e) or three (a) independent experiments and depicted as mean ± s.e.m. values are from two-way ANOVA with Bonferroni’s multiple-comparison test. P ≥ 0.05, not significant (NS). Source Data
Extended Data Fig. 3
Extended Data Fig. 3. Tumour-derived PGE2 does not impact on priming of anticancer CD8+ T cells in lymph nodes.
a, Experimental design for b-e. WT mice received 1 × 103 naive OVA-specific CD45.1+ OT-I T cells followed by inoculation with 2 × 106 control or Ptgs1/Ptgs2−/− BRAFV600E-OVA cells. 6 days later, tdLNs were analysed by flow cytometry. Mice injected with Ptgs1/Ptgs2−/− BRAFV600E cells (lacking OVA expression) served as control. b, Representative plot showing S8:H-2Kb surface staining on migratory cDC1 (identified as live CD45+CD11c+MHCIIhiCD103+CD8αCD11b cells). c, Quantification based on b, with n = 5 for control and Ptgs1/Ptgs2−/− BRAFV600E-OVA, n = 4 for Ptgs1/Ptgs2−/−BRAFV600E. d, Flow cytometry plots showing the sorting strategy for naive OT-I T cells. e, Flow cytometry plots showing expression of CD44 and TCF1 in polyclonal CD8+ T cells and OVA-specific OT-I T cells. f, Quantification of antigen-experienced CD44+ TCF1+ OT-I T cells based on e. n = 5. g, PGE2 concentration in lysates from tumours and indicated organs analysed 11 days after s.c. inoculation of WT mice with control or Ptgs1/Ptgs2−/− BRAFV600E melanoma cells (n = 5 per group). h, Effect of equilateral co-transplantation of 2 × 105 control and Ptgs1/Ptgs2−/− BRAFV600E tumours on tumour growth (n = 4 per group). Data in c and f-h are pooled from two (c,f,h) or three (g) independent experiments and depicted as mean ± s.e.m. Plots in b,e show data for one sample representative for n = 5 samples from two independent experiments. values in c,f are from one-way ANOVA with Tukey’s multiple-comparison test, values in g are from unpaired t-tests, values in h are from two-way ANOVA with Bonferroni’s multiple-comparison test. P ≥ 0.05, not significant (NS). Source Data
Extended Data Fig. 4
Extended Data Fig. 4. Isolation of CD8+ TILs for scRNA-seq and phenotypic characterisation of CD8+ TIL populations.
Ptger2−/−Ptger4fl/fl, Cd4crePtger2−/−Ptger4fl/fl or GzmbcrePtger2−/−Ptger4fl/fl mice were transplanted with 2 × 106 control BRAFV600E melanoma cells. After 11 days, CD8+ TIL populations were sorted from n = 4 tumours per group and analysed by scRNA-seq (b,d-h) or flow cytometry (c,i-k). a, Flow cytometry plots showing the sorting strategy. b, UMAP plots showing transcript expression of Cd44, Tox and Pdcd1 (encoding PD-1) as determined by scRNA-seq. c, Flow cytometric analysis of CD44, TOX and PD-1 protein expression in CD8+ TILs. d, Heatmap showing the expression of cluster signature transcripts (top 50). e,f, Correlation of TCF1+CD8+ TIL cluster gene expression with gene signatures of e naive CD8+ T cells, memory stem cell CD8+ T cells (TSCM) and central memory CD8+ T cells (TCM) or f naive CD8+ T cells, tumour antigen-specific CD8+ T cells in tdLNs and tumour-infiltrating stem-like CD8+ T cells. g, UMAP visualisation of transcript expression of indicated immune genes as determined by scRNA-seq. h, Expression levels of selected immune genes across CD8+ TIL clusters. i, Flow cytometric analysis of GZMB and CD62L expression among TCF1+ and TIM-3+ CD8+ TIL populations from a WT mouse. j, Flow cytometric analysis of TIM-3 and CXCR6 protein expression in CD8+ TILs from a WT mouse. k, Analysis of GZMB expression in activated (CD44+) CD8+ T cells isolated from tumours, tdLNs and spleen. Numbers indicate percentage of GZMB+ cells compared to isotype control. Plots in a,c,i-k show data for one tumour representative for n = 6 tumours from one (a,b), two (c,i,k), or three (j) independent experiments or pooled data from n = 4 biological replicates from one experiment (d-h). values in e,f are from pairwise comparisons using Wilcoxon rank sum test and Bonferroni correction for multiple testing. P ≥ 0.05, not significant (NS).
Extended Data Fig. 5
Extended Data Fig. 5. GzmbcrePtger2−/−Ptger4fl/fl mice exhibit Ptger4 knockout in TCF1+CD8+ TILs; increased proliferation of TCF1+CD8+ TILs and their progeny in T cell-specific EP2/EP4 double deficient mice.
a, Gene tracks showing the average scRNA-seq read coverage on Ptger2 and Ptger4 loci in CD8+ TILs from BRAFV600E melanoma tumours in WT, Ptger2−/−Ptger4fl/fl, Cd4crePtger2−/−Ptger4fl/fl and GzmbcrePtger2−/−Ptger4fl/fl mice across all replicates. Dashed boxes highlight knockout(KO)-specific target regions. b, Quantification of Ptger2 and Ptger4 read coverage for KO-specific target regions based on a. n = 4. c,d, Gene tracks showing the scRNA-seq read coverage on Ptger2 and Ptger4 loci in c, TCF1+CD8+ TILs and d, TIM-3+ TIL progeny from WT, Ptger2−/−Ptger4fl/fl, Cd4crePtger2−/−Ptger4fl/fl and GzmbcrePtger2−/−Ptger4fl/fl mice. Data for one representative replicate with comparable cell numbers is shown. e,f, WT or GzmbcrePtger2−/−Ptger4fl/fl TCF1+ stem-like and TCF1 effector CD8+ T cells from in vitro T cell cultures were stimulated or not with anti-CD3/CD28 for 24 h. e, Representative flow cytometry plots showing TCF1, CD62L and GZMB protein expression. f, Ptger4 mRNA expression as measured by knockout-sensitive RT-PCR (n = 2). g, Expression of a CD8+ T cell proliferation signature across the distinct populations of CD8+ TILs from Ptger2−/−Ptger4fl/fl, Cd4crePtger2−/−Ptger4fl/fl and GzmbcrePtger2−/−Ptger4fl/fl mice based on scRNA-seq. h, Analysis of Ki-67 protein expression in TCF1+ and TIM-3+ CD8+ TILs 11 days after inoculation of Ptger2−/−Ptger4fl/fl, Cd4crePtger2−/−Ptger4fl/fl and GzmbcrePtger2−/−Ptger4fl/fl mice with 2 × 106 control BRAFV600E melanoma cells. n = 7. i, Expression of a gene signature for T cell effector function, analysed as in g. Data in a-e,g,i are from one experiment. Data in b,h are pooled from two (b) or three (h) independent experiments and depicted as mean ± s.e.m. Data in f are depicted as mean ± s.d. from one experiment. values are from one-way ANOVA with Tukey’s multiple-comparison test. P ≥ 0.05, not significant (NS). Source Data
Extended Data Fig. 6
Extended Data Fig. 6. EP2/EP4 double deficiency permits clonal differentiation and expansion of CD8+ TILs in PGE2-producing tumours.
a, UMAP visualisations of T cell clonotype distribution across CD8+ TILs based on scTCR-seq. b, Clonotype frequency across CD8+ TIL clusters based on a. c, UMAP visualisation of expanded tumour-infiltrating CD8+ T cell clonotypes coloured according to cluster classification. d, Comparison of clonotype frequencies between Ptger2−/−Ptger4fl/fl, Cd4crePtger2−/−Ptger4fl/fl and GzmbcrePtger2−/−Ptger4fl/fl mice. e, Frequencies of T cell clones shared between TCF1+CD8+ TILs and TIM-3+ TIL progeny. f, UMAP plots visualising the top 3 most frequent shared clonotypes for Ptger2−/−Ptger4fl/fl, Cd4crePtger2−/−Ptger4fl/fl and GzmbcrePtger2−/−Ptger4fl/fl mice. Data are from one experiment. Source Data
Extended Data Fig. 7
Extended Data Fig. 7. EP2/EP4 double deficiency rescues development of early and terminally differentiated effector CD8+ T cells within tumour tissue.
a-c, WT, Ptger2−/−Ptger4fl/fl or Cd4crePtger2−/−Ptger4fl/fl mice were injected s.c. with 2×10⁶ control or Ptgs1/Ptgs2−/− BRAFV600E cells and CD44+ CD8+ TILs were analysed 11 days later by flow cytometry. a, Representative plots showing the frequency of TCF1+ stem-like and TIM-3+ effector CD8+ TIL populations. b, Quantification of TCF1+CD8+ TILs (Ptgs1/Ptgs2−/− into WT, n = 9; Control into WT, n = 11; Control into Ptger2−/−Ptger4fl/fl, n = 7; Control into Cd4crePtger2−/−Ptger4fl/fl, n = 10). c, Quantification of TIM-3+CD8+ TILs (Ptgs1/Ptgs2−/− into WT, n = 8; Control into WT, n = 10; Control into Ptger2−/−Ptger4fl/fl, n = 7; Control into Cd4crePtger2−/−Ptger4fl/fl, n = 10). Data in b,c are pooled from three independent experiments and depicted as mean ± s.e.m. Plots in a show data for one tumour sample representative for at least n = 7 samples from three independent experiments. values are from one-way ANOVA with Tukey’s multiple-comparison test. P ≥ 0.05, not significant (NS). Source Data
Extended Data Fig. 8
Extended Data Fig. 8. PGE2-mediated changes in TCF1+CD8+ T cells, effect on γc expression and proliferation.
a-d, scRNA-seq based analysis of TF activity alterations in TCF1+CD8+ TILs and their TIM-3+CXCR6+ effector progeny between control BRAFV600E melanoma tumours in Cd4crePtger2−/−Ptger4fl/fl and GzmbcrePtger2−/−Ptger4fl/fl mice compared to Ptger2−/−Ptger4fl/fl mice. a,b, Alterations of TF network activity in TCF1+CD8+ TILs from BRAFV600E melanoma tumours in aCd4crePtger2−/−Ptger4fl/fl mice compared to Ptger2−/−Ptger4fl/fl mice or bGzmbcrePtger2−/−Ptger4fl/fl mice compared to Ptger2−/−Ptger4fl/fl mice. c, Heatmap visualisation, d, Correlation of TF activity alterations for TIL populations from Cd4crePtger2−/−Ptger4fl/fl and GzmbBcrePtger2−/−Ptger4fl/fl mice. e, Flow cytometry plots showing the sorting strategy for TCF1+ TILs (identified as TIM-3CXCR6 cells) from Ptgs1/Ptgs2−/− BRAFV600E tumours. f, Volcano plot showing the effect of PGE2 exposure on gene expression in TCF1+CD8+ T cells from in vitro T cell cultures, based on RNA-seq analysis. g, Effect of PGE2 treatment on IL-2Rγc protein expression (n = 3). h, WT or Cd4crePtger2−/−Ptger4fl/fl TCF1+CD8+ T cells from in vitro T cell cultures were stimulated with anti-CD3/CD28 and high-dose IL-2 in presence or absence of PGE2. After 24 h cells were analysed for T cell proliferation by EdU incorporation. i, WT, Ptger2−/−Ptger4fl/fl or Cd4crePtger2−/−Ptger4fl/fl TCF1+CD8+ T cells were treated or not with tumour cell conditioned medium (CM) or PGE2 and stimulated as indicated. After 72 h, T cell expansion was analysed by flow cytometry. n = 3. Data in a-d, f are from one experiment. Data in g,i show data for one representative of two independent experiments with n = 3 biological replicates. In f), DEGs (P < 0.05; fold change ≥ 2) were identified by Wald test with multiple testing by the Benjamini-Hochberg method. Horizontal lines and error bars in (g,i) indicate mean ± s.d. P-values are from d, Fitted linear regression models or g, and i, unpaired t-test. P ≥ 0.05, not significant (NS). Plots in (h) show data for one sample representative for n = 3 samples. Source Data
Extended Data Fig. 9
Extended Data Fig. 9. PGE2 impairs proliferative expansion and effector differentiation of antigen-specific TCF1+CD8+ TILs.
a, Experimental design for b-d b, Quantification of OT-I cell expansion in tumours at different time points (day 6 and day 8: n = 8 per group; day 10: n = 7 per group). c, Histograms showing expression of indicated molecules in Cd4crePtger2−/−Ptger4fl/fl OT-I TILs at different time points. Naive Cd4crePtger2−/−Ptger4fl/fl OT-I T cells served as control. d, Flow cytometry plots showing subpopulation composition among Cd4crePtger2−/−Ptger4fl/fl OT-I TILs. e-h, WT mice received 1 × 103 naive congenically marked CD45.1+ Cd4crePtger2−/−Ptger4fl/fl OT-I T cells followed by inoculation with 2 × 106 MC38-OVA cells. 8 days later, the indicated subpopulations of OT-I TILs were sorted and 7 × 103 cells were re-transferred into MC38-OVA bearing Rag1−/− recipient mice. TILs in Rag1−/− recipients were analysed at day 8 post re-transfer. e, Experimental design. f, Flow cytometry plots showing the sorting strategy. g, Flow cytometry plots showing the frequency of OT-I TILs recovered at day 8 post re-transfer. h, Quantification of OT-I TIL progenies based on (g), with TIM-3CXCR6 stem-like, n = 7; TIM-3+CXCR6+ differentiated, n = 8. i, Flow cytometry plots showing the expression of TIM-3 and CXCR6 among recovered OT-I TILs. j, Analysis of TCF1 expression in Cd4crePtger2−/−Ptger4fl/fl OT-I T cells in tdLNs and tumours over time. k, Experimental design for ll, Effect of FTY720 treatment from day 6 on OT-I T cell expansion in tumours (n = 6). m,n, WT mice received 1 × 103 naive OT-I T cells or 1 × 103 naive Cd4crePtger2−/−Ptger4fl/fl OT-I T cells i.v. and were transplanted s.c. with 2 × 106 D4M.3A-pOVA melanoma cells before m, quantification of OT-I cell expansion in tumours at different time points (n = 6) or n, analysis of tumour growth over time (n = 4). Data in b,h,l-n are pooled from two (h,l-n) or three (b) independent experiments and depicted as box plots extending from the 25th to 75th percentiles with the median as centre and whiskers corresponding to minimum and maximum values (b,h,l,m) or shown as mean ± s.e.m. (n). Plots in c,d,g,i,j show data for one sample representative for (c,d,g,i) n = 7 or (j) n = 6 samples from two independent experiments. values in b,l are from one-way ANOVA with Tukey’s multiple-comparison test, values in h,m are from unpaired t-test, P-values in n are from two-way ANOVA with Bonferroni’s correction for multiple testing. P ≥ 0.05, not significant (NS). Source Data

References

    1. Jansen CS, et al. An intra-tumoral niche maintains and differentiates stem-like CD8 T cells. Nature. 2019;576:465–470. doi: 10.1038/s41586-019-1836-5. - DOI - PMC - PubMed
    1. Siddiqui I, et al. Intratumoral Tcf1+PD-1+ CD8+ T cells with stem-like properties promote tumor control in response to vaccination and checkpoint blockade immunotherapy. Immunity. 2019;50:195–211.e10. doi: 10.1016/j.immuni.2018.12.021. - DOI - PubMed
    1. Prokhnevska N, et al. CD8+ T cell activation in cancer comprises an initial activation phase in lymph nodes followed by effector differentiation within the tumor. Immunity. 2023;56:107–124.e5. doi: 10.1016/j.immuni.2022.12.002. - DOI - PMC - PubMed
    1. Zehn D, Thimme R, Lugli E, de Almeida GP, Oxenius A. ‘Stem-like’ precursors are the fount to sustain persistent CD8+ T cell responses. Nat. Immunol. 2022;23:836–847. doi: 10.1038/s41590-022-01219-w. - DOI - PubMed
    1. Miller BC, et al. Subsets of exhausted CD8+ T cells differentially mediate tumor control and respond to checkpoint blockade. Nat. Immunol. 2019;20:326–336. doi: 10.1038/s41590-019-0312-6. - DOI - PMC - PubMed

Publication types

MeSH terms

Substances