Comparative Study
. 2024 May;629(8010):127-135.
doi: 10.1038/s41586-024-07305-3. Epub 2024 Apr 24.

Emx2 underlies the development and evolution of marsupial gliding membranes

Affiliations
Comparative Study

Emx2 underlies the development and evolution of marsupial gliding membranes

Jorge A Moreno et al. Nature. 2024 May.

Abstract

Phenotypic variation among species is a product of evolutionary changes to developmental programs1,2. However, how these changes generate novel morphological traits remains largely unclear. Here we studied the genomic and developmental basis of the mammalian gliding membrane, or patagium-an adaptative trait that has repeatedly evolved in different lineages, including in closely related marsupial species. Through comparative genomic analysis of 15 marsupial genomes, both from gliding and non-gliding species, we find that the Emx2 locus experienced lineage-specific patterns of accelerated cis-regulatory evolution in gliding species. By combining epigenomics, transcriptomics and in-pouch marsupial transgenics, we show that Emx2 is a critical upstream regulator of patagium development. Moreover, we identify different cis-regulatory elements that may be responsible for driving increased Emx2 expression levels in gliding species. Lastly, using mouse functional experiments, we find evidence that Emx2 expression patterns in gliders may have been modified from a pre-existing program found in all mammals. Together, our results suggest that patagia repeatedly originated through a process of convergent genomic evolution, whereby regulation of Emx2 was altered by distinct cis-regulatory elements in independently evolved species. Thus, different regulatory elements targeting the same key developmental gene may constitute an effective strategy by which natural selection has harnessed regulatory evolution in marsupial genomes to generate phenotypic novelty.


Conflict of interest statement

The authors declare no competing interests.

Figures

Fig. 1
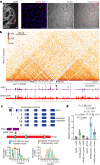
Fig. 1. Convergent evolution of patagia among closely related marsupial species.
a, An adult sugar glider extending its patagium (red arrowheads) during gliding flight. Photo credit: Joe MacDonald. b, Scanning electron micrograph showing dorsolateral views of P5, P8 and P12 sugar glider joeys. The patagium primordium (red arrowheads) becomes externally visible at P5 and continues to grow and extend in subsequent days. Scale bars, 1 mm. c, Species tree topology estimated from whole-genome data. All displayed branches have 100% bootstrap support. Phylogeny is consistent with the independent evolution of patagia in three petauroid species (labelled in red font): P. breviceps, P. volans and A. pygmaeus. Species for which we generated genome sequences and assemblies are indicated by asterisks. d, ATAC–seq and ChIP–seq traces from the P5 sugar glider patagium primordium. e, The experimental strategy used to identify the set of candidate cis-regulatory elements used for downstream analyses. The joey schematic in d was created using BioRender.
Fig. 2
Fig. 2. Emx2 is enriched for GARs.
a, Enrichment analysis identified genes with an overrepresentation of GARs. Genes containing at least one GAR were plotted. b, Contact domain containing the Emx2 locus. Emx2-associated GARs for P. breviceps (blue), P. volans (green) and A. pygmaeus (light red), and Micro-C contact loops are shown. The contact loop between GAR 16519 and the Emx2 promoter is shown in light red (the black arrow shows the contact point); other called loops are shown in grey. There were no other distant GARs displaying contact interactions with Emx2. Source Data
Fig. 3
Fig. 3. In-pouch transgenesis to probe Emx2 function.
a, The strategy used to deliver lentiviral particles. b, A lentivirus carrying a GFP reporter stably transduced the developing patagium, as seen in dorsal images of P10 joeys and transverse cryosections. c, Transverse cryosections of joeys injected with either an shRNA lentivirus targeting Emx2 (shEmx2-3) or a control lentivirus (shScram). d, The ratio between the area of uninjected and injected patagia. Data are mean ± s.e.m. e,f, qPCR analysis of relative Emx2 expression in patagia transduced with shRNA against Emx2 (e) or shScram (f) and non-transduced patagia. Data are mean ± s.e.m. g, IHC analysis of EMX2 (arrowheads) distribution. h, DEGs (data corrected for multiple comparisons; FDR < 0.1) between patagia injected with the experimental and control virus. Genes downregulated in patagia injected with the shEmx2-3 virus are shown in pink; genes more highly expressed in patagia injected with the shScram control are shown in yellow; genes without differential expression are shown in grey. FC, fold change. i, The number of overlapping genes downregulated in patagia injected with shEmx2-3 and upregulated in the native patagium primordium. Statistical significance in d (n = 4; P = 0.0067), e (n = 5; P = 0.0044) and f (n = 3; P = 0.7585) was assessed using two-tailed t-tests. Scale bars, 500 μm (b (left and middle), c (main image)) and 50 μm (b (right)), 100 μm (c (inset) and g). The schematic in a was created using BioRender. Source Data
Fig. 4
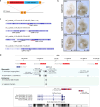
Fig. 4. Emx2 directly regulates Wnt5a.
a, In situ hybridization analysis of Wnt5a coupled with IHC analysis of EMX2 in a cross-section of the developing patagium of a P5 sugar glider joey. Wnt5a can be visualized as individual puncta while EMX2 staining shows nuclear localization. Scale bars, 500 µm (low magnification) and 50 µm (high magnification). nt, neural tube. b, The contact domain containing the Wnt5a locus. The Micro-C contacts, ATAC peaks (purple) and EMX2-bound sites (red) are shown. The dotted box delineates all of the candidate regulatory elements assigned to Wnt5a. The arrowheads within that region show overlapping ATAC and EMX2-bound sites; the grey arrowheads show peaks that are distant from the Wnt5a promoter and the black arrowhead shows the peak located near to the Wnt5a coding sequence that was chosen for characterization. c, Schematic of sugar glider Wnt5a showing annotated transcripts recovered from RNA-seq data. The 241 bp region overlapping between the ATAC peak (purple box) and an EMX2-bound site (red box) was chosen for downstream analysis. Shown at the bottom of the panel are the different EMX2 binding motifs contained in this 241 bp sequence. d, The relative luciferase activity of different constructs tested. Data are mean ± s.e.m. Statistical significance was assessed using one-way analysis of variance (ANOVA). n = 6 (experimental constructs) and n = 3 (controls). P = 7.56 × 10−7 (Wnt5a-prom + GFP versus Wnt5a-prom + Emx2), P = 7.88 × 10−7 (Wnt5a-prom + Emx2 versus Wnt5a-mut_prom + Emx2), P = 5 × 10−9 (Wnt5a-prom + Emx2 versus vector + Emx2), P = 0.0260 (Wnt5a-prom + GFP versus Wnt5a-mut_prom + GFP), P = 0.0284 (Wnt5a-prom + GFP versus vector + GFP), P = 0.9980 (Wnt5a-mut_prom + GFP versus vector + GFP), P = 0.0077 (Wnt5a-mut_prom + Emx2 versus vector + Emx2). Source Data
Fig. 5
Fig. 5. Spatial expression and function of Emx2 in mice.
a,b, Whole-mount in situ hybridization of Emx2 in E11.5 (a) and E13.5 (b) laboratory mouse embryos. Emx2 is transiently expressed in mesenchymal cells of the Wolffian ridge (arrowheads) of E11.5 embryos. At E13.5, staining is restricted to portions of the limbs (arrowheads) and is no longer visible in the Wolffian ridge. fl, forelimbs; hl, hindlimbs. cf, Relative to control littermates, PdfgracreERT2/+RosaEmx2-GFP/+ double transgenic mice overexpressing Emx2 in dermal fibroblasts show a significant increase in epidermal thickness, as determined by KRT14 staining (c; quantification in e), and an increase in mesenchymal cell density, as determined by DAPI staining (d; quantification in f). For e and f, statistical significance (n = 4; P = 0.00096; e) and (n = 4; P = 0.0033; f) was assessed using a general mixed-effects model one-way ANOVA. The yellow dotted line in d denotes the dermis–epidermis boundary. For e and f, data are mean ± s.e.m. Scale bars, 500 µm (a and b) and 100 µm (c and d (left)) and 50 µm (d (right)). Source Data
Extended Data Fig. 1
Comparison of benchmarking universal single-copy ortholog (BUSCO) recovery for all genomes sequenced and assembled in this study.
Extended Data Fig. 2
Extended Data Fig. 2. Glider Accelerated Regions (GARs) in marsupial gliding species.
a, Venn diagram showing number of unique and shared GARs among the three glider species (Acrobates pygmaeus, Petauroides volans, and Petaurus breviceps). b and c, Example trees showing branch lengths of GARs that were unique to one gliding species (b) or shared among two glider species (c). Gliding species are labelled in red and species in which the element is accelerated are underlined.
Extended Data Fig. 3
Extended Data Fig. 3. Differentially expressed genes between the patagium primordium and different skin regions.
a-b, Patagium vs Dorsal (a) and Patagium vs Shoulder (b). Yellow represents genes more highly expressed in the patagium; pink are genes more highly expressed in the dorsal skin; grey are genes without differential expression. Data corrected for multiple comparisons; FDR  <  0.1. Joey schematics created with BioRender.com.
Extended Data Fig. 4
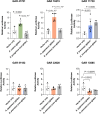
Extended Data Fig. 4. Relative luciferase activity (Mean + SE) for GARs and orthologous sequences of the corresponding non-glider sister species.
Statistical significance was assessed using one-way ANOVA tests. GAR 41701; P. volans (N = 5), P. peregrinus (N = 6), vector (N = 3): P = 0.0062 (vector vs. P. volans), P = 0.1373 (vector vs. P. peregrinus), P = 3.8 × 10⁻⁵ (P. volans vs P. peregrinus); GAR 16519; A. pygmaeus (N = 6), D. pennatus (N = 6), vector (N = 3): P = 9.4 × 10⁻⁹ (vector vs. A. pygmaeus), P = 0.5568 (vector vs. D. pennatus), P = 2.71 × 10⁻⁸ (A. pygmaeus vs D. pennatus); GAR 11730; P. breviceps (N = 6), D. trivergata (N = 5), vector (N = 3): P = 0.0372 (vector vs. P. breviceps), P = 0.0082 (vector vs. D. trivergata), P = 0.2895 (P. breviceps vs D. trivergata). GAR 51182; A. pygmaeus (N = 6), D. pennatus (N = 6), control (N = 3): P = 0.5388 (vector vs. A. pygmaeus), P = 0.4228 (vector vs. D. pennatus), P = 0.8150 (A. pymaeus vs D. pennatus); GAR 32020; A. pygmaeus (N = 6), D. pennatus (N = 6), control (N = 3): P = 0.2724 (vector vs. A. pygmaeus), P = 0.7296 (vector vs. D. pennatus), P = 0.0865 (A. pygmaeus vs D. pennatus); GAR 13585; A. pygmaeus (N = 6), D. pennatus (N = 5), control (N = 3): P = 0.0012 (vector vs. A. pymaeus), P = 0.0075 (vector vs. D. pennatus), P = 0.3902 (A. pymaeus vs D. pennatus). Source Data
Extended Data Fig. 5
Extended Data Fig. 5. Emx2 is upregulated for a prolonged period and specifically expressed in the lateral skin mesenchyme.
a, Differential gene expression between patagium and shoulder skin (Data corrected for multiple comparisons; FDR < 0.1) from postnatal day 6 (P6) to P10 (left) and P11 to P15 (right). Yellow represents genes more highly expressed in the patagium; pink are genes more highly expressed in the shoulder; grey are genes without differential expression. b, Immunohistochemistry for EMX2 in sugar glider tissue prior to patagium outgrowth (P1) and as outgrowth begins (P5). Scale bars in b: 500 μm (zoomed out) and 100 μm (zoomed in).
Extended Data Fig. 6
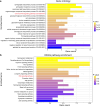
Extended Data Fig. 6. Gene Ontology (top) and KEGG pathway (bottom) enrichment analysis for genes downregulated in patagia injected with shRNAEmx2-3.
Wnt signalling (shown in red font) was significantly enriched in both analyses. Data corrected for multiple comparisons; FDR < 0.5). Source Data
Extended Data Fig. 7
Extended Data Fig. 7. Spatial expression and function of Emx2 in mice.
a, Transversal sections of E11.5 laboratory mouse showing expression of Emx2 in the Wolffian ridge. b, Immunohistochemistry showing the distribution of EMX2 in the skin of PdfgraCreERT2/+/RosaEmx2-GFP/+ double transgenic animals and control littermates. c, d, Relative to control littermates, double transgenic mice over-expressing Emx2 in dermal fibroblasts show a significant increase in epidermal thickness, as seen by H&E stains (c) and cellular proliferation, as established by EdU incorporation (d). Statistical significance in panel d (N = 4; P = 0.0009) was assessed using a general mixed effects model one-way ANOVA test. Dotted line in c,d denotes the dermis-epidermis boundary. Mean + SE are plotted in d. Scale bars: 500 µm (zoomed out) and 100 µm (zoomed in) in (a); 100 µm in b-d. Source Data
Extended Data Fig. 8
Extended Data Fig. 8. Wnt5a overexpression promotes cell proliferation in mouse skin.
Induction of Wnt5a in postnatal day 37 laboratory mice results in a significant increase in cellular proliferation, as measured by EdU incorporation (Mean + SE). Shown are comparisons between double transgenic (R26rtTAHET;tetO-Wnt5aHET) and control littermates R26rtTAHET;wt/wt. Statistical significance (N = 4; P = 5.9 × 10⁻⁵) was assessed using a general mixed effects model one-way ANOVA test. Dotted line delineates the dermis-epidermis boundary. Scale bars: 100 µm. Source Data
Extended Data Fig. 9
Extended Data Fig. 9. Conservation analysis and lab mouse LacZ transgenic assays of Glider Accelerated Regions (GARs).
a, b, LacZ transgenic assays in E9.5 and E11.5 laboratory mouse embryos. Shown is the schematic of the construct and insertion site used to test GAR activity (a) and results from the assays (b). E11.5 embryos in (b) show expected neural tube staining from basal Shh promoter activity (black arrowheads). Scale bars: 500 µm (E9.5) and 1000 µm (E11.5). c, Conservation scores for genomic regions surrounding GARs and visualized against the reference sugar glider sequence as a heatmap (darker colours indicate higher conservation). Labelled in red are GARs that showed functional activity through luciferase assays, whereas GARs in black are those that did not. d, Opossum (Monodelphis domestica) genomic region containing the Emx2 locus and all Emx2-associated GARs. All Emx2-associated GARs have high-confidence orthologous matches with the opossum. Only the GAR located in the Emx2 promoter had a high-confidence orthologous match with eutherian genomes (Mus musculus and Homo sapiens). The orientation of this region in opossum is inverted with respect to the other species.

References

    1. Carroll SB. Evo-devo and an expanding evolutionary synthesis: a genetic theory of morphological evolution. Cell. 2008;134:25–36. doi: 10.1016/j.cell.2008.06.030. - DOI - PubMed
    1. Stern DL. Evolutionary developmental biology and the problem of variation. Evolution. 2000;54:1079–1091. - PubMed
    1. Davidson EH, Erwin DH. Gene regulatory networks and the evolution of animal body plans. Science. 2006;311:796–800. doi: 10.1126/science.1113832. - DOI - PubMed
    1. Wittkopp PJ, Kalay G. Cis-regulatory elements: molecular mechanisms and evolutionary processes underlying divergence. Nat. Rev. Genet. 2012;13:59–69. doi: 10.1038/nrg3095. - DOI - PubMed
    1. Zhen Y, Aardema ML, Medina EM, Schumer M, Andolfatto P. Parallel molecular evolution in an herbivore community. Science. 2012;337:1634–1637. doi: 10.1126/science.1226630. - DOI - PMC - PubMed

Publication types

MeSH terms

Substances