. 2024 May;629(8012):688-696.
doi: 10.1038/s41586-024-07328-w. Epub 2024 Apr 24.

Transient loss of Polycomb components induces an epigenetic cancer fate

Affiliations

Transient loss of Polycomb components induces an epigenetic cancer fate

V Parreno et al. Nature. 2024 May.

Abstract

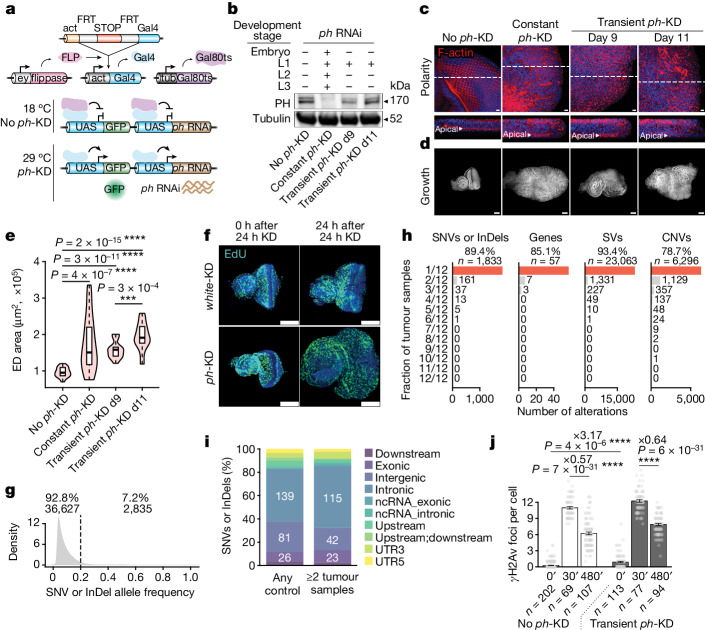
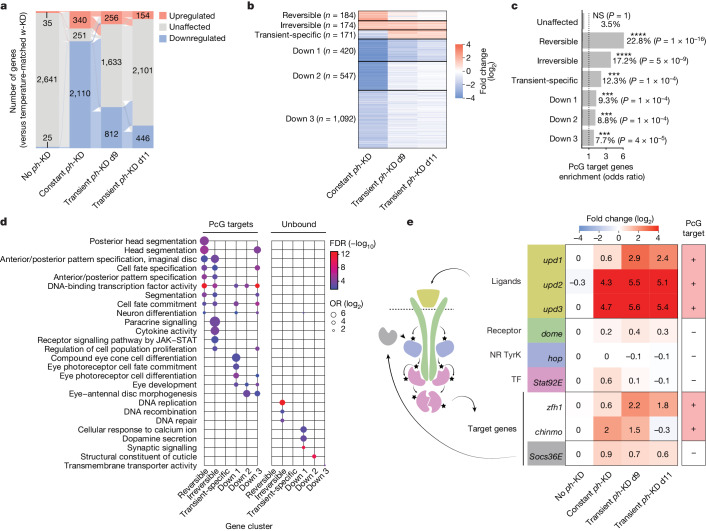
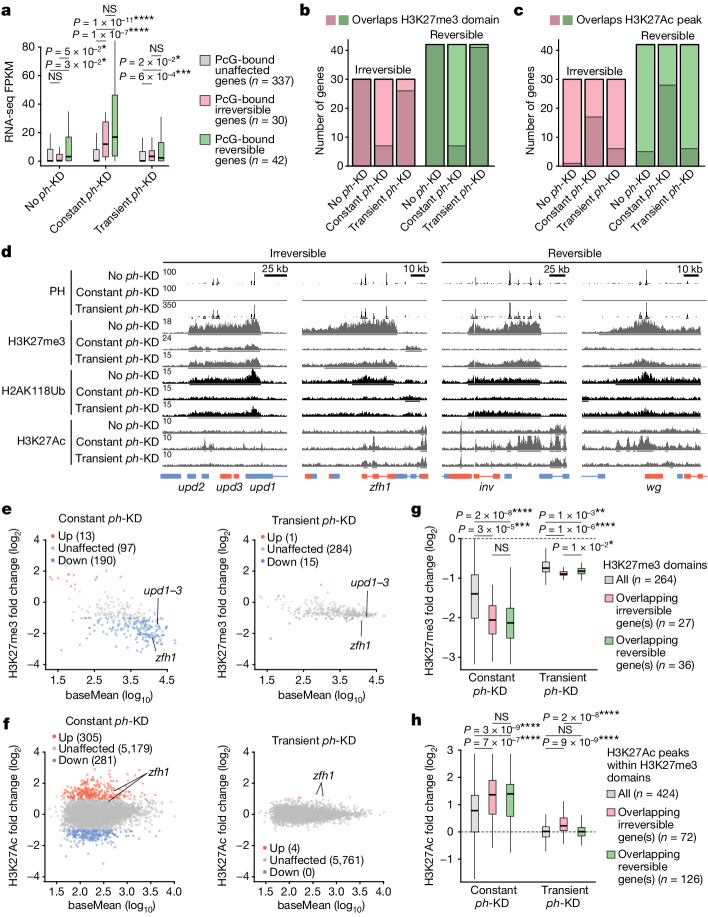
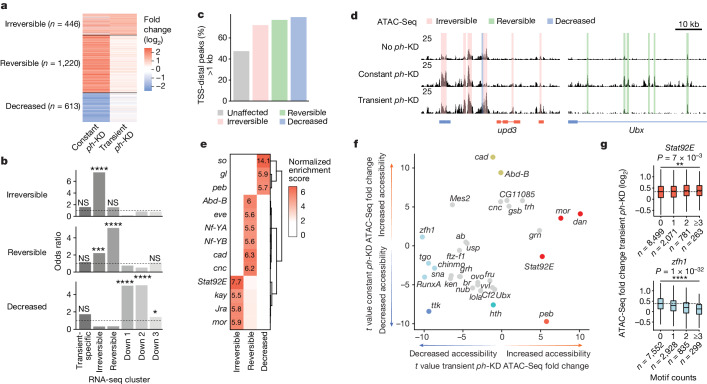
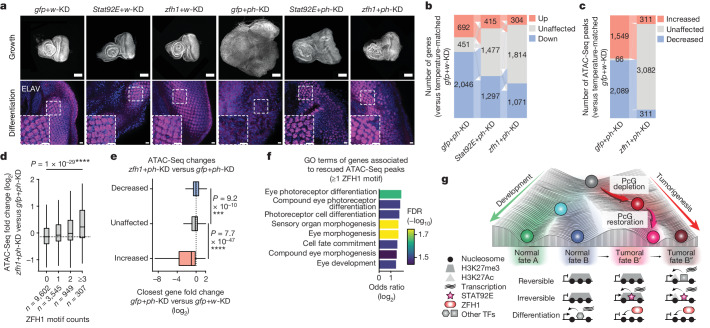
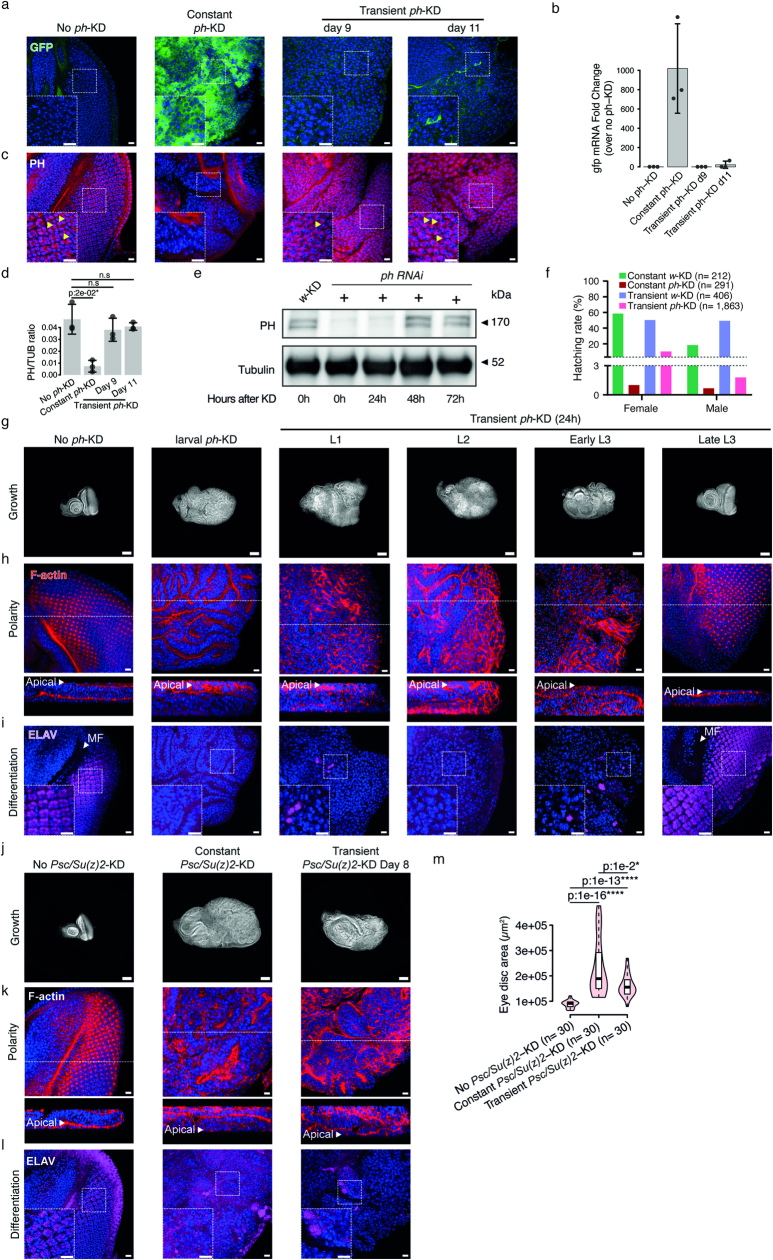
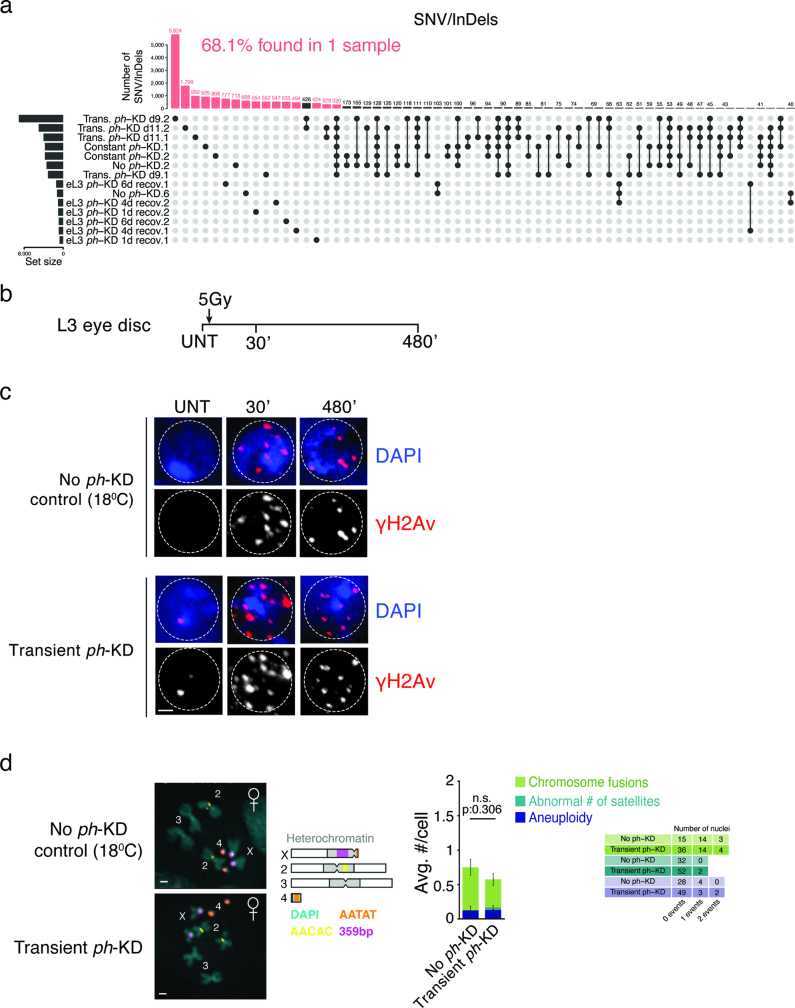
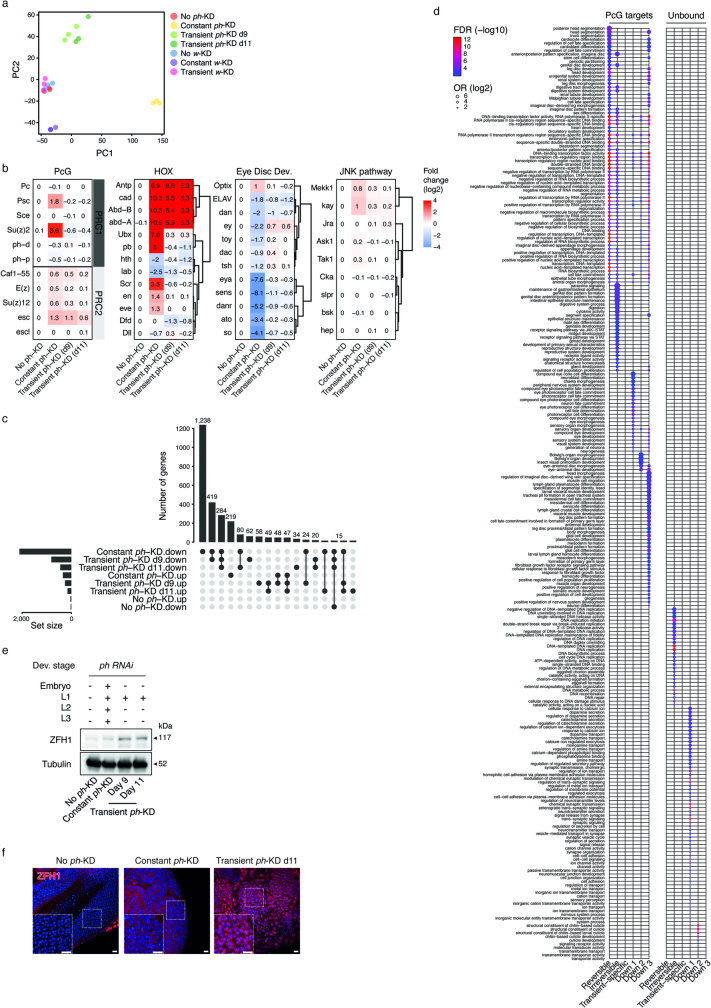
Although cancer initiation and progression are generally associated with the accumulation of somatic mutations1,2, substantial epigenomic alterations underlie many aspects of tumorigenesis and cancer susceptibility3-6, suggesting that genetic mechanisms might not be the only drivers of malignant transformation7. However, whether purely non-genetic mechanisms are sufficient to initiate tumorigenesis irrespective of mutations has been unknown. Here, we show that a transient perturbation of transcriptional silencing mediated by Polycomb group proteins is sufficient to induce an irreversible switch to a cancer cell fate in Drosophila. This is linked to the irreversible derepression of genes that can drive tumorigenesis, including members of the JAK-STAT signalling pathway and zfh1, the fly homologue of the ZEB1 oncogene, whose aberrant activation is required for Polycomb perturbation-induced tumorigenesis. These data show that a reversible depletion of Polycomb proteins can induce cancer in the absence of driver mutations, suggesting that tumours can emerge through epigenetic dysregulation leading to inheritance of altered cell fates.


Conflict of interest statement

The authors declare no competing interests.

Figures

Fig. 1
Fig. 1. Transient PRC1 depletion is sufficient to initiate tumours.
a, Scheme depicting the conditional ph-KD system (Methods). b, Western blot analysis of PH protein concentrations in the EDs of L3 larvae subjected to no ph-KD (control), constant or transient ph-KD at L1 stage. c, Representative confocal images of F-actin staining (red) showing a polarized epithelium with apical F-actin (xz cross-sections at the bottom) in no ph-KD (control, left), whereas polarity is disrupted on constant or transient ph-KD EDs (dissected at L3 stage). DNA is stained with DAPI (blue). d,e, DAPI staining (d) is used to measure ED areas (e) under no ph-KD (control), constant or transient ph-KD conditions (n = 30 EDs per condition; two-sided Wilcoxon test: ***P < 1 × 10−3, ****P < 1 × 10−5; box plots show the median (line), upper and lower quartiles (box) ±1.5× interquartile range (whiskers); outliers are not shown). f, EdU staining (green) imaged at 0 h (left) and 24 h (right) after 24 h of w-KD (control, top) or ph-KD (bottom). g, Distribution of somatic SNVs or InDel allele frequencies detected in all samples. h, Number of tumour samples in which each SNVs or InDels, gene with deleterious SNVs or InDels, structural variants (SVs) and CNVs were found. i, Feature distribution of SNVs or InDels found in any of the control samples (no ph-KD, left bar) or shared between at least two tumour samples (right bar). j, Number of γH2Av foci per cell before (0 min; indicated as 0′) and after (30 and 480 min, indicated as 30′ and 480′) exposure to 5 Gy irradiation in control (no ph-KD, left) or transient ph-KD EDs (right). Individual data points are shown in grey and bars correspond to the mean ± standard error (whiskers). Two-sided t-test ****P < 1 × 10−5. Scale bars, 10 μm (c), 100 μm (d,f).
Fig. 2
Fig. 2. EICs show irreversible transcriptional changes.
a, Alluvial plot showing differentially expressed genes after no ph-KD (control), constant and transient ph-KD. Transitions between upregulated (orange), unaffected (grey) and downregulated (blue) states are indicated by thin lines of the same respective colours. b, Clustering of differentially expressed genes after constant or transient ph-KD. c, Over-representation of direct PcG target genes (defined as more than or equal to 50% of the gene body overlapping a H3K27me3 repressive domain in control condition). One-sided Fisher’s exact test P values were corrected for multiple testing using FDR: ***FDR < 1 × 10−3, ****FDR < 1 × 10−5; NS, P > 0.05. d, Representative Gene Ontology terms enriched for each gene cluster, further stratified as being direct PcG targets (left) or not (right). The full chart is available in Extended Data Fig. 3d. e, Transcriptional fold changes of genes involved in the JAK–STAT signalling pathway on ph-KD. Direct PcG targets (+) are indicated in the right column.
Fig. 3
Fig. 3. PcG repressive landscape is restored after transient ph-KD.
a, Fragments per kilobase of transcript per million mapped reads (FPKM) of irreversible (pink), reversible (green) and unaffected (grey) genes that are direct PcG targets. Two-sided Wilcoxon test: *P < 5 × 10−2, ***P< 1 × 10−3, ****P < 1 × 10⁻⁵, NS, P > 0.05. Box plots show the median (line), upper and lower quartiles (box) ±1.5× interquartile range (whiskers), outliers are not shown. b, Number of irreversible (pink) and reversible (green) genes overlapping an H3K27me3 domain (more than or equal to 50% of the gene body) after no ph-KD (control), constant or transient ph-KD. c, Number of irreversible (pink) and reversible (green) genes overlapping at least one H3K27Ac peak (in the gene body or up to 2.5 kb upstream of the TSS) after no ph-KD (control), constant or transient ph-KD. d, Screenshot of PH ChIP–seq, H3K27me3, H2AK118Ub and H3K27Ac CUT&RUNs tracks at representative irreversible (left) or reversible (right) loci under the indicated conditions (left). e,f, For H3K27me3 domains (e) and H3K27Ac peaks (f), fold changes are shown as a function of their average-normalized counts across all samples (baseMean) for constant (left) or transient (right) ph-KD conditions. Significant changes are highlighted using a colour code (colour legend). g, The H3K27me3 fold changes (between constant or transient ph-KD and no ph-KD conditions) at H3K27me3 domains that are found in the control sample (no ph-KD) and overlap irreversible (pink) or reversible (green) genes. All H3K27me3 domains are shown for reference (grey). Two-sided Wilcoxon test: *P < 5 × 10−2, **P < 1 × 10−2, ***P < 1 × 10−3, ****P < 1 × 10−5, NS, P > 0.05. Box plots show the median (line), upper and lower quartiles (box) ±1.5× interquartile range (whiskers), outliers are not shown. h, The H3K27Ac fold changes at H3K27Ac peaks overlapping the H3K27me3 domains found in control sample (no ph-KD) and overlapping the irreversible (pink) or reversible (green) genes. All H3K27Ac peaks overlapping control H3K27me3 domains are shown for reference (grey). Two-sided Wilcoxon test: ****P <1 × 10−5, NS. P > 0.05. Box plots show the median (line), upper and lower quartiles (box) ±1.5× interquartile range (whiskers), outliers are not shown.
Fig. 4
Fig. 4. Chromatin accessibility changes underlie reversible and irreversible transcriptional changes.
a, Clustering of ATAC-Seq peaks showing significant changes after constant or transient ph-KD. b, Over-representation of genes associated with irreversible (top), reversible (middle) or decreased (bottom) ATAC-Seq peaks, for each of the six RNA-seq clusters defined in Fig. 2b. One-sided Fisher’s exact test P values were corrected for multiple testing using FDR: *FDR < 5 × 10−2, ***FDR < 1 × 10−3, ****FDR < 1 × 10−5, NS, P > 0.05. Exact FDR values: 2 × 10−1, 4 × 10−23, 1 × 10−1, 1 × 100, 1 × 100, 1 × 100 (irreversible); 4 × 10−1, 2 × 10−5, 2 × 10−34, 1 × 100, 1 × 100, 3 × 10−1 (reversible), 8 × 10−2, 1 × 100, 1 × 100, 2 × 10−21, 5 × 10−32, 1 × 10−2 (decreased). c, Fraction of TSS-distal peaks per cluster (greater than 1 kb). d, Screenshot of ATAC-Seq tracks after no ph-KD (control, top), constant (middle) or transient (bottom) ph-KD, at the irreversibly upregulated upd3 gene (left) and the reversibly upregulated Ubx gene (right). e, Normalized enrichment scores of DNA binding motifs found at each cluster of ATAC-Seq peaks (±250 bp, x axis). f, Linear model t values of DNA binding motifs associated with increased (positive t values) or decreased (negative t values) accessibility after transient (x axis) or constant ph-KD (y axis). Only motifs with a significant P < 1 × 10−5 in at least one of the two linear models are shown. g, Fold changes at ATAC-Seq peaks (y axis) on transient ph-KD, as a function of the number of Stat92E (left, in orange) or zfh1 (right, in blue) motifs that they contain (x axis). Two-sided Wilcoxon test: **P < 1 × 10−2, ****P < 1 × 10−5. Box plots show the median (line), upper and lower quartiles (box) ±1.5× interquartile range (whiskers), outliers are not shown.
Fig. 5
Fig. 5. Tumour development requires STAT92E and ZFH1.
a, DAPI (top, in grey) and neuronal differentiation marker ELAV (bottom, in magenta) stainings of EDs after constant KD of the following components: gfp+w, Stat92E+w, zfh1+w, gfp+ph, Stat92E+ph and zfh1+ph (top labels). Two independent biological replicates were performed with similar results. Scale bars: 100 μm (DAPI), 10 μm (ELAV). b, Number of differentially expressed genes after gfp+ph-KD (tumours), Stat92E+ph-KD and zfh1+ph-KD. Transitions between upregulated (orange), unaffected (grey) and downregulated (blue) states are indicated by thin lines of the same respective colours. c, Number of ATAC-Seq peaks showing significant accessibility changes after gfp+ph-KD or zfh1+ph-KD. Transitions between increased (orange), unaffected (grey) and decreased (blue) states are indicated by thin lines of the same respective colours. d, Fold changes at ATAC-Seq peaks between zfh1+ph-KD and gfp+ph-KD, depending on the number of ZFH1 motifs they contain (x axis). Two-sided Wilcoxon test, ****P < 1 × 10−5. Box plots show the median (line), upper and lower quartiles (box) ±1.5× interquartile range (whiskers), outliers are not shown. e, RNA-seq fold changes on gfp+ph-KD (x axis) of genes associated with ATAC-Seq peaks that are decreased (in blue), unaffected (in grey) or increased (in orange) after zfh1+ph-KD compared to gfp+ph-KD (y axis). Two-sided Wilcoxon test: ****P < 1 × 10−5. Box plots show the median (line), upper and lower quartiles (box) ±1.5× interquartile range (whiskers), outliers are not shown. f, Top enriched Gene Ontology (GO) terms for genes associated with ATAC-Seq peaks containing at least one ZFH1 motif and showing significantly increased accessibility after zfh1+ph-KD compared to gfp+ph-KD. g, Schematic illustration showing that PcG depletion triggers an epigenetic switch to a cancer fate. Resulting cancers persist after the PcG protein is restored, and their maintenance is associated with stable transcriptional changes supported by the STAT92E activator and the ZFH1 repressor.
Extended Data Fig. 1
Extended Data Fig. 1. Transient PRC1 depletion generates neoplastic tumours that persist after PH protein recovery.
a- GFP staining (in green) used as a readout of the conditional ph knockdown (ph-KD) system described in Fig. 1a after no ph-KD (control), constant or transient ph-KD. The tissues were counterstained with DAPI (blue). Two independent experiments were performed with similar results. b- gfp mRNA fold change RT-qPCR measurement after no ph-KD (control), constant or transient ph-KD. Bars correspond to the mean ± standard deviation (whiskers) inferred from three biological replicates (grey dots). c- PH immunostaining (in red) after no ph-KD (control), constant or transient ph-KD. The tissues were counterstained with DAPI (blue). Two independent experiments were performed with similar results. d- Quantification of the western blot illustrated in Fig. 1b and of two other biological replicates. Bars correspond to the mean ratio ±standard deviation (whiskers) of the signal of PH over that of TUBULIN (PH/TUB) calculated from three biological replicates (grey dots). Two-sided unpaired t.test: *pval < 0.05, ns = pval > 0.05 (not significant). Error bars represent the standard error of the mean for three biological replicates. Dunnet’s test: ns = not significant, **pval < 0.01. e- Western blot showing the PH protein after early L3 EDs were subjected to 24 h of white-KD (w-KD, control) or ph-KD followed by 0 h, 24 h, 48 h and 72 h of recovery at 18 °C (see bottom axis). This time course illustrates acute depletion and allows visualization of the kinetics of PH recovery after ph-KD. f- Hatching rate after constant or transient ph-KD. g-i- DAPI (in grey, g), F-actin (in red, h) and ELAV (in magenta, i) stainings of L3 EDs after no ph-KD (control), ph-KD throughout the three larval stages (L1, L2, L3) or transient (24 h) ph-KD during the first (L1), second (L2), early (Early L3) or late (Late L3) of the L3 stage, respectively. DAPI staining is used to assess ED growth, F-actin for apico-basal polarity, and the neuronal marker ELAV for differentiation. Note that late L3 tissues look normal immediately after the end of the ph-KD. Nevertheless, their cells are reprogrammed into a malignant state, as indicated by the fact that allografts of these tissues induce tumours, as shown in Extended Data Fig. 7i, j. Two independent experiments were performed with similar results. Scale bars: 10 μm (a, c, h, i), 100 μm (g). j-l- DAPI (in gray, j), F-actin (in red, k) and ELAV (in magenta, l) stainings of EDs after no Psc/Suz(2)-KD (control, left), constant (middle) or transient Psc/Suz(2)-KD (right), respectively. DAPI staining is used to assess growth, F-actin for apico-basal polarity, and the neuronal marker ELAV for differentiation. Two independent experiments were performed with similar results. m- ED sizes quantified as overall area of DAPI staining after no Psc/Suz(2)-KD (control), constant or transient Psc/Suz(2)-KD conditions. n = 30 for each condition. Two-sided Wilcoxon test: *pval < 5e-2, ****pval<1e-5. Box plots show the median (line), upper and lower quartiles (box) ±1.5x interquartile range (whiskers), outliers are not shown. Scale bars: 100 μm (j), 10 μm (k, l).
Extended Data Fig. 2
Extended Data Fig. 2. ph-KD does not induce the accumulation of mutations or aneuploidy.
a- SNV/InDels overlaps between all sequenced gDNA samples. Each vertical bar corresponds to an intersection (corresponding samples are shown below) and horizontal bars (bottom left) indicate the total number of SNV/InDels found in each sample. Only intersections containing ≥40 SNV/InDels are shown and SNV/InDels that are specific to one sample are shown in orange (68.1% of all SNV/InDels detected). b- Schematic view of the repair kinetic experiments. γH2Av foci were counted before or 30 min and 480 min after ionizing radiation (IR). c- Representative γH2Av staining in no ph-KD (control, top) and transient ph-KD EDs (bottom). Nuclei were counterstained with DAPI (in blue). d- Representative karyotypes (left) and quantification of chromosome abnormalities in EDs after no ph-KD (control, top) and transient ph-KD (bottom). The schematic representation shows the position of the satellites stained by FISH. Abnormalities were quantified from two biological replicates per condition (bar plot on the right, n = 32 for No ph-KD and n = 53 for ph-KD karyotypes). Bars correspond to the mean number of aberrations per cell ±standard error (whiskers). Two-sided t.test: ns = pval>0.05 (not significant). For each type of type of abnormality (see colour legend), the number of counted events are shown on the right (tables). Scale bars = 1 μm (c, d).
Extended Data Fig. 3
Extended Data Fig. 3. Transcriptional defects after constant or transient ph-KD include induction of ZFH1.
a- Principal component analysis (PCA) of normalized RNA-Seq read counts for different conditions. Each dot corresponds to one biological replicate. A close distance between samples reflects their similarity, showing that the control samples (no w-KD, no ph-KD) and the transient w-KD are very similar. b- Transcriptional fold changes after no ph-KD (control), constant or transient ph-KD (see x-axis) of the PcG core components, Hox genes (canonical targets of PcG repression), key genes that regulate ED development and the JNK pathway core members. c- Overlaps of differentially expressed genes between indicated RNA-Seq samples. Each vertical bar corresponds to an intersection (corresponding samples are shown below) and horizontal bars (bottom left) indicate the total number of differentially expressed genes in each sample. d- GO terms enriched for each gene cluster, then stratified as being direct PcG targets ( ≥ 50% of the gene body overlaps a H3K27me3 repressive domain) in control condition (left) or not (right). e- Western blot showing ZFH1 levels in EDs after no ph-KD (control), constant or transient ph-KD. Three independent experiments were performed with similar results. f- ZFH1 immunostaining (in red) after no ph-KD (control), constant or transient ph-KD. Tissues were counterstained with DAPI (in blue). Two independent experiments were performed with similar results. Scale bars: 10 μm.
Extended Data Fig. 4
Extended Data Fig. 4. The PcG epigenetic landscape is globally re-established after transient ph-KD.
a- PH ChIP-Seq (top row), H3K27me3 (2nd row), H2AK118Ub (3rd row) and H3K27Ac (bottom row) CUT&RUN average tracks, anchored at the TSS of the PcG-bound irreversible (in pink), reversible (in green) and unaffected genes (in gray) after no ph-KD (control, left), constant (middle) or transient ph-KD (right). For each condition, the average signal is shown (solid line) ± standard error (shaded area). The distance to the TSS is shown on the x-axis. The signal was quantified at the regions highlighted by dashed lines (see corresponding boxplots on the right). Box plots show the median (line), upper and lower quartiles (box) ±1.5x interquartile range (whiskers), outliers are not shown. Two-sided Wilcoxon test: *pval < 0.05; n.s = pval > 0.05 (not significant). Although PH binding is significantly stronger at TSSs of reversible genes in control conditions, this small difference is not reflected in significant changes in the H3K27me3 and H2AK118Ub repressive marks. Binding is strongly reduced in constant depletion but it is restored after a transient depletion. b- The PH peaks, the H3K27me3 (PRC2-deposited repressive mark) and H2AK118Ub (PRC1-deposited repressive mark) domains overlaps are shown, after no ph-KD (control), constant or transient ph-KD. Each vertical bar corresponds to an intersection (the corresponding conditions are shown below) and the horizontal bars (bottom left) indicate the total number of peaks/domains detected in each sample. To avoid weak and noisy peaks/domains, we focused on domains containing at least one PH peak and on PH peaks overlapping H3K27me3 domains in control sample. c- Differential analysis of H2AK118Ub domains that show unaffected (gray), decreased (blue) or increased (orange) enrichment upon constant (top) or transient ph-KD (bottom). d- Each bar corresponds to an H3K27me3 domain containing at least one irreversible (pink) or reversible (green) gene. For each domain, the number of irreversible (pink), reversible (green) and unaffected genes (gray) are shown. Generally, domains containing reversible genes do not contain irreversible ones and vice versa. e- Average PH ChIP-Seq signal around PH peak summits (x-axis) after no ph-KD (top), constant (middle) or transient ph-KD (top). PH peaks were stratified based on the closest TSS with a maximum of 25 kb distance. Peaks assigned to irreversible and reversible peaks are shown in pink and in green, respectively. For each condition, the average signal is shown (solid line) ± standard error (shaded area). The distance to the TSS is shown on the x-axis. The signal was quantified at the regions highlighted by dashed lines (see corresponding boxplots on the right). Box plots show the median (line), upper and lower quartiles (box) ±1.5x interquartile range (whiskers), outliers are not shown. Two-sided Wilcoxon test: n.s = pval > 0.05 (not significant).
Extended Data Fig. 5
Extended Data Fig. 5. Analysis of transcription factors in EICs shows that transient Stat92E-KD and zfh1-KD are sufficient to substantially rescue transient ph-KD neoplastic signatures.
a- Fold changes at ATAC-Seq peaks (y-axis) upon constant (left) or transient (right) ph-KD, as a function of the number of caudal (cad) motifs they contain (x-axis). Box plots show the median (line), upper and lower quartiles (box) ±1.5x interquartile range (whiskers), outliers are not shown. Two-sided Wilcoxon test: ****pval < 1e-5, n.s = pval>0.05 (not significant). b- ED areas upon constant depletion of STAT92E and ZFH1, alone or in addition to PH depletion. Areas are measured using DAPI-stained tissues (number of measured EDs is reported in brackets). Box plots show the median (line), upper and lower quartiles (box) ±1.5x interquartile range (whiskers), outliers are not shown. c-e DAPI (gray, c), F-actin (red, d) and ELAV (magenta, e) stainings of EDs after transient gfp-KD (control), Stat92E-KD and zfh1-KD in the presence of a concomitant, transient depletion of white (w-KD, control, first three columns) or ph (ph-KD, last three columns). DAPI staining was used to assess growth, F-actin staining was used for apico-basal polarity and the neuronal marker ELAV for differentiation. Two independent experiments were performed with similar results. f- ED sizes quantified as overall DAPI staining area for different conditions, showing that transient Stat92E-KD or zfh1-KD decreased ED overgrowth associated with transient ph-KD. Box plots show the median (line), upper and lower quartiles (box) ±1.5x interquartile range (whiskers), outliers are not shown. Two-sided Wilcoxon test: **pval < 1e-2, ***pval < 1e-3, ****pval < 1e-5. Scale bars: 100 μm (c), 10 μm (d, e).
Extended Data Fig. 6
Extended Data Fig. 6. Description and validation of the conditional genetic tool allowing long-term tracking of cells subjected to constant or transient ph-KD.
a- Schematic overview of the thermosensitive ph-RNAi genetic system used in allograft experiments. Unlike the system described in Fig. 1a (conditional GFP expression), this one ubiquitously expresses GFP under the control of the Ubi-p63E promoter (constitutive GFP expression), while RFP expression is a readout of ongoing RNAi KD. b- Comparison of differentially expressed genes after no ph-KD (control), constant or transient ph-KD between the two genetic systems, allowing either the conditional (x-axis) or the constitutive (y-axis) expression of GFP. For each intersection, the corresponding number of genes is indicated (see numbers). Similarity between the two systems was assessed using chi-squared tests (see p.values on top) and chi-squared standardized residuals are shown using heat maps’ colour code. The more an intersection exceeds the size that would be expected by chance, the higher the standard residuals. c-f- PH (in red, c), F-actin (in red, d), ELAV (in magenta, e) and RFP (in red, f) stainings of EDs after no ph-KD (control, left), constant (middle) or transient ph-KD (right), respectively. PH staining was used to visualize PH loss and recovery under constant and transient conditions. F-actin is used to analyse apico-basal polarity, the neuronal marker ELAV for differentiation and RFP as a conditional marker for induction of the RNAi system. The tissues were counterstained with DAPI (blue). Two independent experiments were performed with similar results. g- Normalized read counts of mRFP1 mRNAs after no ph-KD (control), constant or transient ph-KD, showing that transcriptional expression of RFP occurs at constant 29 °C exposure but returns to basal levels after transient ph-KD. For each condition, mean normalized read counts ±standard deviation (whiskers) were inferred from three biological replicates of RNA-Seq (grey dots). h- GFP staining (in green) after no ph-KD (control), constant or transient ph-KD. GFP is constitutively expressed after transient ph-KD. The tissues were counterstained with DAPI (in blue). i- Normalized read counts of GFP mRNAs after no ph-KD (control), constant or transient ph-KD, showing that GFP expression is irreversibly induced after transient ph-KD. For each condition, mean normalized read counts ±standard deviation (whiskers) were inferred from three biological replicates of RNA-Seq (grey dots). Scale bars: 10 μm (c, d, e, f, h).
Extended Data Fig. 7
Extended Data Fig. 7. Comparative analysis of tumour growth by serial transplantation of constant and transient ph-KD EICs.
a- Schematic overview of the experimental allograft workflow. Flies of the same genotype were subjected to no ph-KD (control, 18 °C), constant ph-KD (29 °C) or transient ph-KD (24h ph-KD at 29 °C during L1 stage). L3 EDs expressing constitutive GFP were dissected from donor larvae and repeatedly allografted into the abdomen of host flies for 10 consecutive rounds until T10 of transplantation (T10≈ 3 months). All allograft experiments were performed at 18 °C to avoid ph-RNAi expression after transplantation. b-c- Tumour growth measured as the percentage of flies showing tumour progression 20 days after transplantation (b) or surviving 20 days after each allograft (c) constant (purple) or transient (blue) ph-KD tumours for 10 rounds of transplantation (x-axis). d- Tree representation of the allograft assay. A primary ED tumour derived from constant or transient ph-KD is dissected from L3 donor larvae and repeatedly allografted into the abdomen of a female host maintained at 18 °C to prevent re-expression of-ph-RNAi. Each injected fly is monitored every two days. When the host fly abdomen is completely filled with GFP positive cells, the host is dissected and the tumour cells are injected again into multiple hosts. The procedure was repeated until the tenth generation (T10). e- Host lifespan (x-axis) after the first transplantation (T1) of control (no ph-KD, in black), constant (in purple) or transient (in blue) ph-KD tumours. Statistical significance was assessed using log-rank test. f- Host lifespan (x-axis) after the fifth (T5) and the tenth (T10) rounds of transplantations of constant (T5 in pink, T10 in purple) or transient (T5 in light blue, T10 in blue) ph-KD tumours. Since control (no ph-KD) tissues do not grow and cannot be serially transplanted, PBS injections were used as control (in black). Statistical significance was assessed using log-rank test. g- Flies injected with dissected grafts after no ph-KD (control), constant or transient ph-KD. Only primary tumours generated by constant or transient ph-KD can invade the abdomen and surrounding tissues but not EDs resulting from no ph-KD (control) conditions. h- In order to score the frequency of metastases, the injected flies were monitored twice a week and the appearance of metastases in the thorax, head, proboscis, eyes and legs were noted for each generation. Values in the table represent the number and percentage (in brackets) of flies with metastases after the 1st, 5th or 10th round of transplantation (T1, T5 and T10, respectively) of constant or transient ph-KD tumours. i-j- Tumour growth measured as the percentage of flies showing tumour progression 20 days after transplantation (d) and host fly survival 20 days after allograft of late L3 ph-KD (e) for 5 consecutive rounds of transplantation.
Extended Data Fig. 8
Extended Data Fig. 8. A model explaining the emergence of epigenetically initiated cancers.
The model is based on the well-known Waddington landscape depicting a marble rolling down a slope with multiple choices of trajectories that depend on the hills and valleys encountered on their path. This scheme is a metaphor for the multiple possible cell fates that can arise from a single cell representing the zygote and is frequently used to signify that epigenetic inheritance contributes to the stable transmission of cell fates, once they are determined by intrinsic and extrinsic signals. In the context of this work, we posit that Polycomb components contribute to shaping the landscape and allow for multiple normal cell fates to be established and transmitted through the developmental process. In normal development, the cells (in green) at the top of the hill will move down during differentiation in order to acquire normal fates (left panel). Upon depletion of a Polycomb component, such as the PRC1 subunits PH or PSC, the landscape is modified (center panel). If depletion is stably maintained, the modified landscape forces cells to take a path that is both aberrant and intrinsically stable, inducing cancer formation through loss of cell differentiation, loss of cell polarity and sustained proliferation (upper right panel). If Polycomb protein levels are restored, the landscape returns to its original shape. However, if restoration of the landscape occurs after cells have already chosen an aberrant route (represented by the marble in the middle of the landscape), they will no longer be able to find the healthy trajectory and will be obliged to choose from a limited set of possibilities in a diseased cell space. This may ultimately lead to the maintenance of tumour phenotypes. In addition to the Waddington landscape panels, gene panels are added, representing a putative molecular explanation for the phenomenon described here. The chromatin and functional state of reversible and irreversible genes are shown in each condition. In a physiological condition (left), both categories of genes are bound by Polycomb components and are decorated by repressive histone marks, such as H3K27me3. Upon depletion of Polycomb components such as PH, both the Polycomb complexes and their histone marks are lost and Polycomb target genes acquire active histone mark such as H3K27ac and become transcribed. At irreversible genes, transcriptional activation is dependent on the JAK–STAT signaling pathway transcription factor STAT92E (top right). Upon PRC1 re-establishment, the repressive mark and PH binding is globally recovered. However, chromatin stays open at specific sites that regulate irreversible genes, in which a DNA motif bound by the main JAK–STAT effector STAT92E is enriched. STAT92E target genes include proliferation components and zfh1, which encodes a transcription factor that represses transcription of a set of genes involved in cell differentiation. The combined, self-sustaining induction of cell proliferation and loss of differentiation induces tumorigenesis even after restoration of normal levels of Polycomb proteins on their target chromatin (bottom right, see also Fig. 5g).
Extended Data Fig. 9
Extended Data Fig. 9. Examples of the tumour suppressive role of canonical PRC1 core subunits in different cancer types.
a- Clinical correlations for PRC1 in selected cancer types. Differential gene expression (TNMplot) and clinical prognosis Kaplan-Meier plot (KMplot) results are given for PHC1, PHC2, PHC3, CBX6, CBX7 genes. TNMplot columns represent the differential gene expression analysis in tumour and matched normal tissues, which was performed using the https://tnmplot.com/ online tool. FC median: Fold change median. Statistical significance was calculated using a two-sided Mann-Whitney U test with a significance level of 0.01. NS – non-significant Mann–Whitney p-value. Green boxes indicate that gene expression is significantly lower in tumour tissues. KMplot columns show the analysis of correlation between overall survival (OS) and levels of gene expression. KMplot analysis was performed using the https://kmplot.com/ online tool. Statistical significance was calculated by a two-sided Cox regression test with a significance level of 0.05. NS – non-significant logrank p-values. Green boxes (“Good”) indicate cases in which high expression of PRC1 genes in tumours is associated with a better overall patient survival. b- Clinical prognosis for PHC1 (left) and CBX7 (right) in bladder cancer. For each gene the TNMplot (Violin plots, left panels) and KM plots (right panels) are shown. c- Clinical prognosis of PHC1 (left) and CBX7 (right) in breast cancer. For each gene the TNMplot (Violin plots, left panels) and KM plots (right panels) are shown. d- Clinical prognosis of PHC1 (left) and CBX7 (right) in lung adenocarcinoma. For each gene the TNMplot (Violin plots, left panels) and KM plots (right panels) are shown. e–f Clinical prognosis of PHC3 (e) in ovarian and PHC1 (f) in prostate cancer. For each gene the TNMplot (Violin plots, left panels) and KM plots (right panels) are shown. The Violin plots display the range of values from the minimum to the maximum value, with the box representing the values from the first quartile to the third quartile. The median is indicated by the thick line in the center, and the width of the plot, or density, reflects the frequency of the samples. In KMplots, the cohort with low gene expression level is coloured black and the cohort with high gene expression is coloured red. HR: hazard ratio.
Extended Data Fig. 10
Extended Data Fig. 10. Tumour suppressive role of core PRC1 subunits in Multiple Myeloma.
a- PHC1, PHC2, PHC3 and CBX2 gene expression is significantly downregulated in malignant plasma cells (PCs) from patients with Multiple Myeloma (MM cells) compared to normal bone marrow PCs. Affymetrix U133 P gene expression profiles of purified bone marrow PC from 22 healthy donors and purified myeloma PCs from 345 previously untreated patients were compared using publicly available data (Gene Expression Omnibus, accession number GSE2658) from the University of Arkansas for Medical Sciences (UAMS, Little Rock, AR). Statistical difference was assayed using a two-sided Student t test. b- Prognostic value of core PRC1 components in MM. The prognostic value of PHC1, PHC2, PHC3, CBX2, CBX7, and BMI1 gene expression was analyzed in 6 independent cohorts of patients with MM using the Maxstat R function and Kaplan Meier survival curves as previously described. Low expression of PHC1, PHC2, PHC3, CBX2, CBX7 and BMI1 was associated with significantly shorter overall survival in at least three independent cohorts of MM patients out of the six studied (green colour). The six cohorts included gene expression data of purified MM cells from the TT2, TT3 (accession number E-TABM- 1138; GSE2658), and Hovon (accession number GSE19784) cohorts (345, 158 and 282 newly-diagnosed MM patients treated by high-dose melphalan and autologous hematopoietic stem cell transplantation); the Mulligan cohort (188 patients at relapse treated by proteasome inhibitor in monotherapy; GSE9782); the Mtp cohort non eligible to HDT (63 newly-diagnosed MM patients non eligible to high-dose melphalan and autologous hematopoietic stem cell transplantation) and the Mtp Dara cohort (51 patients at relapse treated by anti-CD38 monoclonal antibody (Daratumumab). c- The prognostic information of PHC1, PHC2, PHC3, CBX2, CBX7 and BMI1 genes was combined. Patients of the TT2 cohort (n = 345) were ranked according to the increased value of the calculated score and a cluster was defined. d- In the TT2 cohort, a maximum difference in overall survival was obtained, using the Maxstat R package, splitting patients into high-risk for 144 patients with the lowest expression of PRC1 genes and low-risk group for the 201 patients with higher PRC1 gene expression. Using the same parameter of the TT2 training cohort, we validated the association between low expression of PRC1 genes and a poor outcome in five other independent cohorts of patients with MM.

References

    1. McGranahan N, Swanton C. Biological and therapeutic impact of intratumor heterogeneity in cancer evolution. Cancer Cell. 2015;27:15–26. doi: 10.1016/j.ccell.2014.12.001. - DOI - PubMed
    1. Vogelstein B, et al. Cancer genome landscapes. Science. 2013;339:1546–1558. doi: 10.1126/science.1235122. - DOI - PMC - PubMed
    1. Brock A, Chang H, Huang S. Non-genetic heterogeneity—a mutation-independent driving force for the somatic evolution of tumours. Nat. Rev. Genet. 2009;10:336–342. doi: 10.1038/nrg2556. - DOI - PubMed
    1. Flavahan WA, Gaskell E, Bernstein BE. Epigenetic plasticity and the hallmarks of cancer. Science. 2017;357:eaal2380. doi: 10.1126/science.aal2380. - DOI - PMC - PubMed
    1. Marine JC, Dawson SJ, Dawson MA. Non-genetic mechanisms of therapeutic resistance in cancer. Nat. Rev. Cancer. 2020;20:743–756. doi: 10.1038/s41568-020-00302-4. - DOI - PubMed

MeSH terms