. 2024 May;629(8011):443-449.
doi: 10.1038/s41586-024-07350-y. Epub 2024 Apr 24.

Discovery of WRN inhibitor HRO761 with synthetic lethality in MSI cancers

Affiliations

Discovery of WRN inhibitor HRO761 with synthetic lethality in MSI cancers

Stephane Ferretti et al. Nature. 2024 May.

Abstract

The Werner syndrome RecQ helicase WRN was identified as a synthetic lethal target in cancer cells with microsatellite instability (MSI) by several genetic screens1-6. Despite advances in treatment with immune checkpoint inhibitors7-10, there is an unmet need in the treatment of MSI cancers11-14. Here we report the structural, biochemical, cellular and pharmacological characterization of the clinical-stage WRN helicase inhibitor HRO761, which was identified through an innovative hit-finding and lead-optimization strategy. HRO761 is a potent, selective, allosteric WRN inhibitor that binds at the interface of the D1 and D2 helicase domains, locking WRN in an inactive conformation. Pharmacological inhibition by HRO761 recapitulated the phenotype observed by WRN genetic suppression, leading to DNA damage and inhibition of tumour cell growth selectively in MSI cells in a p53-independent manner. Moreover, HRO761 led to WRN degradation in MSI cells but not in microsatellite-stable cells. Oral treatment with HRO761 resulted in dose-dependent in vivo DNA damage induction and tumour growth inhibition in MSI cell- and patient-derived xenograft models. These findings represent preclinical pharmacological validation of WRN as a therapeutic target in MSI cancers. A clinical trial with HRO761 (NCT05838768) is ongoing to assess the safety, tolerability and preliminary anti-tumour activity in patients with MSI colorectal cancer and other MSI solid tumours.


Conflict of interest statement

M.C.-C., H.V., C.Q., L.L., J.S., M.W., E.B., F.Z., E.G., E.D., S.W., S.B. and F.S. are employees of Novartis Pharma and hold stock in Novartis, Alcon and Sandoz. H.M., R.d.K., J.B., M.R., N.D.N., C.S., J. Hamon, M.S., A.H., S.F., M.H., R.A.-R., G.K., A.D., M.D., C.H., V.R., H.-J.M. and V.B. are employees of Novartis Pharma and hold stock in Novartis and Sandoz. I.J. and J. Hinrichs are employees of Novartis Pharma and hold stock in Novartis. R.S. is an employee of Novartis Pharma. F.H. and E.J.N. are employees of Pierre Fabre and hold stock in Novartis. HRO761 is covered by patent WO2022/249060 with the following co-authors listed as inventors: V.B., A.D., J. Hamon, J. Hinrichs, H.M., J.S., R.S. and F.Z. Additional patent applications related to WO2022/249060 are pending.

Figures

Fig. 1
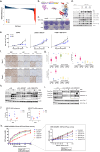
Fig. 1. Identification and structural basis of HRO761, an allosteric WRN inhibitor.
a, Screening funnel with hit count on the left and progression criteria on the right leading to the identification of hit 1. HTS, high-throughput screening; Kd, dissociation constant; NMR, nuclear magnetic resonance; SPR, surface plasmon resonance. b, The structure of hit 1 and medicinal chemistry optimization to clinical candidate 4, HRO761, with key profiling data of compounds 24 (cell lipE calculated from SW48 proliferation GI50 and the distribution coefficient between 1-octanol and water at pH 7.4 (logD), apparent permeability in low-efflux Madin–Darby canine kidney cells (MDCK LE Papp, 10−6 cm s−1), oral bioavailability (F) and structure based drug design (SBDD)). c, HRO761 is an allosteric inhibitor of the WRN helicase binding at the D1–D2 interface in a novel conformation involving a 180° rotation of the D1 and D2 domains relative to ATPγS-bound WRN (ligands are shown as sticks with transparent surface). d, Owing to the overlap with the D2 ATP half-site, the HRO761-binding site is unusually polar and rich in arginine residues. HRO761 makes extensive polar interactions and engages key residues of the flexible hinge (Thr728-Gly-Phe-Asp-Arg). e, Overlay of the D2 domains of ATPγS- and HRO761-bound WRN showing that HRO761 displaces the Walker motif (green) and its catalytic residue Lys577 through mimicry of the ATP γ-phosphate, including coordination of the hydrolytic water by Gln850.
Fig. 2
Fig. 2. WRN inhibitors recapitulate synthetic lethality in MSI but not MSS cells and lead to DNA trapping.
a, Representative survival curve of SW48 (MSI) and CAL33 (MSS) cells exposed to HRO761 for 4 days (CellTiter-Glo). Data are the mean ± s.d. percentage change compared with the DMSO control group. n = 3. b, The colony-formation assay (CFA) GI50 for HRO761 treatment in MSI (red, n = 20) and MSS (blue, n = 8) cells versus the ATARIS WRN dependency score (DRIVE). Right, representative CFA images of HTC116 and LS513 cells after 10 days. c, PS50 versus GI50 for HRO761 treatment in MSI (red) and MSS (blue) cells in the CellTiter-Glo assay. HCT116 and RKO cells with a C727A or C727S knock-in mutation at the WRN gene are shown in light and dark green, respectively. n = 28 (MSI) and n = 5 (MSS). d, Immunoblot analysis of WRN, phosphorylated ATM (pATM; Ser1981), pCHK2 (Thr68), p53, p21, γH2AX and actin after treatment with HRO761 for 24 h (WRN) or 8 h (other markers). e, Immunoblot analysis of the chromatin-bound fraction (CBF) and soluble nuclear extracts (SNE) of MSI and MSS cells treated with HRO761 at 10 µM for 1 h. f, Volcano plot showing P values (paired t-tests) plotted against median log2[fold change] of protein levels of three MSI cells (top) and one MSS cell (bottom) after treatment with compound 3 for 24 h (n = 2). g, The sensitivity to HRO761 was determined using a CFA, and WRN degradation was analysed after treatment with HRO761, camptothecin (CPT) or etoposide (ETO) in 15 cell lines. The compound concentration needed to achieve 50% WRN degradation (DEG50; left) and maximal degradation (Dmax; right) are shown. h, Differentially expressed genes in bulk RNA-seq data from cells treated with compound 2 (cases) compared with untreated cells (controls). Statistical significance was determined using two-sided Wald tests (in DEseq2), followed by Benjamini–Hochberg multiple-testing correction (n = 3). Padj, adjusted P.
Fig. 3
Fig. 3. WRN inhibition leads to cell cycle arrest and DNA damage in a time- and dose-dependent manner, independently of p53.
a, Immunoblot analysis of WRN, pATM (Ser1981), pCHK2 (Thr68), pKAP1 (Ser824), pATR (Tyr1989), pCHK1 (Ser345), p21, γH2AX and actin in HCT116 cells after 24 h of treatment with HRO761 at the concentration indicated at the top. b, CDKN1A (encoding p21), GDF15, CENPA and KIF20A mRNA levels were quantified by quantitative PCR with reverse transcription (RT–qPCR) in HCT116 cells treated with HRO761 as described. Data are mean ± s.d. percentage expression compared with the DMSO treatment group. n = 3. c,d, γH2AX immunofluorescence (c) and cell cycle analysis (d) in HCT116 cells after treatment with either DMSO or HRO761 at 10 µM for 24 h. Cell cycle analysis showing DAPI staining (top) and DAPI against phosphorylated histone H3 (bottom). Immunofluorescence data are from one representative experiment out of three. Scale bar, 50 µm. e, Time course of PD modulation quantified as the amount of HRO761 required to induce 300% phosphorylation (IND300) of DDR markers or 50% WRN degradation compared with DMSO. Western blot images are shown in Extended Data Fig. 5. f, Survival curves of HCT116 TP53 wild-type (WT) or HCT116 TP53−/− cells exposed to HRO761 for 5 days (top). The cell viability was estimated using the CellTiter-Glo assay. Data are mean ± s.d. percentage of surviving cells compared with DMSO treatment. n = 3 biological replicates. Bottom, representative image of a 14 day CFA. g,h, Immunoblot analysis of WRN, pATM (Ser1981), pCHK2 (Thr68), p53, MDM2, p21, BBC3, pCDK1 (Tyr15), CDK1 and actin (g) and RT–qPCR analysis of CDKN1A, GDF15, BBC3 and CENPA (h) in HCT116 TP53 WT (blue) or HCT116 TP53−/− (green) cells exposed to HRO761 for 24 h. Data are mean ± s.d. percentage expression compared with the DMSO treatment group. n = 3 biological replicates.
Fig. 4
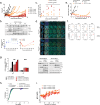
Fig. 4. In vivo pharmacological proof of concept of WRN synthetic lethality with HRO761.
a, The therapeutic response to HRO761 in mice bearing SW48 xenografts. Mice were treated for 92 days with vehicle (n = 5) or HRO761 (orally, once daily) at doses up to 120 mg per kg. Mouse body weight was measured from the treatment start. Data are mean ± s.e.m. b, Free HRO761 blood concentrations (n = 3) at day 7 and 91 (mouse unbound faction = 19.3%) (left); unbound GI90 (0.16 µM and in vitro unbound fraction = 37%) is represented as a dotted line. Right, the correlation between efficacy and unbound blood area under the curve (AUCb,u) above the SW48 cell unbound GI90. Data are mean ± s.e.m. (left). c, Immunoblot analysis of WRN, pATM (Ser1981), pCHK2 (Thr68), total CHK2, pKAP1, p21 and actin from SW48-tumour bearing mice (n = 3) treated daily with 20 and 60 mg per kg and euthanized and sampled 4 h after the last treatment from day 1 to day 21 (top). Bottom, CDKN1A, GDF15, CENPA and KIF20A mRNA levels were quantified by RT–qPCR. Data are mean ± s.e.m. percentage expression compared with the DMSO control group. d, WRN and pCHK2 expression were evaluated on SW48 xenograft FFPE sections using immunohistochemistry. Scale bars, 50 µm. Replicate information is provided in the ‘Statistics and reproducibility’ section of the Methods. e, Best average response from multiple MSI xenograft models (n = 5–7) after treatment with HRO761 at 60 or 120 mg per kg according to the model. f, Incucyte-generated confluence plots from SW48 cells exposed to a combination of HRO761 and irinotecan (irinot.) at the indicated concentrations. The graph is a representative experiment of n = 3 experiments. g, SW48 tumour xenograft growth of mice (n = 5–6) treated with HRO761 at 20 mg per kg, irinotecan (intravenous, weekly) or a combination of HRO761 with a decreasing dose of irinotecan from 60 to 15 mg per kg (left), or HRO761 at 40 mg per kg or a combination of HRO761 with a decreasing dose of irinotecan from 15 to 5 mg per kg (right). Data are mean ± s.e.m. Source Data
Extended Data Fig. 1
Extended Data Fig. 1. Genetic validation of WRN helicase dependence.
a. WRN ATARIS dependency scores from DRIVE coloured by MSI (high-red and Low-orange) and MSS (blue) status. b. Schematic representation of WRN helicase domains. Clonogenic assay (c) or immunoblot (d) of RKO cells doxycycline induction of a non-targeting negative control (sh2-NT), and one shRNA against WRN (sh19) without (-) or with a wild type (WT), exonuclease mutant (E84A) or helicase mutant (K577A) WRN cDNA. Clonogenic assay shown 15 days and immunoblot 4 days after dox induction. e. RKO xenograft growth ± doxycycline induction of WRN sh19 with WT or helicase dead (K577A) WRN cDNA. Mice were randomized (n = 6). Differences between the means of TVol were assessed on the endpoint ∆TVol using a two-tailed t-test (* P < 0.05, ** P < 0.01 and ns is non-significant). f. Ki67, p21 and cleaved caspase 3 (CC3) expression were evaluated on RKO xenograft sections by immunohistochemistry 7 and 14 days after treatment ± doxycycline and ± WT WRN cDNA. g. Quantification of Ki67, p21 and CC3 positive cells from FFPE sections. The white centre line denotes the median value, while the filled boxes contain the first quartile (25th) and third quartile (75th) percentiles of the dataset. The coloured whiskers mark the 5th and 95th percentiles. h. Immunoblot for WRN, pCHK2, ATM, p21 and actin of RKO tumour ± doxycycline and ± WT WRN cDNA. i. Immunoblot for WRN from samples from panel h treated for 7 and 14 days at different exposures. j. RTqPCR for WRN WT (endogenous) and WRN K577A mutant from tumours treated with doxycycline for 1 and 2 weeks. Data are mean of expression compared to no Dox treatment ± SD, n = 4 tumours. k. Quantification of ADP production over time in an ATPase assay at indicated conditions for both WRN WT and WRN K577A D1D2RH helicase domain protein. Data represent mean ± SD, n = 3. Source Data
Extended Data Fig. 2
Extended Data Fig. 2. HRO761 and related WRN inhibitors are selective WRN inhibitors mixed competitive with ATP and uncompetitive with DNA.
a. Biochemical ATPase IC50 activity and concentration response curves of the WRN inhibitors HRO761 (4), and analogues 2 and 3 on WRN as well as RecQ helicases BLM, RecQ1 and RecQ5. Data represent mean of quadruplicates expressed as %inhibition ± SD. b. Comparison of biochemical ATP binding, ATPase and helicase IC50 across different WRN constructs and mutants (reported IC50 values in a and b are the geometrical means of at least 2 independent experiments., structure of 5 shown on the left.). c. Michaelis-Menten plots of the WRN ATPase assay (0.5 nM WRN D1D2RH, 3 nM ssDNA FLAP26, 50 mM NaCl) at varying concentrations of 4 (for legend, see inset) revealed a non-competitive or mixed mode of action (Lineweaver-Burk plot on the right), interpreted as mixed ATP-competition due to competition in ATP binding assay (b.) d. KDNA determination in the ATPase assay (0.5 nM WRN D1D2RH, 100 µM ATP, 150 mM NaCl, ssDNA: FLAP26) at varying concentrations of 5 (for legend, see inset) revealed a non-competitive or mixed mode of action (double reciprocal plot on the right), interpreted as a non-competitive mode of action due lack of DNA competition in a radioactive binding assay (e.). For c, d, Data represent initial Kobs determined by following the ATPase reaction for 20 min. e. Saturation binding experiments of radiolabeled 6 (structure shown in f.) performed with 10 nM WRN (D1D2RH) in absence (left) or in presence of 50 nM dsDNA (right) using a Scintillation Proximity Assay resulted in a similar Kd (10/14 nM). Data points represent the mean of triplicate ±SD (each experiment was repeated at least twice).
Extended Data Fig. 3
Extended Data Fig. 3. WRN degradation is proteasome and DNA damage mediated.
a. Waterfall plot bar graph display of GI50 values of the 301 Horizon OncoSignature cell line panel. Cells were exposed to HRO761 for 120 h. MSI: red, MSS: blue. b. Immunoblot for WRN, pATM (S1981), pCHK2 (T68), p21 and actin of RKO parental and RKO WRN C727S knock-in cells after treatment of HRO761 for 24 h. Bottom. Representative image of a 15-day CFA of the same cells treated with HRO761. c. Immunoblot for WRN, pATM (S1981), pCHK2 (T68), p53, p21, γH2AX and actin after treatment with etoposide for 24 h. d. Immunoblot for WRN, pATM (S1981), p53 and actin from HCT116 cells treated with compound 3 at 10 µM for 24 h with or without proteasome inhibitor MG132 at 1 µM for 24 h. e. Immunoblot for WRN, pATM (S1981), pCHK2 (T68) and actin after treatment with co-treatment with 1 µM 3 and 1 µM KU-55933 (ATMi) for 24 h in HCT116 cells. f. Survival curves of SW48 cells treated with 96 h with the indicated concentrations of HRO761 (green) and ATMi KU-55933 (grey) alone or the combination of HRO761 dose response with 3.2 µM of KU-55933. Data represent mean ± SD, n = 3 g. Incucyte generated confluence plot from SW48 cells exposed to a combination of HRO761 and ATMi AZD1390 at the indicated concentrations. Data represent mean ± SD, n = 2. Graphs from f and g are from a representative experiment (n = 3). h. Immunoblot after double thymidine block and release of HCT116 cells harvested at the indicated timepoints after release as described in the methods section. Cells were treated with 330 nM nocodazole for 18 h as a control. i. Immunoblot of SW48 and HCT116 cells treated with etoposide or camptothecin at the indicated concentrations (nM) for 24 h.
Extended Data Fig. 4
Extended Data Fig. 4. WRN inhibition induces apoptosis, a p53 response and cell cycle arrest.
a. Results of GSEA Hallmark analysis showing the enriched gene sets from bulk RNASeq analysis of SW48 tumours from mice treated once with 3 at 150 mg/kg and sacrificed/sampled 4 h post treatment. Listed are the top 10 positively and negatively enriched gene sets based on normalized enrichment scores (NES), coloured by statistical significance. Gene sets p-values were calculated using an adaptive, multilevel splitting Monte Carlo approach implemented in the fsgea R package and adjusted for multiple hypothesis testing by the Benjamini–Hochberg method (pAdj). b. P values (pAdj) plotted against log2 fold change of expression from bulk RNASeq analysis of tumours from mice treated once at 150 mg/kg and sacrificed/sampled 4 h post treatment. Statistical significance was determined using a two-sided Wald test statistical analysis (in DEseq2), followed by Benjamini-Hochberg multiple-correction testing (n = 5 mice). c. Signature enrichment plot for p53 hallmark gene set. Source Data
Extended Data Fig. 5
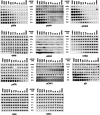
Extended Data Fig. 5. Time course of WRN degradation and DNA damage induction after HRO761 treatment.
Immunoblots for WRN, pATM (S1981), pCHK2 (T68), total CHK2, phospho-KAP1 (S824), pCHK1 (S345), total CHK1, pATR (Y1989), p21, γH2AX and actin during 0.25 h to 24 h of treatment of HCT116 cells with HRO761 at the concentrations indicated. Images from a representative experiment of n = 3.
Extended Data Fig. 6
Extended Data Fig. 6. DNA damage response upon HRO761 treatment in p53 mutant cells.
a. Immunoblot for WRN, pATM (S1981), pCHK2 (T68), pATR (Y1989), pCHK1 (S345), p21, γH2AX and actin of the indicated cells treated with compound 4 for 24 h at the concentrations indicated. b. Immunoblot for WRN, pATM (S1981), pCHK2 (T68), p21 and actin of the indicated cells treated with 4 at 5 µM for the time indicated. GI50 values after 96 h of compound 4 treatment are indicated in nM under the immunoblots.
Extended Data Fig. 7
Extended Data Fig. 7. WRN inhibition induces apoptosis, a p53 response and cell cycle arrest.
a. Xenograft growth of SW48 cells treated p.o. twice daily with compound 3 at 15, 50 or 150 mg/kg. Mice were randomized (n = 7). b. Mean total blood concentration of compound 3 performed on the last day of the efficacy experiment. Data are average of n = 3 mice per time point ± SEM c. Immunoblot for WRN, pATM (S1981), pCHK2 (T68), pATR (Y1989), p21, pH2AX (S139) and actin 3 h post-last treatment with compound 3 on the last day of the efficacy experiment (i.e., day 13 post start of treatment). Source Data
Extended Data Fig. 8
Extended Data Fig. 8. In vivo responses to HRO761 in p53 WT and null cells alone or in combination.
a. Individual SW48 tumour volume data from Fig 4a. b. Immunoblot for WRN, pATM (S1981), pCHK2 (T68), total CHK2, phospho-KAP1 (S824), p21 and actin from SW48-tumour bearing mice (n = 3) treated at 60 mg/kg and sacrificed/sampled at 1, 4, 8 and 24 h post-treatment. Bottom panel p21, GDF15, CENPA and KIF20A mRNA levels were quantified by qRT-PCR. c. Average nuclear area measured in SW48 tumour sections. ** P < 0.01 and **** P < 0.0001, 2-way ANOVA with a Sidak’s multiple comparison test. d. DNA damage response after HRO761 treatment was evaluated on SW48 xenograft FFPE sections by Multiplex Immunofluorescence: DAPI (blue), pCHK2 (green), γH2AX (yellow), p21 (orange), Ki67 (red) and PAN CK (pale blue). e. Tumour xenograft growth in HCT116 TP53 WT or null models treated with HRO761 at 60 mg/kg (n = 6 mice per group). f. Top. qRT-PCR for p21, GDF15, CENPA and KIF20A. Data are mean of expression compared to vehicle control ± SD, n = 3 mice. Bottom. Immunoblot for WRN, pATM (S1981), pCHK2 (T68), total CHK2, pKAP1 (S824), p21 and actin from HCT116-tumour bearing mice (n = 3) treated at 60 mg/kg of HRO761 and sacrificed 4 h post second treatment. g. DNA damage accumulation after HRO761 treatment as SA and in combination with Irinotecan was evaluated by quantification of γH2AX foci formation on SW48 (MSI) and HT29 (MSS) cells. Bars represent the mean of 2 values and is a representative experiment (n = 2). h. Incucyte confluence plots from Cal33 cells treated with HRO761 and irinotecan at indicated concentrations. Graph is a representative experiment (n = 3). i. Body weight (BW) change (%) from the mice treated with the combination of HRO761 at 20 mg/kg and irinotecan doses from 60 to 15 mg/kg (efficacy in Fig. 4g).

Similar articles

Cited by

References

    1. Barretina J, et al. The Cancer Cell Line Encyclopedia enables predictive modelling of anticancer drug sensitivity. Nature. 2012;483:603–607. doi: 10.1038/nature11003. - DOI - PMC - PubMed
    1. McDonald ER, 3rd, et al. Project DRIVE: a compendium of cancer dependencies and synthetic lethal relationships uncovered by large-scale, deep RNAi screening. Cell. 2017;170:577–592. doi: 10.1016/j.cell.2017.07.005. - DOI - PubMed
    1. Behan FM, et al. Prioritization of cancer therapeutic targets using CRISPR-Cas9 screens. Nature. 2019;568:511–516. doi: 10.1038/s41586-019-1103-9. - DOI - PubMed
    1. Lieb S, et al. Werner syndrome helicase is a selective vulnerability of microsatellite instability-high tumor cells. eLife. 2019;8:e43333. doi: 10.7554/eLife.43333. - DOI - PMC - PubMed
    1. Kategaya L, Perumal SK, Hager JH, Belmont LD. Werner syndrome helicase is required for the survival of cancer cells with microsatellite instability. iScience. 2019;13:488–497. doi: 10.1016/j.isci.2019.02.006. - DOI - PMC - PubMed

Publication types

MeSH terms