. 2024 May;629(8012):697-703.
doi: 10.1038/s41586-024-07347-7. Epub 2024 Apr 24.

Mechanism of single-stranded DNA annealing by RAD52-RPA complex

Affiliations

Mechanism of single-stranded DNA annealing by RAD52-RPA complex

Chih-Chao Liang et al. Nature. 2024 May.

Abstract

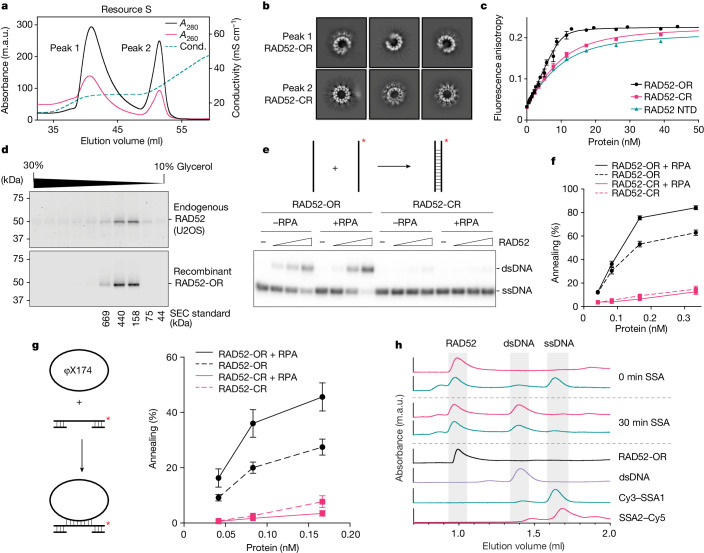
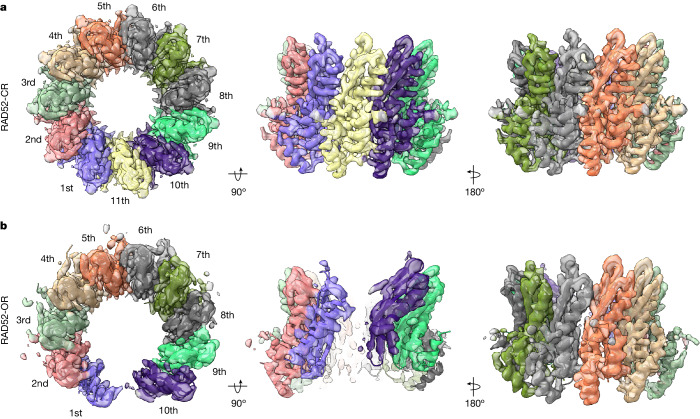
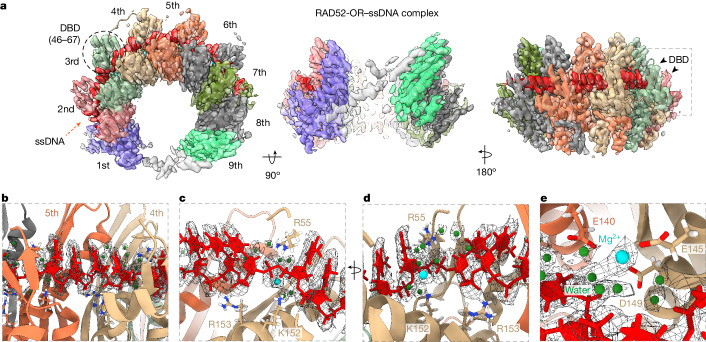
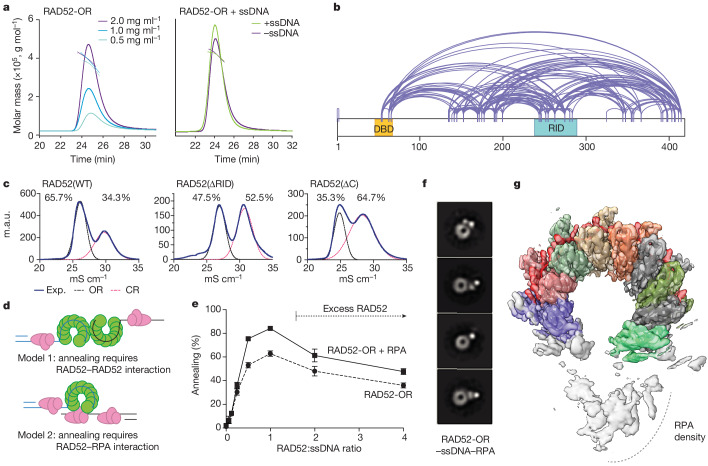
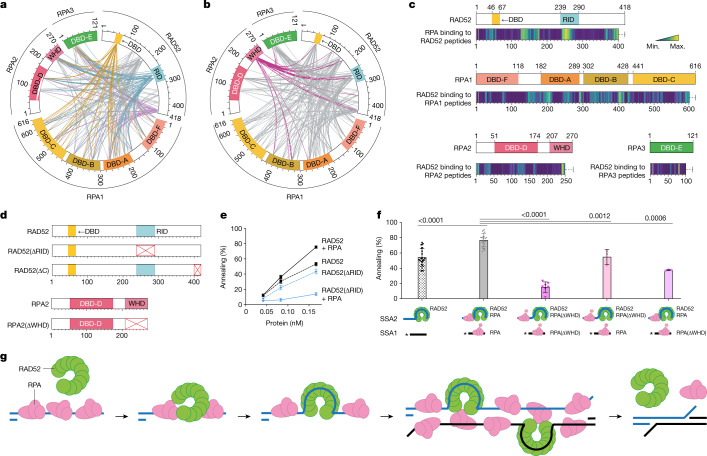
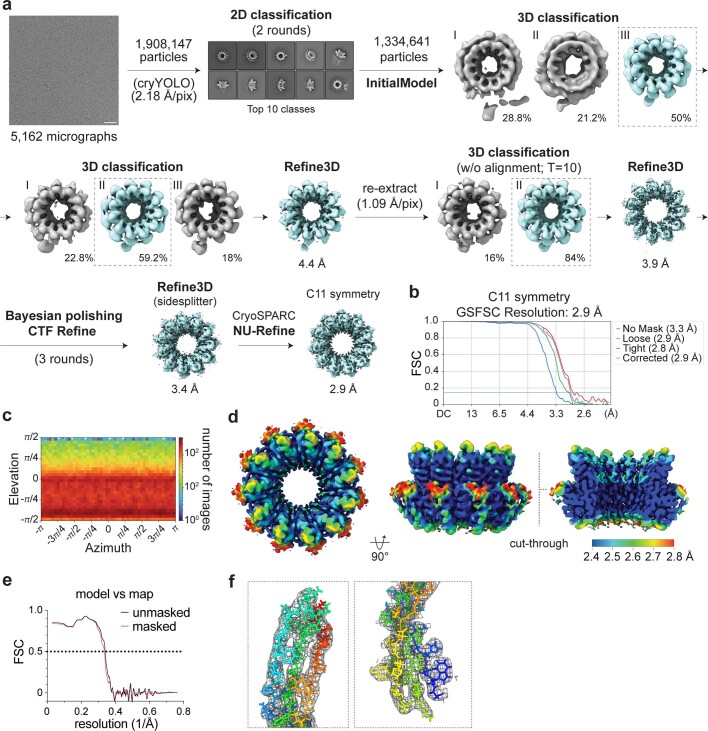
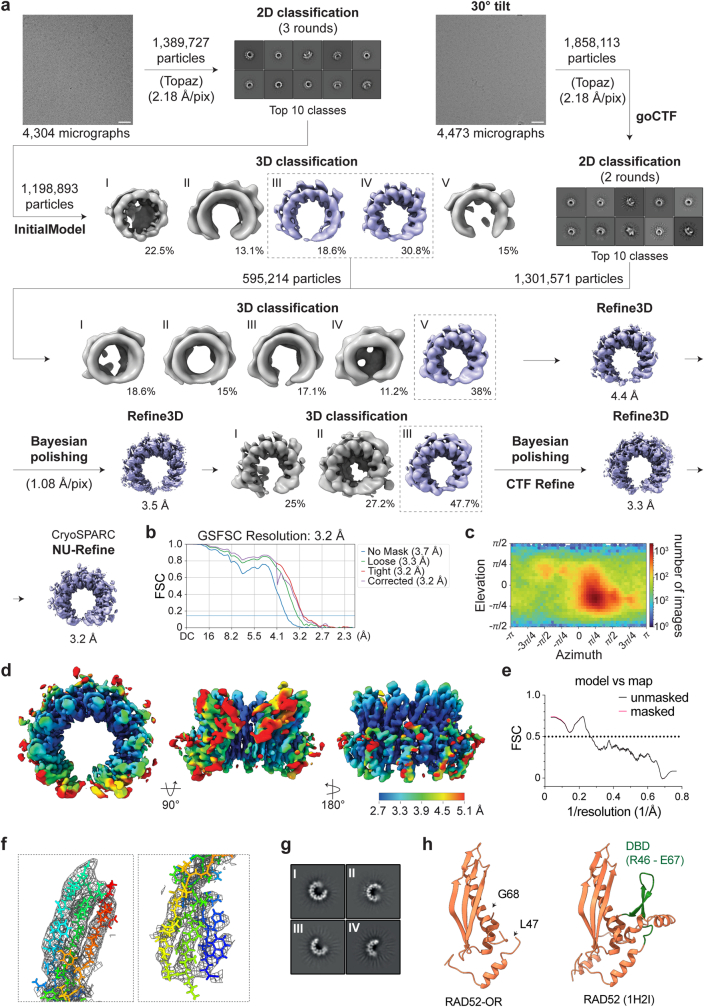
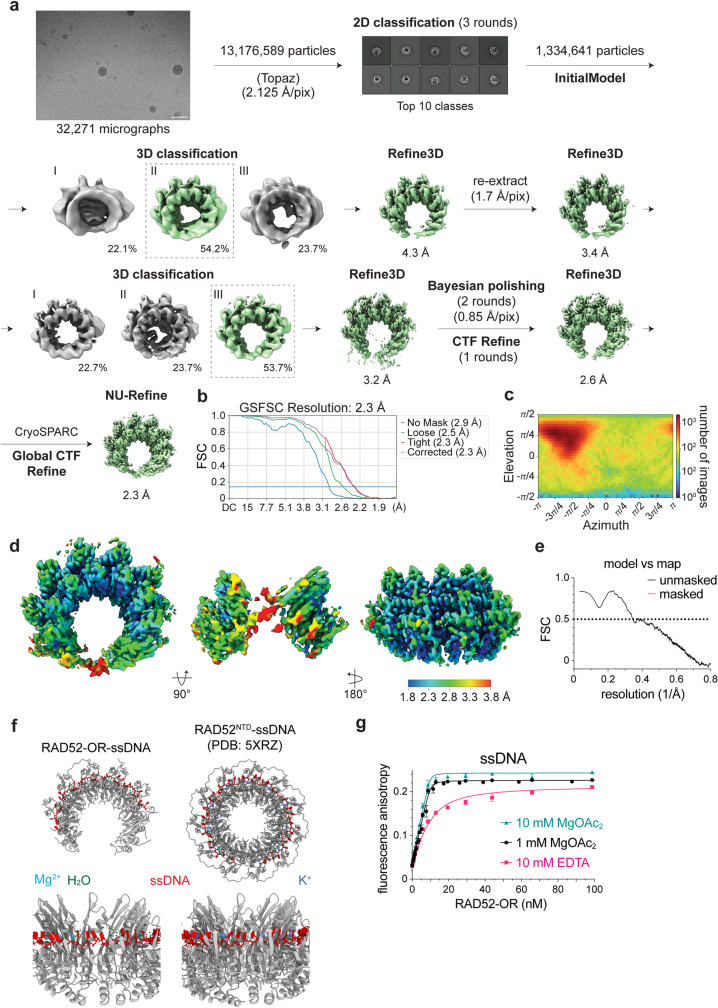
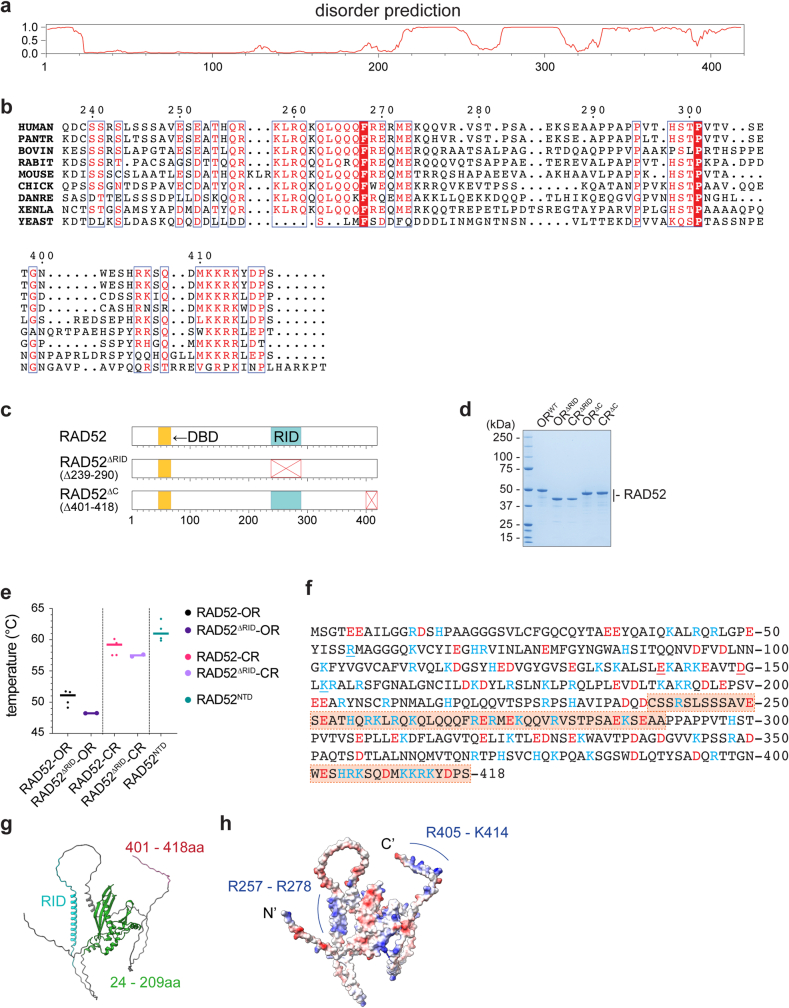
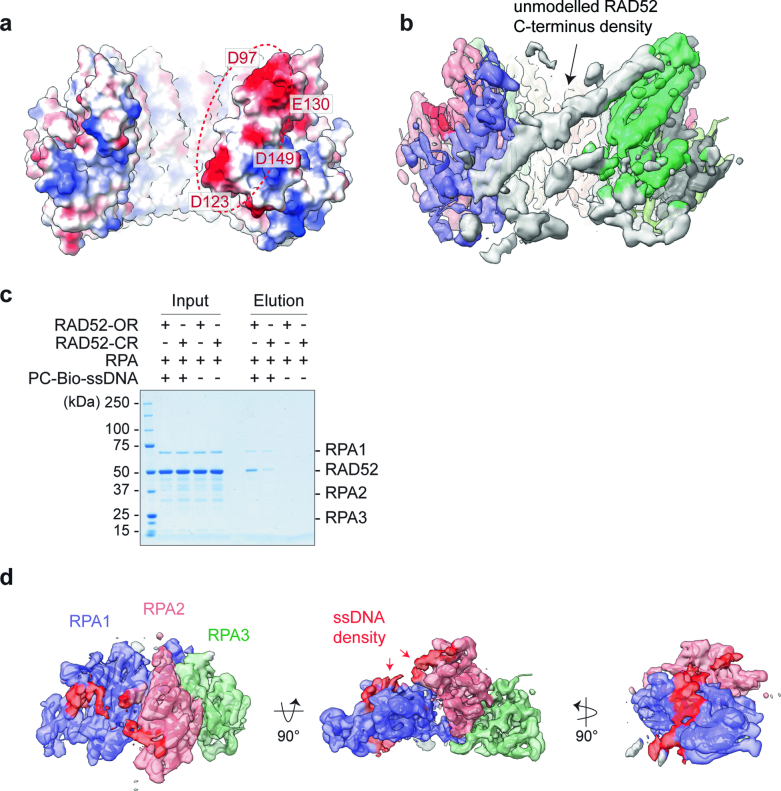
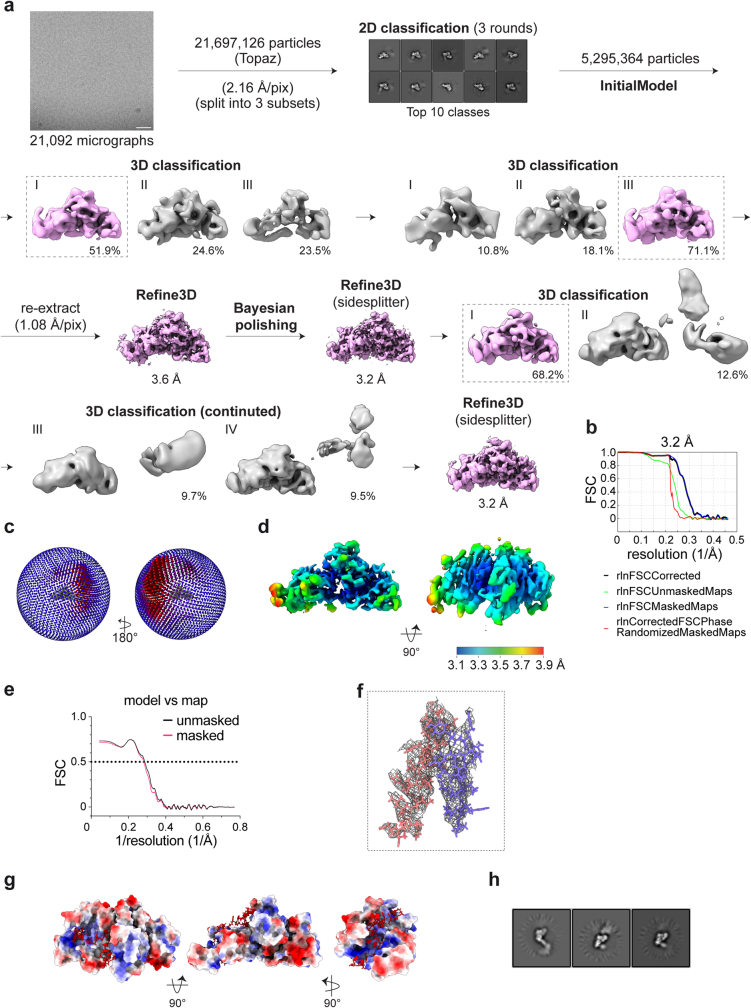
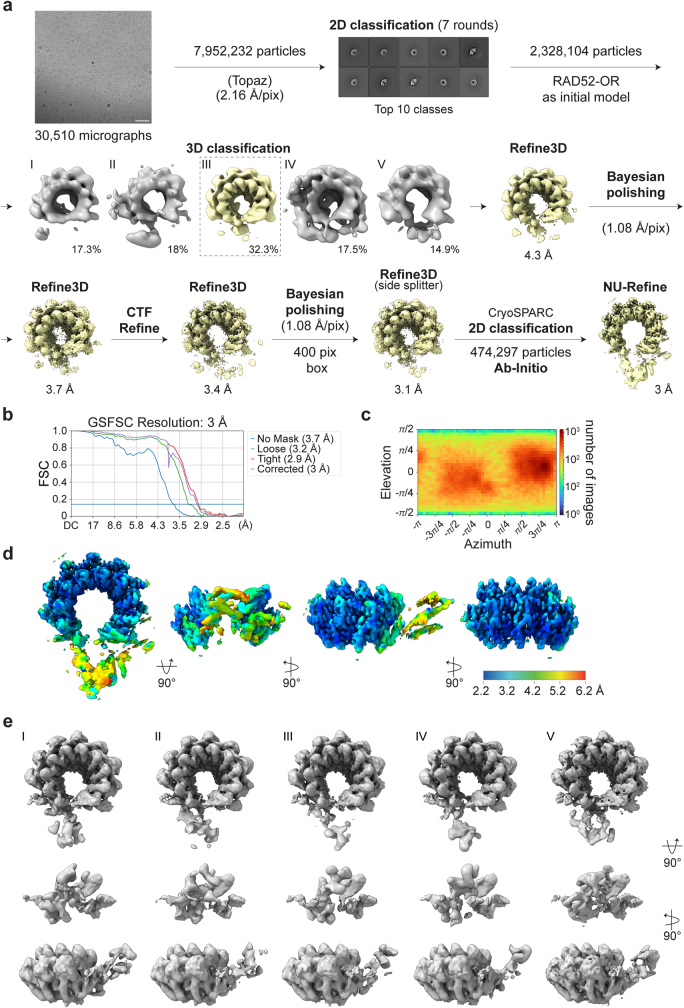
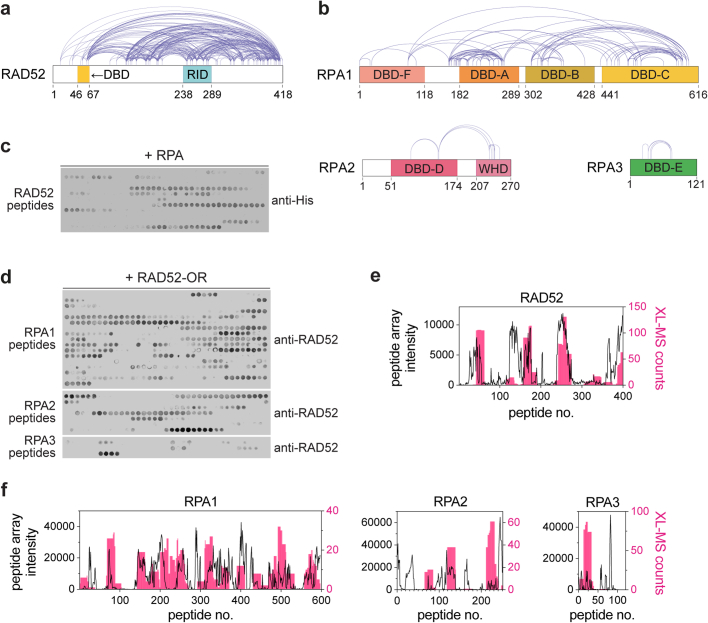
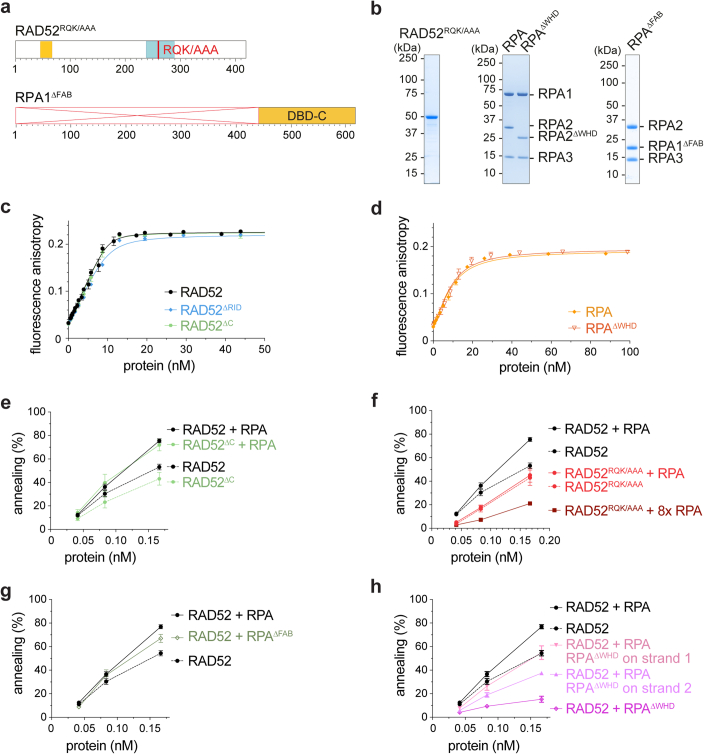
RAD52 is important for the repair of DNA double-stranded breaks1,2, mitotic DNA synthesis3-5 and alternative telomere length maintenance6,7. Central to these functions, RAD52 promotes the annealing of complementary single-stranded DNA (ssDNA)8,9 and provides an alternative to BRCA2/RAD51-dependent homologous recombination repair10. Inactivation of RAD52 in homologous-recombination-deficient BRCA1- or BRCA2-defective cells is synthetically lethal11,12, and aberrant expression of RAD52 is associated with poor cancer prognosis13,14. As a consequence, RAD52 is an attractive therapeutic target against homologous-recombination-deficient breast, ovarian and prostate cancers15-17. Here we describe the structure of RAD52 and define the mechanism of annealing. As reported previously18-20, RAD52 forms undecameric (11-subunit) ring structures, but these rings do not represent the active form of the enzyme. Instead, cryo-electron microscopy and biochemical analyses revealed that ssDNA annealing is driven by RAD52 open rings in association with replication protein-A (RPA). Atomic models of the RAD52-ssDNA complex show that ssDNA sits in a positively charged channel around the ring. Annealing is driven by the RAD52 N-terminal domains, whereas the C-terminal regions modulate the open-ring conformation and RPA interaction. RPA associates with RAD52 at the site of ring opening with critical interactions occurring between the RPA-interacting domain of RAD52 and the winged helix domain of RPA2. Our studies provide structural snapshots throughout the annealing process and define the molecular mechanism of ssDNA annealing by the RAD52-RPA complex.


Conflict of interest statement

The authors declare no competing interests.

Figures

Fig. 1
Fig. 1. Open rings represent the active form of RAD52.
a, Resource S cation-exchange chromatography analysis of recombinant human RAD52. Cond., conductivity. b, Representative cryo-EM 2D class averages of RAD52 open (RAD52-OR) and closed rings (RAD52-CR). c, Single-stranded DNA (40 nucleotides: FAM-SSA4) binding by RAD52-OR, RAD52-CR or RAD52 NTD measured using fluorescence anisotropy. The lines are the best quadratic curve fits. Data are mean + s.e.m. n = 6 (RAD52-OR), n = 3 (RAD52-CR) and n = 3 (RAD52 NTD) independent experiments. d, Glycerol gradient sedimentation analysis of a nuclear extract from U2OS cells compared with recombinant RAD52-OR. RAD52 was detected by western blotting. Gel-filtration protein standards are shown. e, Representative PAGE assay of SSA by the open or closed rings of RAD52 (0, 0.08, 0.17 and 0.33 nM) using 68-nucleotide-long ssDNA (0.33 nM) with or without RPA (0.33 nM). f, Quantification of the SSA assays from e. Data are mean + s.e.m. n = 22 (RAD52-OR and RAD52-OR + RPA) and n = 7 (RAD52-CR and RAD52-CR + RPA) independent experiments. g, SSA using φX174 circular ssDNA and a gapped duplex by RAD52 (OR or CR) in the presence or absence of RPA. Data are mean + s.e.m. n = 4 independent experiments. h, SEC analysis of RAD52-mediated SSA between Cy3–SSA1 (dark cyan, recorded at 647 nm) and SSA2–Cy5 (pink, 555 nm) labelled ssDNAs. RAD52 was preloaded on SSA2–Cy5 before addition of Cy3–SSA1. RAD52-OR (black) was recorded at 280 nm. In e,g32P labels are indicated with asterisks.
Fig. 2
Fig. 2. Cryo-EM structures of RAD52 closed and open rings.
a, Top and side views of the RAD52-CR cryo-EM map (2.9 Å) and atomic model. b, Top and side views of the RAD52-OR cryo-EM map (3.2 Å) and atomic model. RAD52 subunits are numbered successively.
Fig. 3
Fig. 3. Cryo-EM structure of the RAD52–ssDNA complex.
a, Top and side views of the RAD52–ssDNA complex cryo-EM map (2.3 Å) and atomic model. ssDNA is coloured red. The DBD is indicated on the third RAD52 subunit. b, Magnified view showing four ssDNA nucleotides (red) adopting the length of B-form DNA between two RAD52 monomers. c,d, Magnified view of ssDNA binding by Arg55, Lys152 and Arg153. e, Magnified view showing Mg2+ (cyan) and water molecules (green) coordinated by Glu140 (from a neighbouring RAD52 subunit), Glu145 and Asp149. The cryo-EM densities of ssDNA, Mg2+ and water molecules are presented as a mesh.
Fig. 4
Fig. 4. Mechanisms of annealing by RAD52.
a, SEC coupled to multi-angle laser light scattering (SEC–MALLS) analysis measuring the molecular mass of RAD52-OR at different protein concentrations and in the presence or absence of ssDNA. The solid lines are the chromatograms from the output of the differential refractometer and the scatter points are the weight-averaged molar masses determined at 1 s intervals throughout elution of the chromatographic peaks. b, XL-MS analysis of RAD52-ORs. c, Resource S cation chromatography of WT RAD52, RAD52(∆RID) and RAD52(∆C). Experimental ultraviolet 280 nm (UV280) absorbance is depicted as a solid blue line. Deconvoluted peaks are indicated (black lines, open ring; pink lines, closed ring). d, Schematic of the two possible mechanisms for single-stranded annealing: (1) SSA by interactions between two complementary RAD52-bound ssDNAs; and (2) SSA involving interactions between the RAD52–ssDNA complex and complementary-strand ssDNA bound by RPA. e, The effect of RAD52 concentration on ssDNA (0.33 nM; 68 nucleotides) annealing in the presence and absence of RPA (0.33 nM). Data are mean + s.e.m. n = 5 (RAD52-OR and RAD52-OR + RPA) independent experiments. f, Representative negative-stain EM 2D averages of reconstituted RAD52-OR–ssDNA–RPA complex (ssDNA: 68 nucleotides). g, Top view of the RAD52-OR–ssDNA–RPA complex cryo-EM map (3 Å) with the RAD52–ssDNA (68 nucleotides) atomic model.
Fig. 5
Fig. 5. Interactions between the RID of RAD52 and the WHD of RPA2 are important for SSA.
a,b, XL-MS analyses of the RAD52–ssDNA–RPA complex. The circos plots depict cross-links between RAD52-OR and RPA (RPA1, RPA2 and RPA3). Cross-links between the RAD52 DBD and RPA (yellow), the RAD52 RID and RPA (cyan), the extreme C terminus of RAD52 and RPA (light purple) and the WHD (dark pink) are highlighted. c, Peptide arrays of RAD52, RPA1, RPA2 and RPA3 showing interactions between RAD52 and RPA. The detected interaction intensities are shown as heat maps (yellow, maximum (max.) signal; purple, minimum (min.) signal). d, Schematic of RAD52, RAD52(∆RID), RAD52(∆C), RPA2 and RPA2(∆WHD). e, SSA mediated by the indicated proteins. Data are mean + s.e.m. n = 22 (RAD52 and RAD52 + RPA) and n = 3 (RAD52(∆RID) and RAD52(∆RID) + RPA) independent experiments. The ssDNA was 68 nucleotides. f, SSA catalysed by RAD52-OR and RPA or RPA(∆WHD), as indicated in the schematics (WHD deletion is indicated by a red cross). Data are mean ± s.e.m. The concentrations were as follows: 32P-labelled SSA1 and SSA2 (0.33 nM; 68 nucleotides), RPA (0.33 nM) and RAD52 (0.17 nM). All reactions were n = 3, except n = 22 (RAD52 and RAD52 + RPA) and n = 7 (RAD52 + RPA(∆WHD)), where n relates to independent experiments. Statistical analysis was performed using unpaired two-tailed t-tests. g, A model for SSA by interactions between RAD52 and RPA. First, RPA binds to and protects resected ssDNA. Second, RAD52 interacts with RPA-bound ssDNA, and ssDNA wraps around RAD52. The RAD52–ssDNA complex then interacts with RPA–ssDNA, leading to complementary-strand annealing. Finally, RAD52 and RPA dissociate from the annealed dsDNA.
Extended Data Fig. 1
Extended Data Fig. 1. Characterization of human RAD52.
a, Coomassie blue stained SDS-PAGE of the two RAD52 peaks from Resource S cation exchange chromatography (as Fig. 1a). b, Resource S chromatography of human FLAGRAD52 expressed in Sf9 insect cells. c, SDS-PAGE gel showing RAD52NTD (1-209aa). d, Resource S chromatography of RAD52NTD. e, Far-UV circular dichroism (CD) spectra of RAD52 open (OR) and closed rings (CR). Secondary structure content estimates obtained by spectral deconvolution are indicated. f, Intact protein mass spectrometry of RAD52-OR and RAD52-CR. Upper panels: deconvoluted spectra; lower panels: raw spectra. The measured mass of each protein is shown.
Extended Data Fig. 2
Extended Data Fig. 2. Single strand DNA annealing by RAD52.
a, RAD52-OR and RAD52-CR binding to 40 nt long ssDNA (10 nM, FAM-SSA4) or dsDNA (10 nM, FAM-SSA4/SSA5) measured by fluorescence anisotropy. Lines denote best quadratic curve fits. Each point and error bar denotes mean + s.e.m. (RAD52-OR-ssDNA, n = 6; RAD52-CR-ssDNA, n = 3; RAD52-OR-dsDNA, n = 3; RAD52-CR-dsDNA, n = 3). n values are independent experiments. b, RAD52-OR binding to the indicated biotinylated DNAs, as measured by biolayer interferometry. Lines denote 1:1 binding curve fits. Each point and error bar denotes mean + s.e.m. (n = 3). Equilibrium dissociation constants (KD) were: (1) 0.89 ± 0.35 nM, (2) 1.11 ± 0.4 nM, (3) 1.0 ± 0.55 nM and (4) 1.23 ± 0.41 nM. c, Size exclusion chromatography of a nuclear extract from U2OS cells compared with recombinant RAD52-OR. RAD52 was detected by Western blotting. d, SDS-PAGE of RPA. e, SSA using RAD52 (OR or CR) in the presence or absence of RPA with 68 or 40 nt ssDNA. Each point and error bar denotes mean + s.e.m. (RAD52-OR [68 nt] and RAD52-OR + RPA [68 nt], n = 3; RAD52-OR [40 nt] and RAD52-OR + RPA [40 nt], n = 9; RAD52-OR [40 nt] and RAD52-OR + RPA [40 nt], n = 3). n values are independent experiments. f, Superose 6 filtration of RAD52 following dialysis in 2, 4 and 6 M GuHCl. g, Resource S chromatography of RAD52 following GuHCl denaturation and refolding. h, SSA using renatured RAD52, as in Fig. 1f. Each point and error bar denotes mean + s.e.m. (RAD52-OR and RAD52-OR + RPA, n = 22; RAD52-OR [GuHCl] and RAD52-OR [GuHCl] + RPA, n = 3). n values are independent experiments.
Extended Data Fig. 3
Extended Data Fig. 3. Cryo-EM data processing of RAD52-CR.
a, Schematic showing the classification and refinement steps to determine the cryo-EM structure of RAD52-CR. The software used during each processing step is indicated if outside of RELION. Scale bar for representative micrograph = 50 nm. b, Fourier Shell Correlation (FSC) plot for C11 symmetry refinement. c, Angular distribution plot for C11 symmetry refinement. d, Top, side and cut-through views of RAD52-CR cryo-EM density (C11 symmetry) coloured by local resolution estimated by CryoSPARC. e, Model to map correlation graph. f, Zoom view of RAD52-CR cryo-EM map and atomic model focusing on 83-133aa of the 5th RAD52 subunit.
Extended Data Fig. 4
Extended Data Fig. 4. Cryo-EM data processing of RAD52-OR.
a, As Extended Data Fig. 3, except with the RAD52-OR. b, Fourier Shell Correlation (FSC) plot. c, Angular distribution plot. d, Top, front and back views of RAD52-OR cryo-EM density coloured by local resolution estimated by CryoSPARC. e, Model to map correlation graph. f, Zoom view of RAD52-OR cryo-EM map and atomic model focusing on 83-133aa of the 5th RAD52 subunit. g, Representative cryo-EM EM 2D averages of RAD52 open ring with (I) 9, (II) 7 – 8, (III) 6 and (IV) 5 subunits. h, Comparison of a RAD52 protomer from 1H2I crystal structure with the open ring cryo-EM structure.
Extended Data Fig. 5
Extended Data Fig. 5. Cryo-EM data processing of RAD52-ssDNA complex.
a, As Extended Data Fig. 3, except for the RAD52-OR-ssDNA structure. b, Fourier Shell Correlation (FSC) plot. c, Angular distribution plot. d, Top, front and back views of the RAD52-OR-ssDNA cryo-EM density coloured by local resolution estimated by CryoSPARC. e, Model to map correlation graph. f, Comparison between RAD52-OR-ssDNA and RAD52NTD-K102A/K133A-ssDNA (PDB: 5XRZ) structures. g, Fluorescence anisotropy of RAD52-OR binding to ssDNA (FAM-SSA4; 40 nt) at different Mg2+ concentrations. Lines are best quadratic curve fits. Each point and error bar denotes mean + s.e.m. (n = 3). n values are independent experiments.
Extended Data Fig. 6
Extended Data Fig. 6. Analysis of RAD52 mutants.
a, Protein disorder prediction of human RAD52. b, Clustal Omega sequence alignment reveals conservation of 239-290 and 401-418aa in vertebrates. c, Domain architecture of RAD52, and the RAD52∆RID and RAD52∆C deletion mutants. d, SDS-PAGE of RAD52WT-OR, RAD52∆RID-OR, RAD52∆RID-CR, RAD52∆C-OR and RAD52∆C-CR, stained with Coomassie blue. e, Thermal melting analysis of the indicated proteins. Each point and error bar denotes mean + s.d. RAD52WT-OR (50.7 ± 1.1 °C; n = 5), RAD52∆RID-OR (48.2 ± 0.01 °C; n = 2), RAD52WT-CR (58.8 ± 1.2 °C; n = 5), RAD52∆RID-CR (57.5 ± 0.2 °C; n = 2) and RAD52NTD (61.3 ± 1.6 °C; n = 4). n values are independent experiments. f, Human RAD52 amino acid sequence coloured by electrostatic potential (blue, positively charged; red, negatively charged). Boxed and shaded sequence highlights the RAD52 RID (239-290aa) and the extreme C-terminus (401-418aa). g, AlphaFold2 prediction of RAD52 structure. The N-terminal domain (24-209aa, green), RID (239-290aa, cyan) and extreme C-terminus (401-418aa, red) are indicated. h, AlphaFold2 predicted RAD52 structure shown in surface view coloured with electrostatic potential.
Extended Data Fig. 7
Extended Data Fig. 7. Structure of RPA-ssDNA and the RAD52-ssDNA-RPA complex.
a, Surface view of a RAD52-ssDNA atomic model with electrostatic potential indicated (blue, positively charged; red, negatively charged). D97, D123, E130 and D149 are located at the opening of the RAD52 ring. b, Cryo-EM density of a RAD52-ssDNA sub-class separated by CryoSPARC 3D classification analysis with additional C-terminus density occupying the opening of the RAD52 ring. c, Coomassie blue stained SDS-PAGE of RAD52-ssDNA-RPA complex following streptavidin pull-down targeting biotin-labelled ssDNA with photocleavable linker (PC-Bio-ssDNA; 40 nt). d, Top, front and side view of the cryo-EM map of RPA-ssDNA complex (3.2 Å) with atomic model of the RPA trimeric core. ssDNA density (unmodelled) is coloured in red.
Extended Data Fig. 8
Extended Data Fig. 8. Cryo-EM data processing of RPA-ssDNA.
a, As Extended Data Fig. 3 except for the RPA-ssDNA structure. b, Fourier Shell Correlation (FSC) plot. c, Angular distribution plot. d, Side and top views of RPA-ssDNA cryo-EM density coloured by local resolution. e, Model to map correlation graph. f, Zoom view of RPA-ssDNA cryo-EM map and atomic model focusing on 599-616aa of RPA1 (purple) and 152-174aa of RPA2 (pink). g, Top, front and side views of atomic model of RPA (trimeric core) presented as an electrostatic potential coloured surface. ssDNA model is present in stick style (red). h, Representative cryo-EM 2D class averages of RPA trimeric core with flexible density.
Extended Data Fig. 9
Extended Data Fig. 9. Cryo-EM data processing of RAD52-ssDNA-RPA complex.
a, As Extended Data Fig. 3 except for the RAD52-OR-ssDNA-RPA structure. b, Fourier Shell Correlation (FSC) plot. c, Angular distribution plot. d, Top, front, side and back views of RAD52-ssDNA-RPA cryo-EM density coloured by local resolution estimated by CryoSPARC. e, Top, front and side views of 5 classes of the RAD52-ssDNA-RPA complex separated by focused 3D classification in CryoSPARC.
Extended Data Fig. 10
Extended Data Fig. 10. RAD52-RPA interactions.
a, and b, Crosslinking mass spectrometry analysis of the RAD52-ssDNA-RPA complex. Diagram depicts crosslinks detected within RAD52-OR and RPA1, RPA2 or RPA3. c, and d, Peptide arrays of RAD52, RPA1, RPA2 and RPA3 showing interactions between RAD52 and RPA (related heat maps are shown in Extended Data Fig. 6c). Each spot corresponds to a 20 aa peptide sequence, and the intensity of signal reflects the strength of interaction between target proteins and peptides. e and f, Comparison of peptide arrays and XL-MS data for RAD52-RPA interactions. Crosslinked amino acid residues were transformed into counts per peptide corresponding to peptides used in the arrays.
Extended Data Fig. 11
Extended Data Fig. 11. RAD52-RPA interactions involved in SSA.
a, Schematic of RAD52RQK/AAA (R260A, Q261A and K262A) and RPA1∆FAB (∆2-440aa). b, SDS-PAGE of RAD52RQK/AAA, RPA, RPA∆WHD and RPA∆FAB. c, Binding to ssDNA (10 nM, FAM-SSA4; 40 nt) by RAD52-OR, RAD52∆RID and RAD52∆C measured by fluorescence anisotropy, as in Fig. 1c. Equilibrium dissociation constants (KD) for ssDNA are 0.3 ± 0.1 nM (RAD52-OR), 0.7 ± 0.2 nM (RAD52∆RID-OR) and 0.2 ± 0.2 nM (RAD52∆C). Lines are best quadratic curve fits. Each point and error bar denotes mean + s.e.m. (RAD52-OR, n = 6; RAD52∆RID, n = 3; RAD52∆C, n = 3). n values are independent experiments. d, RPA and RPA∆WHD binding to ssDNA (10 nM, FAM-SSA4; 40 nt) measured by fluorescence anisotropy. Equilibrium dissociation constants (KD) for ssDNA are 3.6 ± 0.5 nM (RPA) and 3.4 ± 0.9 nM (RPA∆WHD). Lines are best quadratic curve fits. Each point and error bar denotes mean + s.d. (RPA, n = 3; RPA∆WHD, n = 2). n values are independent experiments. e, SSA by RAD52-OR or RAD52∆C, with or without RPA, as in Fig. 1e. Each point and error bar denotes mean + s.e.m. (RAD52 and RAD52 + RPA, n = 22; RAD52∆C and RAD52∆C + RPA, n = 3). (ssDNA: 68 nt) f, SSA (68 nt) by RAD52-OR or RAD52RQK/AAA, with or without RPA. Each point and error bar denotes mean + s.e.m. (RAD52 and RAD52 + RPA, n = 22; RAD52RQK/AAA, n = 6 RAD52RQK/AAA + RPA and RAD52RQK/AAA + 8xRPA, n = 3). n values are independent experiments. g, SSA by RAD52-OR with RPA or RPA∆FAB (ssDNA: 68 nt). Each point and error bar denotes mean + s.e.m. (n = 3; except RAD52 and RAD52 + RPA, n = 22). n values are independent experiments. h, SSA by RAD52-OR with RPA or RPA∆WHD, as in Fig. 5f (ssDNA: 68 nt). RAD52 was bound to strand 2. RPA was bound to both strands or replaced by RPA∆WHD as indicated. Each point and error bar denotes mean + s.e.m. (n = 3; except RAD52 and RAD52 + RPA, n = 22, and RAD52 + RPAWHD, n = 7). n values are independent experiments.

Similar articles

Cited by

References

    1. Symington LS. Role of RAD52 epistasis group genes in homologous recombination and double-strand break repair. Microbiol. Mol. Biol. Rev. 2002;66:630–670. doi: 10.1128/MMBR.66.4.630-670.2002. - DOI - PMC - PubMed
    1. Lisby M, Rothstein R, Mortensen UH. Rad52 forms DNA repair and recombination centers during S phase. Proc. Natl Acad. Sci. USA. 2001;98:8276–8282. doi: 10.1073/pnas.121006298. - DOI - PMC - PubMed
    1. Bhowmick R, Minocherhomji S, Hickson ID. RAD52 facilitates mitotic DNA synthesis following replication stress. Mol. Cell. 2016;64:1117–1126. doi: 10.1016/j.molcel.2016.10.037. - DOI - PubMed
    1. Sotiriou SK, et al. Mammalian RAD52 functions in break-induced replication repair of collapsed DNA replication forks. Mol. Cell. 2016;64:1127–1134. doi: 10.1016/j.molcel.2016.10.038. - DOI - PMC - PubMed
    1. Malacaria E, et al. RAD52 prevents excessive replication fork reversal and protects from nascent strand degradation. Nat. Commun. 2019;10:1412. doi: 10.1038/s41467-019-09196-9. - DOI - PMC - PubMed

MeSH terms