. 2024 May;629(8012):555-560.
doi: 10.1038/s41586-024-07313-3. Epub 2024 Apr 24.

A high-density and high-confinement tokamak plasma regime for fusion energy

Affiliations

A high-density and high-confinement tokamak plasma regime for fusion energy

S Ding et al. Nature. 2024 May.

Erratum in

Abstract

The tokamak approach, utilizing a toroidal magnetic field configuration to confine a hot plasma, is one of the most promising designs for developing reactors that can exploit nuclear fusion to generate electrical energy1,2. To reach the goal of an economical reactor, most tokamak reactor designs3-10 simultaneously require reaching a plasma line-averaged density above an empirical limit-the so-called Greenwald density11-and attaining an energy confinement quality better than the standard high-confinement mode12,13. However, such an operating regime has never been verified in experiments. In addition, a long-standing challenge in the high-confinement mode has been the compatibility between a high-performance core and avoiding large, transient edge perturbations that can cause very high heat loads on the plasma-facing-components in tokamaks. Here we report the demonstration of stable tokamak plasmas with a line-averaged density approximately 20% above the Greenwald density and an energy confinement quality of approximately 50% better than the standard high-confinement mode, which was realized by taking advantage of the enhanced suppression of turbulent transport granted by high density-gradients in the high-poloidal-beta scenario14,15. Furthermore, our experimental results show an integration of very low edge transient perturbations with the high normalized density and confinement core. The operating regime we report supports some critical requirements in many fusion reactor designs all over the world and opens a potential avenue to an operating point for producing economically attractive fusion energy.


Conflict of interest statement

The authors declare no competing interests.

Figures

Fig. 1
Fig. 1. Database of H98y2 and fGr for DIII-D discharges.
More than 3,600 discharges are included. Violet diamonds show high-βP experiments performed in 2019 with impurity injection. Blue squares are the new high-βP experiments performed in 2022 without impurity injection. Yellow circles represent all other experiments performed in 2019–2022. The area shaded in orange indicates the parameter space for attractive FPP designs. Vertical and horizontal dashed lines show fGr = 1.0 and H98y2 = 1.0, respectively.
Fig. 2
Fig. 2. Time history of experimental parameters and plasma profiles of DIII-D 190904.
a, fGr in blue and H98y2 in green. b, βN in blue, βP in green and q95 in violet. c, D2 gas puffing in feedback control in black and dedicated feedforward D2 gas puffing in vermillion. d, Peak pedestal electron density gradient in blue and pedestal total pressure in vermillion. e, Separatrix electron density in green and ratio between pedestal electron density and separatrix electron density in violet. fi, Profiles of electron temperature (f), ion temperature (g), electron density (h) and carbon density (i) at the time slices shown in the vertical dashed lines in a. Dots with error bars are measurements. jl, Dα data for the three periods shown in the shaded area in d. a.u., arbitrary units. mo, Total pressure profiles at the time slices of the vermillion dots in d.
Fig. 3
Fig. 3. Transport modelling of the dependence of normalized electron turbulent heat flux on the normalized electron density gradient.
a, Moderate αMHD case from the high-βP discharge in Fig. 2. Fp scan with the constant ∇p approach in blue and with the constant ∇T approach in vermillion. The experimental (Exp.) value of Fp is indicated by the black arrow. b, High αMHD case from the high-βP discharge in Fig. 2. Same colour coding as in a. c,d, Temperature (c) and density (d) profiles for the low-q95 H-mode case analysed in e and f. Dashed lines show the radial location for transport analysis. e,f, Two-dimensional scans of normalized electron turbulent heat flux on Fp and local q based on the low-q95 H-mode data shown in c and d. Full experimental βe (e) and half experimental βe (f). The experimental data point from the low-q95 discharge is indicated by a blue star in e.
Fig. 4
Fig. 4. Pedestal modelling of the three types of ELM behaviours in DIII-D 190904.
a,b, Results for the type-I ELM in blue, the compound ELM in green and the small ELM in violet. a, Pedestal stability versus normalized pedestal current density (y axis) and normalized pressure gradient at the pedestal peak gradient location (x axis). jmax, jsep and ⟨j⟩ are the maximum pedestal current density, the current density at the separatrix and the average current density in the pedestal region, respectively. Stability boundaries are shown as solid lines. Experimental points are indicated as open squares with error bars. b, Linear mode growth rate (normalized by Alfvén frequency, ωA) at different toroidal mode numbers.
Extended Data Fig. 1
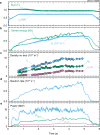
Extended Data Fig. 1. Additional time histories for DIII-D # 190904.
(a) Plasma current in blue and toroidal field in green; (b) Line-averaged density in blue and stored energy in green; (c) On-axis electron density in blue, on-axis deuterium density in green and on-axis carbon density in violet; (d) Measured neutron rate; (e) Injected NBI power in blue, measured total radiated power in green and core radiated power in violet.
Extended Data Fig. 2
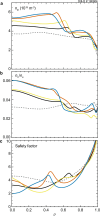
Extended Data Fig. 2. Additional profiles for DIII-D # 190904.
Deuterium density profiles in (a), ratio between carbon density and electron density in (b) and safety factor profiles (q-profiles) in (c). Different color indicates the time slice shown in Fig. 2a. Additionally, profiles for a pre-ITB time slice (1.89 s) shown in gray dashed line are added.
Extended Data Fig. 3
Extended Data Fig. 3. Spatial and temporal evolution of electron temperature at the divertor plates, measured by Langmuir probes.
ψN is normalized poloidal flux. ψN < 1.0 locates within the private flux region. Color coding shows the measured Te,div. Dashed lines indicate the actual positions of Langmuir probes.

Similar articles

Cited by

References

    1. Conn RW, et al. Economic, safety and environmental prospects of fusion reactors. Nucl. Fusion. 1990;30:1919. doi: 10.1088/0029-5515/30/9/015. - DOI
    1. Fasoli A. Essay: overcoming the obstacles to a magnetic fusion power plant. Phys. Rev. Lett. 2023;130:220001. doi: 10.1103/PhysRevLett.130.220001. - DOI - PubMed
    1. Yeom JH, et al. System analysis study for Korean fusion DEMO reactor. Fusion Eng. Des. 2013;88:742. doi: 10.1016/j.fusengdes.2013.02.092. - DOI
    1. Zhuang G, et al. Progress of the CFETR design. Nucl. Fusion. 2019;59:112010. doi: 10.1088/1741-4326/ab0e27. - DOI
    1. Lux H, et al. Uncertainties in power plant design point evaluations. Fusion Eng. Des. 2017;123:63. doi: 10.1016/j.fusengdes.2017.01.029. - DOI