. 2024 Jun;9(6):1513-1525.
doi: 10.1038/s41564-024-01678-x. Epub 2024 Apr 24.

Age and sex influence antibody profiles associated with tuberculosis progression

Affiliations

Age and sex influence antibody profiles associated with tuberculosis progression

Leela R L Davies et al. Nat Microbiol. 2024 Jun.

Abstract

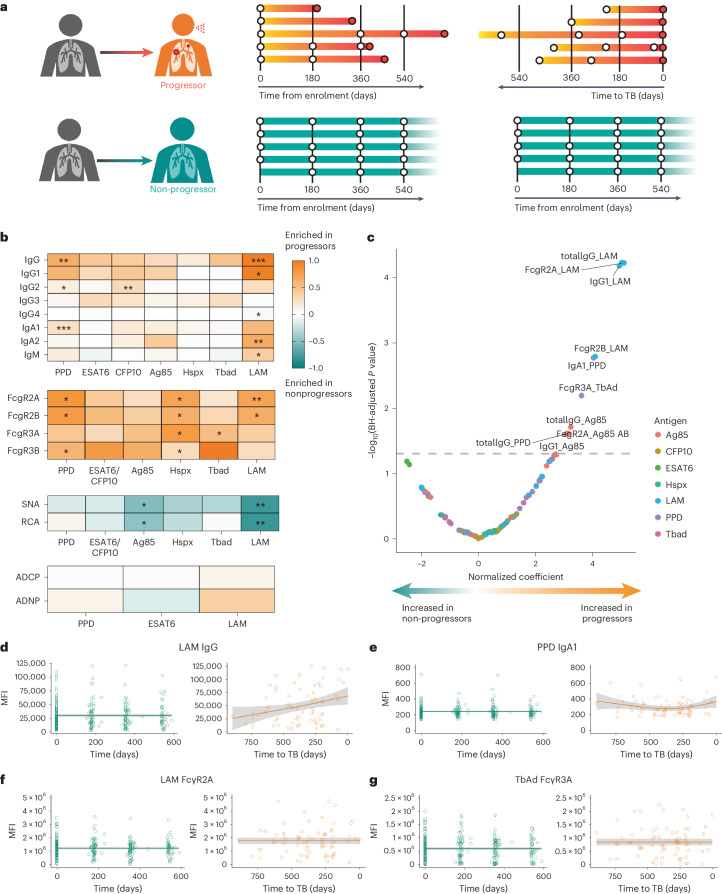
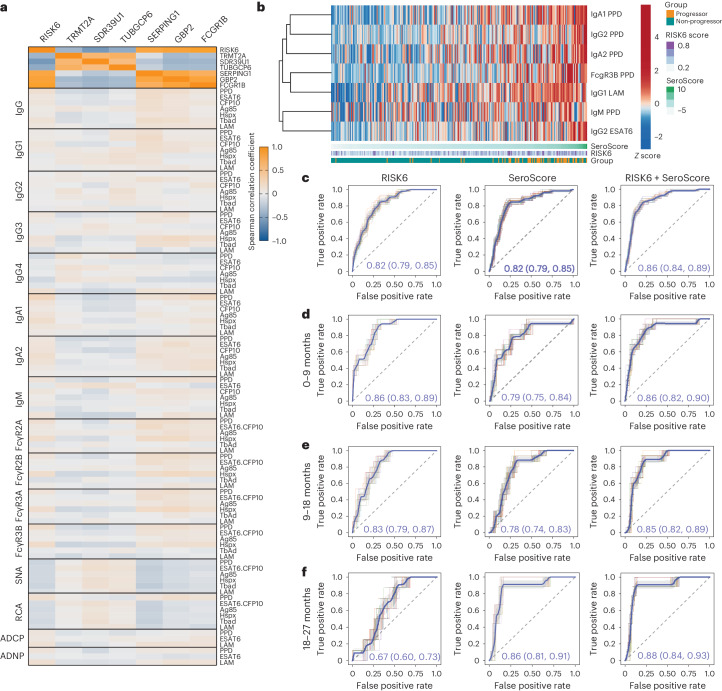
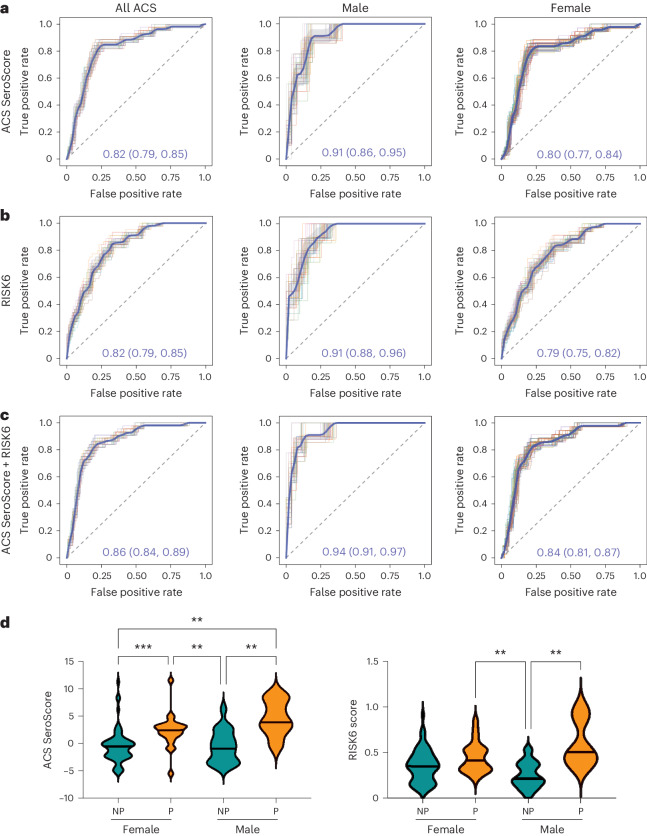
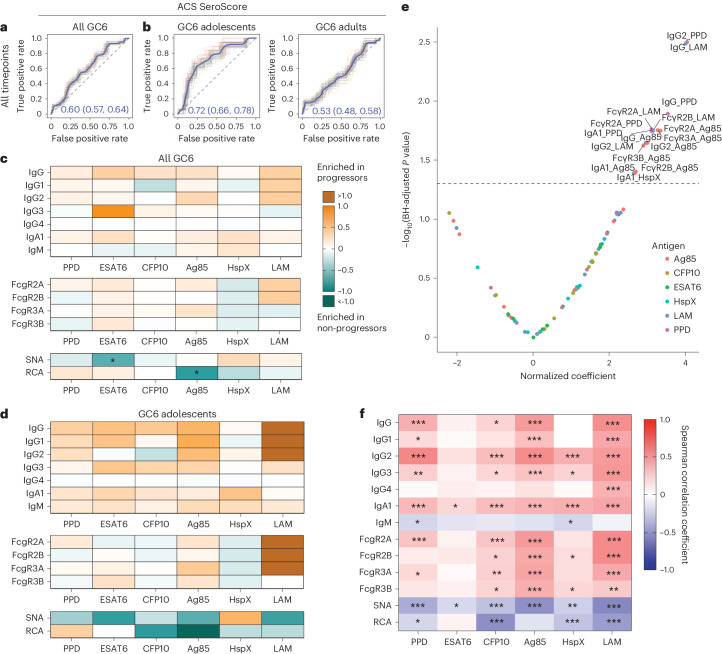
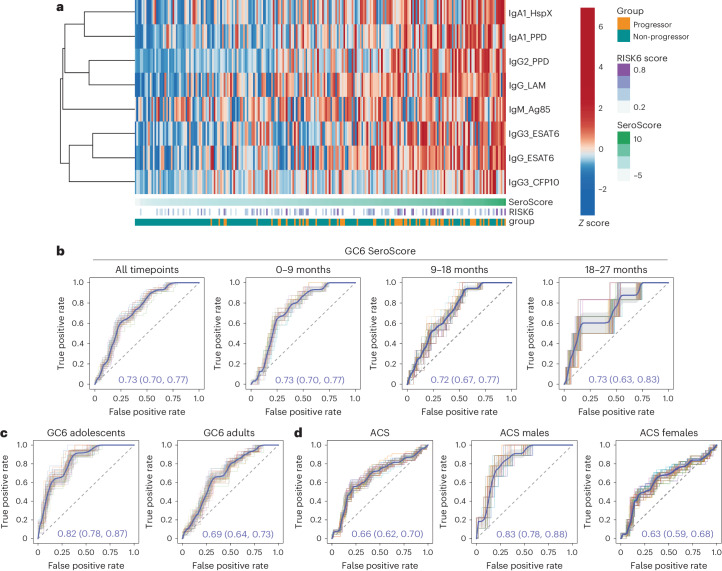
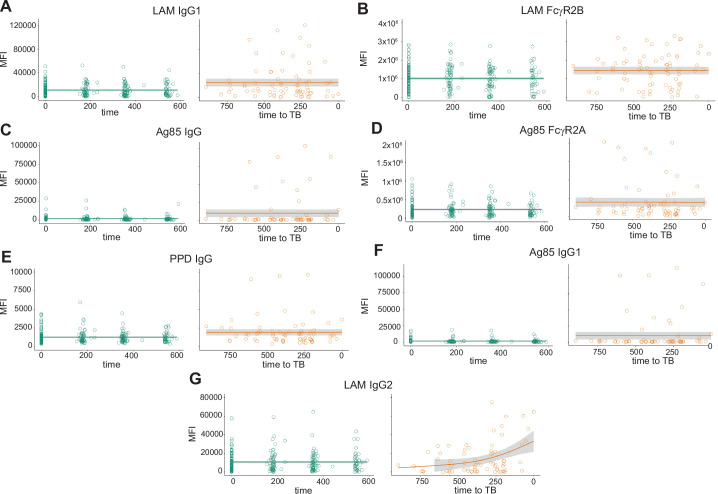
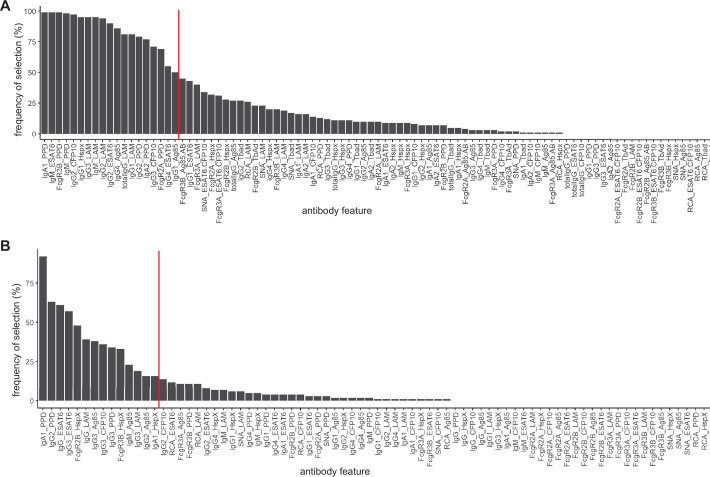
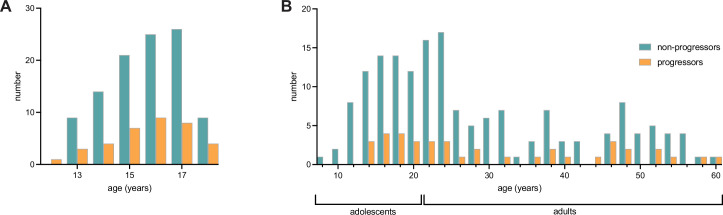
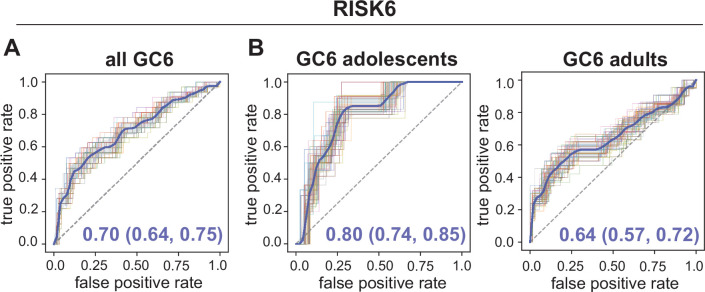
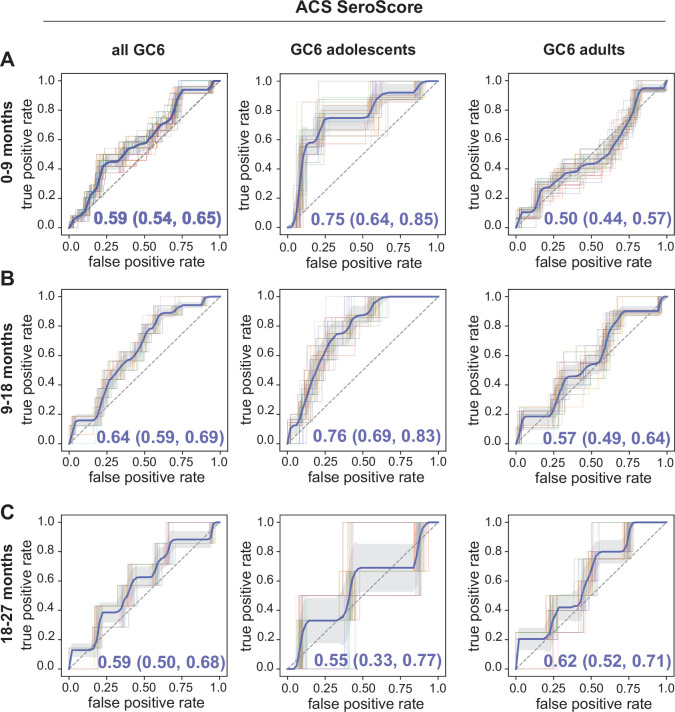
Antibody features vary with tuberculosis (TB) disease state. Whether clinical variables, such as age or sex, influence associations between Mycobacterium tuberculosis-specific antibody responses and disease state is not well explored. Here we profiled Mycobacterium tuberculosis-specific antibody responses in 140 TB-exposed South African individuals from the Adolescent Cohort Study. We identified distinct response features in individuals progressing to active TB from non-progressing, matched controls. A multivariate antibody score differentially associated with progression (SeroScore) identified progressors up to 2 years before TB diagnosis, earlier than that achieved with the RISK6 transcriptional signature of progression. We validated these antibody response features in the Grand Challenges 6-74 cohort. Both the SeroScore and RISK6 correlated better with risk of TB progression in adolescents compared with adults, and in males compared with females. This suggests that age and sex are important, underappreciated modifiers of antibody responses associated with TB progression.


Conflict of interest statement

G.A. is an employee of Moderna Therapeutics and holds equity in Leyden Labs and Systems Seromyx. S.F. is a member of the board of directors of Oxford Nanopore Technologies. L.R.L.D. became an employee of BioNTech US after completion of the work described in this paper. T.J.S. is co-inventor of a patent of the RISK6 signature. S.H.E.K., J.S.S., T.H.M.O., H.M.D., W.H.B., T.J.S. and G.W. are co-inventors on a GC6-derived signature. The remaining authors declare no competing interests.

Figures

Fig. 1
Fig. 1. ACS progressors exhibit distinct Mtb-specific antibody profiles.
a, Serum collected longitudinally from a cohort of South African adolescents who later progressed to active TB disease (n = 36) or who maintained asymptomatic infection (n = 104). For analyses in the current study, progressors were aligned by time of diagnosis and non-progressors by time of enrolment. b, Systems serologic assays performed against a panel of Mtb antigens, including the selection of antibody isotype and subclasses, the binding of Fcγ receptors, the binding to Fc of lectins SNA (recognizes sialic acid) and RCA (recognizes galactose), and the ability to recruit antibody-mediated cellular phagocytosis (ADCP) and neutrophil phagocytosis (ADNP). For each indicated assay, values for each individual were averaged over time. Each heatmap represents log­2(median value in progressors/median value in non-progressors). The statistical significance of the differences between progressors and non-progressors was measured by two-sided Mann–Whitney test followed by Benjamini–Hochberg (BH) correction for multiple comparisons. *P < 0.05; **P < 0.01. c, Mixed-effects linear modelling to evaluate the association between antibody features and progressor status by controlling age, sex, ethnicity, school code and time of sample collection. Likelihood ratio test was used to compare the two paired models, and P values were corrected for multiple comparisons by the BH method. The x axis indicates the effect size as a normalized coefficient of the variable of progression, and the y axis −log10 of the adjusted P values. The dotted line represents the corrected P value of 0.05. d, Raw values of LAM-specific IgG measurements for all individuals plotted over time from enrolment (non-progressors, teal) or time to TB (progressors, orange). The solid lines indicate a smooth of median values, using a generalized additive model, and the grey shading indicates one standard deviation. eg, Plots for PPD-specific IgA1 (e), LAM-specific antibody binding of FcγR2A (f) and TbAd-specific antibody binding of FcγR3A (g). Source data
Fig. 2
Fig. 2. An Mtb-specific SeroScore differentiates progressors from non-progressors.
a, For all individuals at all timepoints, Spearman correlations were calculated between all measured Mtb-specific antibody features and RISK6 score (n = 377 measurements) or transcript expression levels of each of its six components (n = 312 measurements). The heatmap indicates Spearman correlation coefficient for each comparison. b, A multivariate SeroScore was developed on the basis of systems serology data in ACS. The heatmap represents Z-scored data for the six features included in the SeroScore. Each column represents one individual (n = 36 progressors and n = 104 non-progressors). Individuals are sorted by overall SeroScore as shown in the track beneath the heatmap. RISK6 score and progressor/non-progressor status of each individual are also indicated in tracks. c, ROC curves developed assessing the ability to differentiate progressors (n = 29) from non-progressors (n = 99) of RISK6 (left), SeroScore (middle) and both RISK6 and SeroScore in combination (right). ROC curves were generated 50 times using randomly selected 80% of samples with group stratification. The mean curve is indicated in blue, with grey shading indicating one standard deviation. The mean AUC with 95% confidence interval is indicated. df, Additional ROC curves developed only including progressors in time windows 0–9 months before diagnosis (n = 19 progressors) (d), 9–18 months before diagnosis (n = 18 progressors) (e) and 18–27 months before diagnosis (n = 10 progressors) (f). Source data
Fig. 3
Fig. 3. Sex modulates the association of SeroScore and RISK6 with TB progression.
ROC curves were developed measuring the ability of the ACS-derived SeroScore and RISK6 to differentiate progressors from non-progressors in ACS. a, The identification of progressors by the ACS-derived SeroScore among all ACS individuals (n = 29 progressors and n = 99 non-progressors), males only (n = 7 progressors and n = 37 non-progressors) and females only (n = 22 progressors and n = 63 non-progressors). b, As in a, the performance of RISK6 among all ACS, males only and females only. c, The identification of progressors by the ACS-derived SeroScore and RISK6 in combination among all ACS, males only and females only. For ac, the mean of 50 curves is shown in blue, with grey shading indicating one standard deviation. The mean AUC with 95% confidence interval is indicated on each plot. d, The ACS SeroScore and RISK6 signature score were plotted for female (n = 22) and male (n = 7) progressors (P, orange) and female (n = 63) and male (n = 37) non-progressors (NP, teal) from ACS. The groups were compared by Kruskal–Wallis test, with P values <0.05 indicated. Source data
Fig. 4
Fig. 4. Mtb-specific antibody profiles correlate with progression in GC6 adolescents.
a, ROC curves developed to evaluate the ability of the ACS-derived SeroScore to differentiate progressors (n = 39) and non-progressors (n = 169) among individuals from the GC6 cohort. The grey shading indicates one standard deviation. The mean AUC is indicated. b, ROC curves evaluating the ability of the ACS-derived SeroScore to differentiate progressors from non-progressors among GC6 adolescents (age 8–20 years at enrolment, n = 14 progressors and n = 63 non-progressors) and adults (age >20 years at enrolment, n = 25 progressors and n = 106 non-progressors). The mean of 50 curves is shown in blue, with grey shading indicating one standard deviation. The mean AUC with 95% confidence interval is indicated. c, Mtb-specific systems serology used to profile serum collected longitudinally from the GC6 cohort. For each indicated assay, values for each individual were averaged over time. In the heatmap, each cell represents log2(median value in progressors/median value in non-progressors). The statistical significance of the differences between progressors and non-progressors was measured by two-sided Mann–Whitney test followed by Benjamini–Hochberg (BH) correction for multiple comparisons. *P < 0.05 after correction. d, A heatmap representing averaged values over time for adolescent individuals only. Each cell represents log2(median value in progressors/median value in non-progressors). The statistical significance of the differences between progressors and non-progressors were measured by two-sided Mann–Whitney test followed by BH correction for multiple comparisons. *P < 0.05 after correction. e, Among all GC6 individuals, mixed-effects linear modelling was used to evaluate the association between antibody features and progressor status by controlling age, sex and time of sample collection. Likelihood ratio test was used to compare the two paired models, and P values were corrected for multiple comparisons by the BH method. The x axis indicates effect size as normalized coefficient of the variable of progression, and the y axis −log10 of the adjusted P values. The dotted line represents the corrected P value of 0.05. f, A heatmap representing Spearman correlation coefficients between each antibody feature and age among GC6 non-progressors only (n = 169). P values for each correlation were adjusted for multiple comparisons by the BH method, and adjusted P values are indicated: *P < 0.05, **P < 0.01, ***P < 0.001. Source data
Fig. 5
Fig. 5. A GC6-derived SeroScore detects humoral correlates of progression.
a, A multivariate SeroScore was developed in GC6. The heatmap represents Z-scored data for the six features included in the SeroScore. Each column represents one individual (n = 39 progressors and n = 169 non-progressors). The individuals are sorted by overall SeroScore as shown in the track beneath the heatmap. The RISK6 score and progressor/non-progressor status of each individual are also indicated in tracks. b, To evaluate the ability of the GC6-derived SeroScore to identify progressors in the same cohort, ROC curves were developed over the total study period (n = 39 progressors, n = 169 non-progressors) and for progressors in time windows 0–9 months (n = 30 progressors), 9–18 months (n = 19 progressors) and 18–27 months (n = 8 progressors) before the diagnosis of active TB. The mean of 50 curves is shown in blue, with grey shading indicating one standard deviation. The mean AUC with 95% confidence interval is indicated. c, ROC curves measure the ability of the GC6-derived SeroScore to identify GC6 progressors in an age-stratified analysis of adolescents (n = 14 progressors and n = 63 non-progressors) and adults (n = 25 progressors and n = 106 non-progressors). d, The ROC curves measure the ability of the GC6-derived SeroScore to identify progressors in the full ACS cohort (n = 29 progressors and n = 99 non-progressors), males only (n = 7 progressors and n = 37 non-progressors) and females only (n = 22 progressors and n = 63 non-progressors). Source data
Extended Data Fig. 1
Extended Data Fig. 1. Temporal trajectories of additional Mtb-specific antibody features significantly enriched in ACS progressors.
Raw values of measured antibody features for all indivduals were plotted over time from enrollment (non-progressors, teal) or time to TB (progressors, orange). Solid lines indicate a smooth of median values, using a generalized additive model, and grey shading indicates 95% confidence interval. Data is shown for a) LAM IgG1, b) LAM FcgR2B, c) Ag85 IgG, d) Ag85 FcgR2A, e) PPD IgG, f) Ag85 IgG1, and g) LAM IgG2. These include all antibody features found to statistically differ between progressors and non-progressors in mixed effects linear modeling, as well as LAM IgG2, which did not statistically differ but is shown for comparison. Source data
Extended Data Fig. 2
Extended Data Fig. 2. Selection of antibody features for inclusion in SeroScores.
For a) ACS, and b) GC6, LASSO (Least Absolute Shrinkage and Selection Operator) regularization was applied to 100 randomly selected subsets, each containing 80% of the full dataset, and iterated 10 times. The frequency of selection of each antibody feature is shown. Red lines indicate the threshold defining the features that were evaluated in combination for each SeroScore. Source data
Extended Data Fig. 3
Extended Data Fig. 3. Age distributions for included subjects from ACS and GC6.
a) Histogram of age distributions for ACS progressors and non-progressors. b) Histogram of age distributions for GC6 progressors and non-progressors. For GC6 subjects, adolescents were defined as those with age at enrollment between 8 and 20 years, and adults were those with age at enrollment of 21 or more years. Source data
Extended Data Fig. 4
Extended Data Fig. 4. Ability of RISK6 to identify GC6 adolescent and adult progressors.
ROC curves were developed over the full study duration for the subset of individuals in GC6 for whom the RISK6 score was available. A) ROC curve indicates performance of RISK6 among all GC6 individuals (n = 35 progressors and n = 135 non-progressors). B) ROC curve for performance of RISK6 among GC6 adolescents (age 8–20 years, n = 12 progressors and n = 49 non-progressors) and adults (age ≥21 years, n = 23 progressors and n = 86 non-progressors). ROC curves were generated 50 times using randomly selected 80% of samples with group stratification. The mean curve is indicated in blue, with grey shading indicating one standard deviation. Mean AUC with 95% confidence interval is indicated. Source data
Extended Data Fig. 5
Extended Data Fig. 5. Longitudinal ability of the ACS-derived SeroScore to identify GC6 adolescent and adult progressors.
The SeroScore derived in ACS was used to develop ROC curves for GC6 adolescents (age 8–20 years) and adults (≥21 years) over time windows a) 0–9 months, b) 9–18 months, and c) 18–27 months prior to diagnosis of active TB. ROC curves were generated 50 times using randomly selected 80% of samples with group stratification. The mean curve is indicated in blue, with grey shading indicating one standard deviation. Mean AUC with 95% confidence interval is indicated. Source data

References

    1. Global Tuberculosis Report (World Health Organization, 2021).
    1. Comstock GW, Livesay VT, Woolpert SF, Woolpert CG. The prognosis of a positive tuberculin reaction in childhood and adolescence. Am. J. Epidemiol. 1974;99:131–138. doi: 10.1093/oxfordjournals.aje.a121593. - DOI - PubMed
    1. The End TB Strategy (World Health Organization, 2015).
    1. Diel R, Loddenkemper R, Nienhaus A. Predictive value of interferon-γ release assays and tuberculin skin testing for progression from latent TB infection to disease state: a meta-analysis. Chest. 2012;142:63–75. doi: 10.1378/chest.11-3157. - DOI - PubMed
    1. Lalvani A, Berrocal-Almanza LC, Halliday A. Predicting progression to active tuberculosis: a rate-limiting step on the path to elimination. PLoS Med. 2019;16:e1002814. doi: 10.1371/journal.pmed.1002814. - DOI - PMC - PubMed

Substances