. 2024 Jun;43(11):2233-2263.
doi: 10.1038/s44318-024-00092-7. Epub 2024 Apr 24.

Dynamic control of gene expression by ISGF3 and IRF1 during IFNβ and IFNγ signaling

Affiliations

Dynamic control of gene expression by ISGF3 and IRF1 during IFNβ and IFNγ signaling

Aarathy Ravi Sundar Jose Geetha et al. EMBO J. 2024 Jun.

Abstract

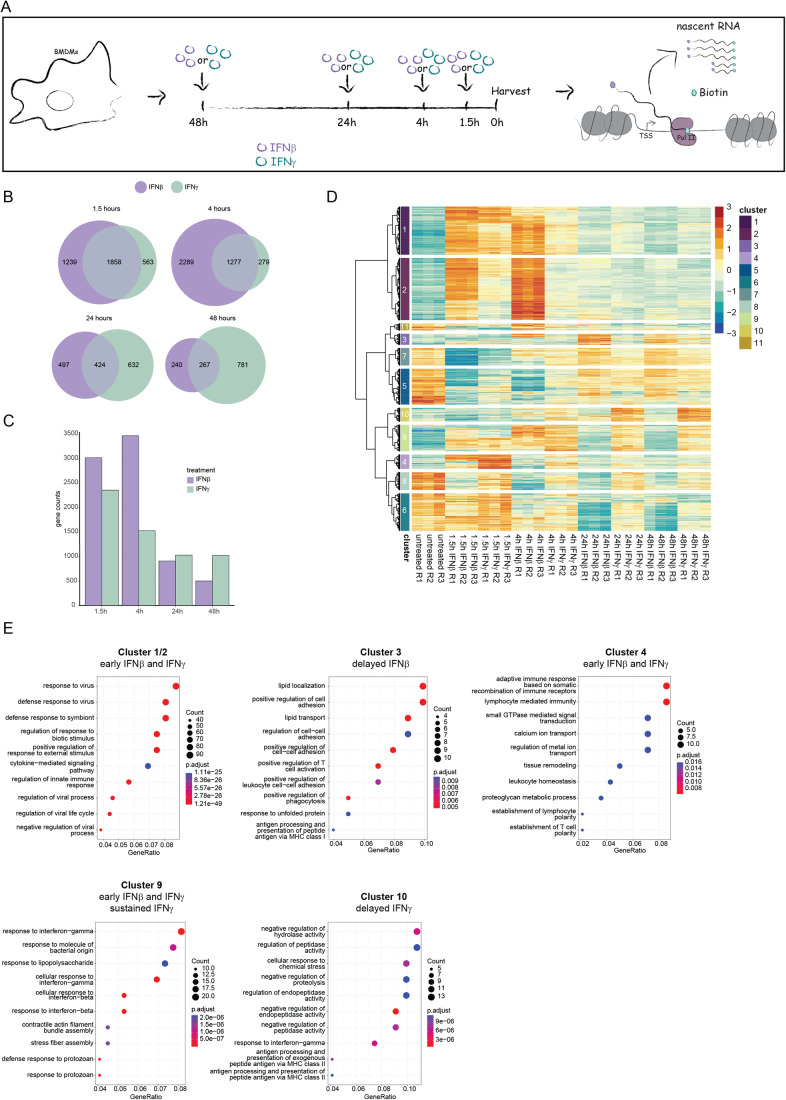
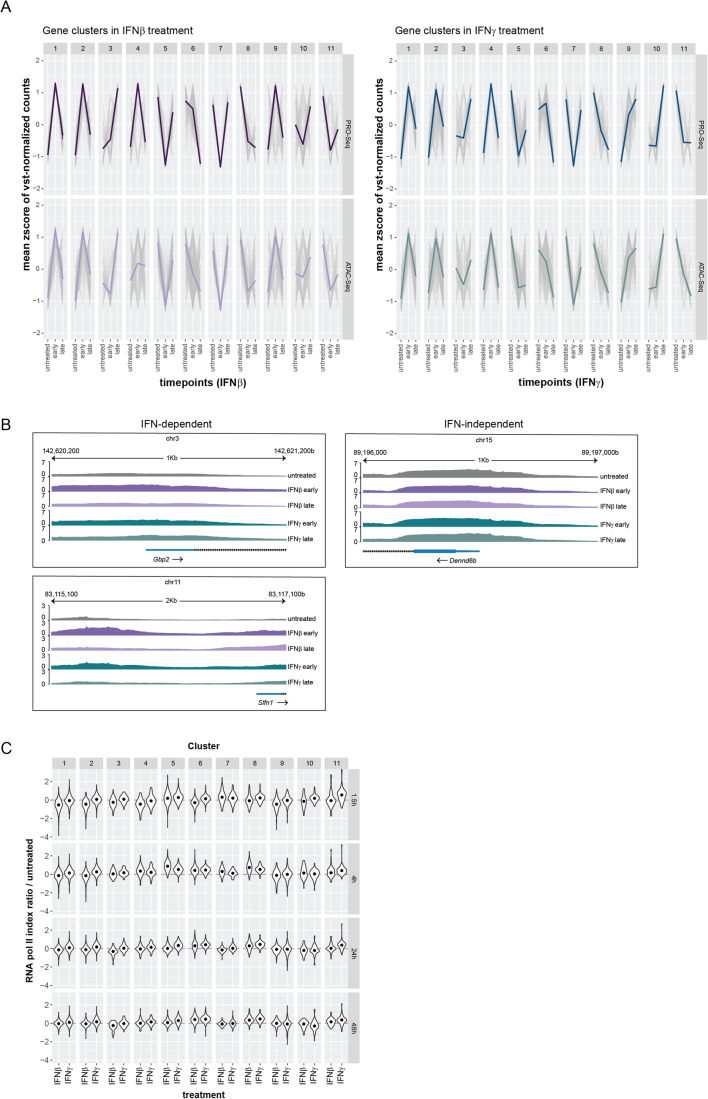
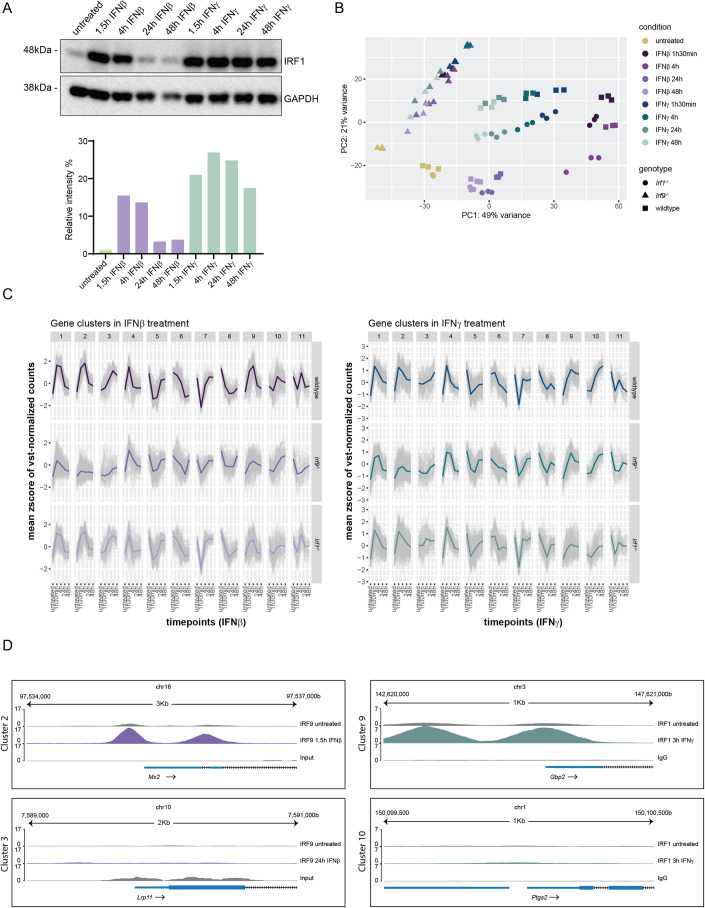
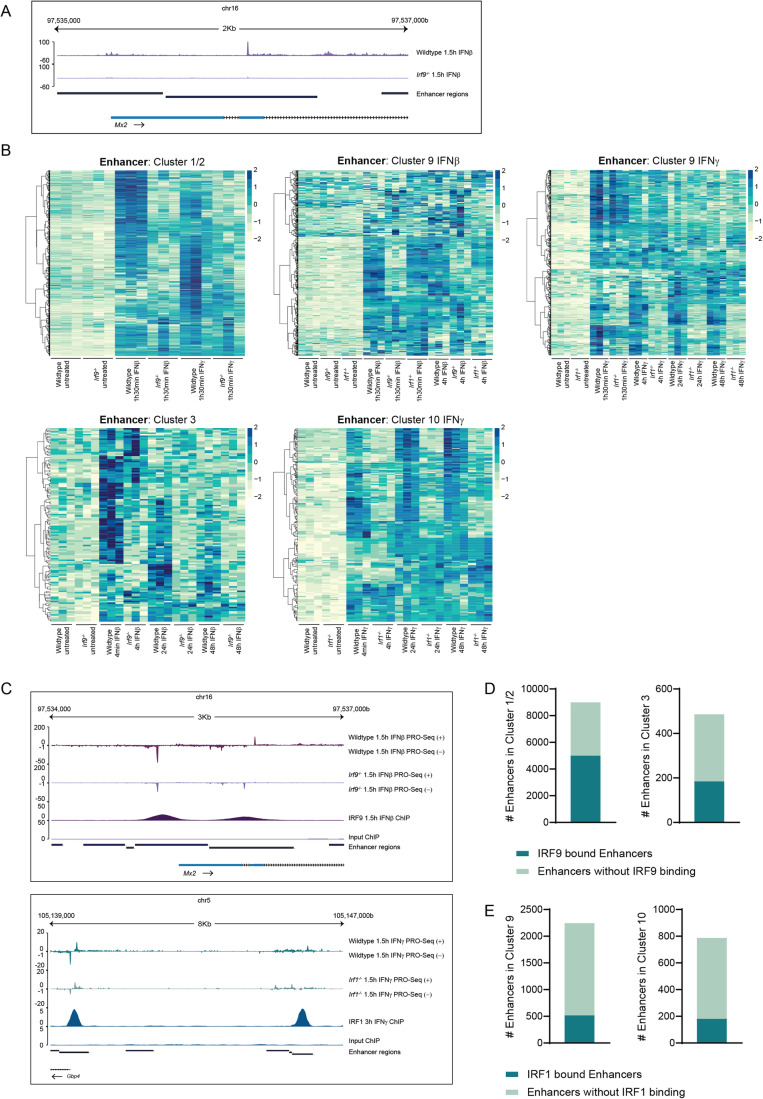
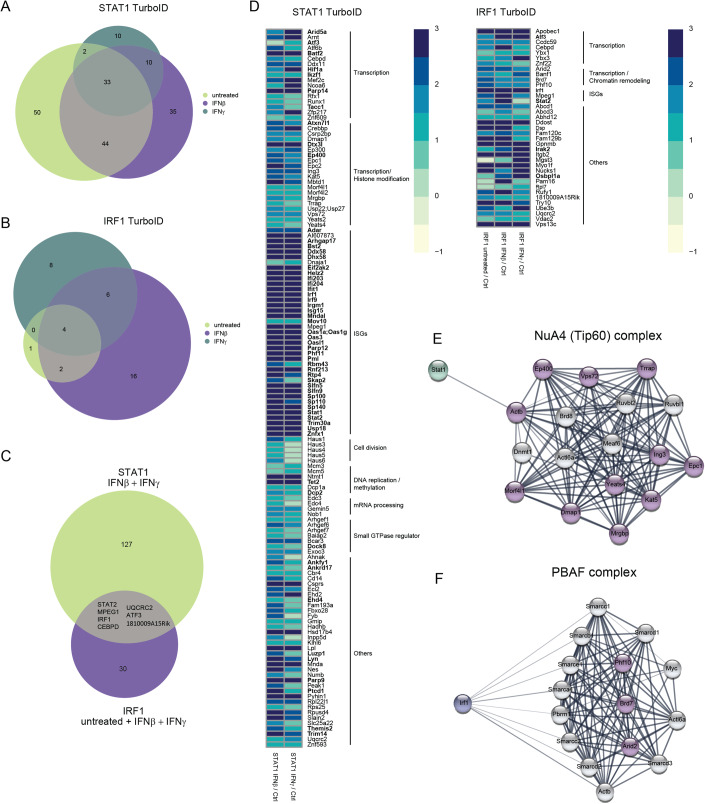
Type I interferons (IFN-I, including IFNβ) and IFNγ produce overlapping, yet clearly distinct immunological activities. Recent data show that the distinctness of global transcriptional responses to the two IFN types is not apparent when comparing their immediate effects. By analyzing nascent transcripts induced by IFN-I or IFNγ over a period of 48 h, we now show that the distinctiveness of the transcriptomes emerges over time and is based on differential employment of the ISGF3 complex as well as of the second-tier transcription factor IRF1. The distinct transcriptional properties of ISGF3 and IRF1 correspond with a largely diverse nuclear protein interactome. Mechanistically, we describe the specific input of ISGF3 and IRF1 into enhancer activation and the regulation of chromatin accessibility at interferon-stimulated genes (ISG). We further report differences between the IFN types in altering RNA polymerase II pausing at ISG 5' ends. Our data provide insight how transcriptional regulators create immunological identities of IFN-I and IFNγ.

Keywords: IRF; Interferons; Macrophage; STAT; Transcription.


Conflict of interest statement

The authors declare no competing interests.

Figures

Figure 1
Figure 1. IFNβ and IFNγ-driven transcriptional responses diverge over time.
(A) Schematic illustration of the experimental setup used for the PRO-Seq experiment. (BE) Bone marrow-derived macrophages (BMDM) in three independent replicates were treated with either IFNβ or IFNγ for 48, 24, 4, or 1.5 h or left unstimulated before harvest for nuclear run-on (PRO-Seq). Data were derived from the PRO-Seq analysis. Venn diagram (B)/Bar graph (C) showing the number of upregulated genes in IFNβ and IFNγ treated versus untreated cells at indicated timepoints. The overlap in (B) represents genes that are upregulated by both IFN types. (D) Heatmap showing hierarchical clustering using a pool of the top 1000 genes that are significantly expressed (absolute log2 fold change (log2FC) >=1, adjusted P value (Padj) <0.01) in each timepoint in comparison to the untreated condition. Eleven clusters were defined. (E) Gene ontology of genes belonging to Cluster 1 and 2, 3, 4, 9, and 10 was analyzed using overrepresentation analysis in ClusterProfiler.
Figure 2
Figure 2. Chromatin accessibility and Pol II pausing are involved in regulating transcriptional dynamics during IFN signaling.
(A) Trend lines of the mean z-score of vst-normalized PRO-Seq and ATAC-Seq counts (gray) representing three independent replicates of IFN-treated BMDMs separate by cluster and treatment (IFNβ or IFNγ). Early = 1.5 h for PRO-Seq, 2 h for ATAC-Seq; Late = 48 h; Single-colored lines represent the median across all genes. (B) Browser tracks of ATAC-Seq-derived samples showing chromatin accessibility of Gbp2 and Slfn1 (IFN-dependent genes) and Dennd6b (IFN-independent gene). Early = 2 h; Late = 48 h. (C) Log ratio of Pol II pausing indices during IFNβ and IFNγ stimulation at each timepoint to those of the untreated condition. Data represent triplicate samples from BMDM, as described in the legend of Fig. 1. Read counts used for calculating pausing indices were derived from the PRO-Seq.
Figure 3
Figure 3. ISGF3 complex and IRF1 have distinct, cluster-specific roles in regulating transcription.
(A) Bone marrow-derived macrophages (BMDM) were treated with IFNβ or IFNγ for either 1.5, 4, 24, or 48 h and protein levels of IRF1 and GAPDH in whole-cell lysates were measured using western blotting. GAPDH was used as a loading control. The representative blot (of three independent replicates) was quantified using Image Lab and shown in the lower panel. Relative intensities of the bands were normalized to their corresponding GAPDH levels. (B, C) Wild-type, Irf9−/− and Irf1−/− BMDMs were treated with IFNβ or IFNγ for 1.5, 4, 24, or 48 h and nascent RNA transcripts derived from the PRO-Seq were analyzed. Principal component analysis (PCA) using 500 most variable genes in DESeq2 (B). Trend lines representing the mean z-score of vst-normalized counts (gray) across genotype and treatment conditions separated by clusters. Single-colored lines represent the median (C). (D) Browser tracks of ChIP-Seq-derived samples showing binding of IRF9 at the promoter of Mx2 (untreated versus 1.5 h IFNβ) and Lrp11 (untreated versus 24 h IFNβ) and IRF1 binding at the promoter of Gbp2 (untreated versus 3 h IFNγ) and Ptgs2 (untreated versus 3 h IFNγ). Published IRF1 ChIP-Seq data (Langlais et al, 2016) were re-analyzed. Source data are available online for this figure.
Figure 4
Figure 4. IRF9 and IRF1 regulate the activation of a subset of ISG enhancers.
(A) Browser tracks representing nascent transcripts (sense strand) in wild-type and Irf9−/− BMDMs at dREG-derived enhancer regions at Mx2 loci during 1.5 h of IFNβ stimulation. (B) Heatmap of vst-normalized read counts (DESeq2) across indicated genotype and treatment conditions in enhancers of respective clusters. The enhancer regions represented here were identified using dREG transcriptional regulatory element peak calling, and further filtered by exclusion of gene-regions using bedtools 2.30.0. (C) Browser tracks representing nascent RNA transcripts (derived from PRO-Seq) in sense and anti-sense strands of wild-type and Irf9−/− (top panel) or Irf1−/− (bottom panel) BMDMs, together with browser tracks of published ChIP-Seq data for IRF9 and re-analyzed published ChIP-Seq data for IRF1 (Langlais et al, 2016) at enhancer regions of Mx2 and Gbp4, respectively. (D, E) Bar plot representing total number of enhancers identified in triplicate samples for genes in the indicated clusters (derived from PRO-Seq) and number of enhancers that are in addition bound by IRF9 (D) and IRF1 (E) colored in dark green derived from re-analyzed published ChIP-Seq data (Platanitis et al, ; Langlais et al, 2016) as well as newly generated IRF9 ChIP-Seq data at 24 h.
Figure 5
Figure 5. IRF1 regulates chromatin accessibility of a specific subset of genes.
(A) Schematic representation of the treatment conditions and workflow for processing ATAC-Seq samples in comparison to PRO-Seq samples. (B, C) Volcano plots of nascent transcripts in wild-type BMDMs stimulated with IFNβ (left panel) or IFNγ (right panel) for 1.5 h (n = 3). Each dot represents a gene. The log2-transformed fold change and −log10-transformed Padj values are shown on the x and y axis, respectively. Only genes with significant changes in accessibility within the range of 2000 bp from the TSS were considered. Dark-blue dots represent genes that were significantly upregulated after either IFN treatment (log2FC ≥ 1, Padj ≤0.05) according to PRO-Seq. The violet dots represent genes significantly downregulated in Irf1−/− (B) or Irf9−/− (C) BMDMs according to PRO-Seq (log2FC ≤ -1, Padj ≤0.05). The yellow dots represent genes which in addition showed a significant decrease in chromatin accessibility (log2FC ≤ 1, Padj ≤0.05) in Irf1−/− (B) or Irf9−/− (C) BMDMs compared to their wild-type counterpart, either during IFN treatment (1.5 h) or homeostatic condition according to ATAC-seq data. (D) Browser tracks showing chromatin accessibility at representative gene loci (Ifi44 and Gbp2) in wild-type and Irf1−/− BMDMs derived from ATAC-Seq.
Figure 6
Figure 6. STAT1 and IRF1 interact with factors relevant for transcription, histone modification, and chromatin remodeling.
(AF) Interactors of STAT1-BirA* and IRF1-BirA* in Stat1−/− and Irf1−/− RAW 264.7 cells, respectively. Dox-treated cells in three independent replicates were either left untreated or stimulated with IFNβ or IFNγ for 3 h (n = 3). Interactors were filtered for log2FC >= 0.5 (IRF1-BirA*) or log2FC >= 1 (STAT1-BirA*) enrichment above background (BirA*-NLS control) with a Padj value of <0.05. (A) Venn diagram of STAT1 interactors at steady state and upon IFNβ or IFNγ treatment. (B) Venn diagram of IRF1 interactors at steady state and upon IFNβ or IFNγ treatment. (C) Venn diagram of unique and common STAT1 and IRF1 interactors. (D) Heatmap showing log2FC of STAT1 and IRF1 interactors, grouped by functional annotation. Proteins labeled in bold were encoded by genes upregulated early after IFN treatment (1.5 h) in our PRO-Seq screen. Color-coded values represent log2FC with regard to the NLS control. (E) NuA4 (Tip60) complex components. Proteins labeled in purple were found in the proximity labeling screen using STAT1-BirA*. (F) PBAF complex components. Proteins labeled in purple were found in the proximity labeling screen using IRF1-BirA*.
Figure EV1
Figure EV1. Transcriptional response of interferon-stimulated genes in wild-type BMDM.
(A) Venn diagram showing numbers of significantly upregulated genes at indicated timepoints during IFNβ and IFNγ signaling in three independent replicates of BMDM (log2FC > 1) and padj < 0.01). (B) Log2FC of Nos2, Cd86, Cxcl9, Cxcl10, Mx2, Ifit3 and Rsad2 across the denoted timepoints separated by IFNβ and IFNγ stimulation. (C) Bubble plot visualizing gene ontologies resulting from overrepresentation analysis performed per indicated clusters using clusterProfiler (P value cutoff = 0.05). (D) Heatmap of log2FC of genes belonging to the ISG core (Mostafavi et al, 2016) at respective timepoints during IFNβ and IFNγ stimulation. (E) Pie chart showing respective number of ISG-core genes in clusters 1, 2 and 9.
Figure EV2
Figure EV2. Promoter binding and phosphorylation requirement of transcription factors controlling ISG expression.
(A) RAW 264.7 cells were treated with IFNβ or IFNγ for either 1.5 h, 4 h, 24 h or 48 h and protein levels of IRF1 and GAPDH were measured using western blotting (n = 2). GAPDH was used as a loading control. Quantification of the representative blot on the left was performed using Image Lab and is shown in the panel on the right. Relative intensities of the bands were normalized to their corresponding GAPDH levels. (B) Log2FC of Irf1 derived from PRO-Seq data described in the legend to Fig. 1 across the denoted timepoints after IFNβ and IFNγ stimulation, respectively. (C) ChIP was performed in biological triplicates using antibodies against IRF9, STAT1 and STAT2 in IFNβ or IFNγ-treated wild-type BMDMs (1.5, 24 and 40 h). Graph represents RT-qPCR of genomic Mx2. (D) Graph represents ratio of binding of STAT1/STAT2 to the promoter of Mx2 during early (1.5 h) and prolonged (24 h, 40 h) responses to IFNβ- and IFNγ stimulation of BMDMs. (E) Graph representing pre-mRNA levels of Mx1, Ifit3 and Bst2 in IFNβ-treated BMDMs (48 h). Additionally, cells were treated with ruxolitinib for indicated times (n = 3). Standard deviation and unpaired Student’s t test statistics were calculated for each of the conditions indicated. P values are indicated as not significant (ns), *P  <  0.05; **P  ≤  0.01; ***P  ≤  0.001; ****P  ≤  0.0001). (F) ChIP was performed using antibodies against STAT1, p(Y)STAT1, STAT2, p(Y)STAT2 and IgG in IFNβ-treated wild-type BMDMs (1.5 and 48 h). The graph represents RT-qPCR of genomic Ifit3. (G) Site-directed ChIP was performed using antibodies against IRF1 in IFNβ or IFNγ-treated wild-type BMDMs (1.5, 24 and 48 h). The graph represents RT-qPCR of genomic Gbp2. Input normalized values were used to calculate fold changes caused by interferon treatment relative to untreated cells. Standard deviation and unpaired Student’s t test statistics were calculated for each of the conditions indicated. P values are indicated as not significant (ns), *P  <  0.05; **P  ≤  0.01; ***P  ≤  0.001; ****P  ≤  0.0001). Source data are available online for this figure.
Figure EV3
Figure EV3. Transcriptional response to interferons in wild-type compared to IRF1- or IRF9-deficient BMDM.
Z-score normalized read counts of Gbp2, Gbp10, Nos2, Tlr12 and Ifi44, calculated across treatment times and genotypes. Counts were derived from PRO-Seq data described in the legend to Fig. 3.
Figure EV4
Figure EV4. IRF1-dependent chromatin accessibility of ISG promoters at steady state.
Volcano plot of genes derived from ATAC-Seq of Irf1−/− and wild-type BMDMs as described in the legend to Fig. 5 at steady state. The log2-transformed fold change and −log10-transformed padj are shown on the x and y axis, respectively. Genes depicted in blue are significantly (log2FC <= 1, Padj < 0.05) downregulated in Irf1/− BMDMs compared to their wild-type control.
Figure EV5
Figure EV5. Immunoprecipitation of IRF1 and STAT1.
(AD) BMDMs (A, B) and RAW 264.7 cells (C, D) were treated with IFNβ or IFNγ for 1.5 h. STAT1-IRF1 complexes were analyzed by immunoprecipitation (IP) using antibodies against IRF1, STAT1 or an IgG control, followed by western blotting (n = 3). Input controls represent 10% of the total lysate that was used for the IP. The representative blot in (A) was quantified using Image Lab (B). The representative blot in (C) was quantified using Image Lab (D). Source data are available online for this figure.

References

    1. Abdul-Sater AA, Majoros A, Plumlee CR, Perry S, Gu A-D, Lee C, Shresta S, Decker T, Schindler C. Different STAT transcription complexes drive early and delayed responses to type I IFNs. J Immunol. 2015;195:210–216. doi: 10.4049/jimmunol.1401139. - DOI - PMC - PubMed
    1. Andersson R, Gebhard C, Miguel-Escalada I, Hoof I, Bornholdt J, Boyd M, Chen Y, Zhao X, Schmidl C, Suzuki T, et al. An atlas of active enhancers across human cell types and tissues. Nature. 2014;507:455–461. doi: 10.1038/nature12787. - DOI - PMC - PubMed
    1. Au-Yeung N, Horvath CM. Histone H2A.Z suppression of interferon-stimulated transcription and antiviral immunity is modulated by GCN5 and BRD2. iScience. 2018;6:68–82. doi: 10.1016/j.isci.2018.07.013. - DOI - PMC - PubMed
    1. Babiarz JE, Halley JE, Rine J. Telomeric heterochromatin boundaries require NuA4-dependent acetylation of histone variant H2A.Z in Saccharomyces cerevisiae. Genes Dev. 2006;20:700–710. doi: 10.1101/gad.1386306. - DOI - PMC - PubMed
    1. Bastos KRB, Barboza R, Sardinha L, Russo M, Alvarez JM, Lima MRDI. Role of endogenous IFN-γ in macrophage programming induced by IL-12 and IL-18. J Interf Cytokine Res. 2007;27:399–410. doi: 10.1089/jir.2007.0128. - DOI - PMC - PubMed

MeSH terms