. 2024 Jun;6(6):1143-1160.
doi: 10.1038/s42255-024-01034-7. Epub 2024 Apr 24.

Extracellular domains of CARs reprogramme T cell metabolism without antigen stimulation

Affiliations

Extracellular domains of CARs reprogramme T cell metabolism without antigen stimulation

Aliya Lakhani et al. Nat Metab. 2024 Jun.

Abstract

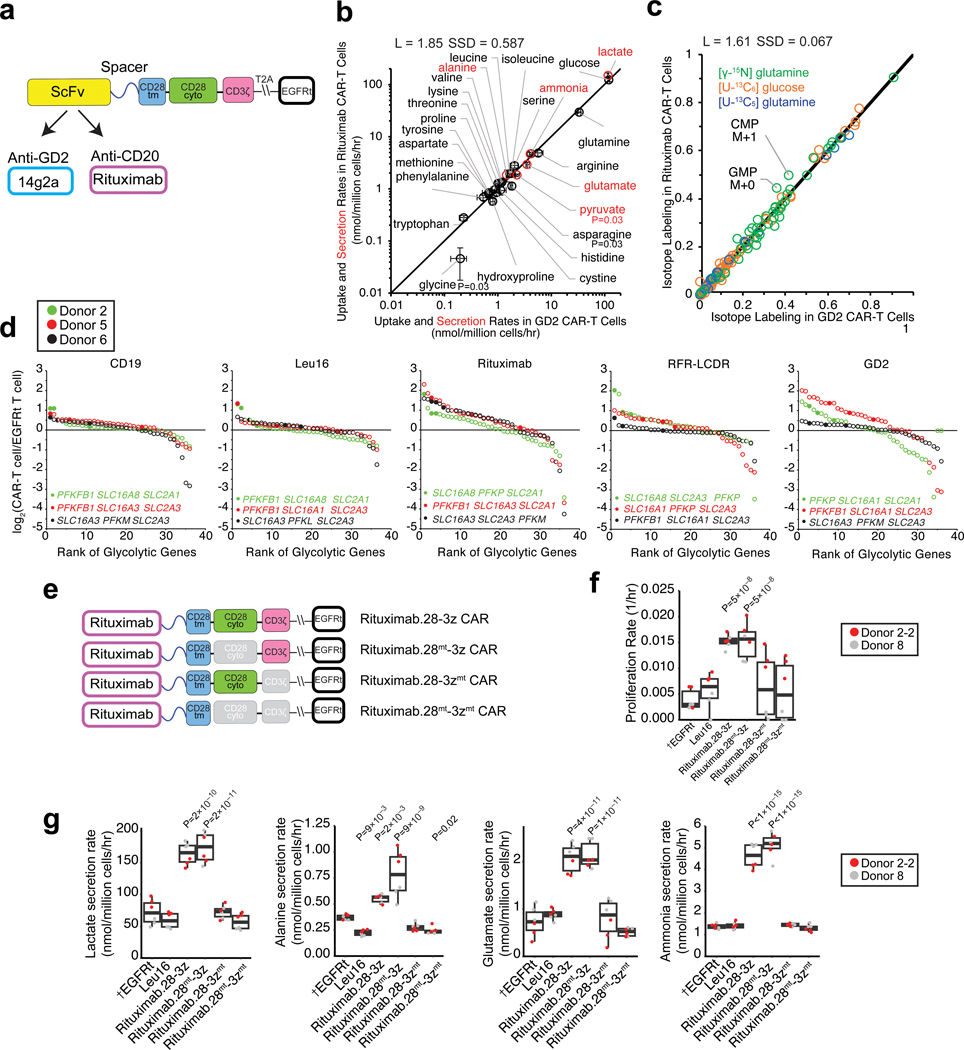
Metabolism is an indispensable part of T cell proliferation, activation and exhaustion, yet the metabolism of chimeric antigen receptor (CAR)-T cells remains incompletely understood. CARs are composed of extracellular domains-often single-chain variable fragments (scFvs)-that determine ligand specificity and intracellular domains that trigger signalling following antigen binding. Here, we show that CARs differing only in the scFv variously reprogramme T cell metabolism. Even without exposure to antigens, some CARs increase proliferation and nutrient uptake in T cells. Using stable isotope tracers and mass spectrometry, we observed basal metabolic fluxes through glycolysis doubling and amino acid uptake overtaking anaplerosis in CAR-T cells harbouring a rituximab scFv, unlike other similar anti-CD20 scFvs. Disparate rituximab and 14G2a-based anti-GD2 CAR-T cells are similarly hypermetabolic and channel excess nutrients to nitrogen overflow metabolism. Modest overflow metabolism of CAR-T cells and metabolic compatibility between cancer cells and CAR-T cells are identified as features of efficacious CAR-T cell therapy.


Conflict of interest statement

X.C. and Y.Y.C. are inventors of a patent whose value may be affected by the publication of this work. Y.Y.C. holds several patent applications in the area of CAR-T cell therapy. Y.Y.C. is a founder of, holds equity in, and receives consulting fees from ImmPACT Bio. Y.Y.C. is a member of the scientific advisory board of and holds equity in Catamaran Bio, Notch Therapeutics, Pluto Immunotherapeutics, Prime Medicine, Sonoma Biotherapeutics, and Waypoint Bio.

Figures

Extended Data Figure 1:
Extended Data Figure 1:. CAR-T cell transduction efficiencies, growth, and subtypes.
(a) Gating strategy for counting viable cells and quantifying their viability. Cell populations were gated for viable cells based on side-scatter area (SSC-A) vs. forward-scatter area (FSC-A) profiles. Viable cells were then gated for single cells based on FSC height (FSC-H) vs. FSC-A profiles. (b) CAR-T cells are viable up to 20 days post-retroviral transduction for Donor 6. Proliferation curves of CAR-T cells from days 17 to 20 post-transduction (left) and viability of CAR-T cells on day 20 post-transduction (right) are shown. (c) Antibody staining of EGFRt (transduction marker), IgG4 extracellular spacer (Fc), and N-terminal HA tag was used to quantify transduction efficiencies and CAR surface expression by flow cytometry. The CD19 CAR lacks the CH2-CH3 domain of the IgG4 and cannot be detected via Fc staining. The CD19 CAR and Leu16 CAR lack the N-terminal HA tag. Each box shows the three quartiles (with the center line representing the median), and the whiskers extend to the minimum and maximum values that are within 1.5-fold of the interquartile range (n=2–6 biologically independent samples). (d) CAR-T cell phenotypes for Donor 2 (left) and Donor 5 (right). The subtypes of CAR-T cells in in vitro culture were determined by CD4, CD8, CD45RA, and CD62L staining in the absence of antigen stimulation. (e) Growth curves of CAR-T cells generated using primary human T cells from healthy donors showed that most CAR-T cells and EGFRt control T cells grew after a complete media change to RPMI-1640 media supplemented with dFBS, IL-2, and IL-15 on day 0. Cell counts between day 1 and the last time point for each donor were used to calculate proliferation rates. Panels (b) and (d) show the mean ± s.e.m. with n=3 biological replicates. Statistical significance in panel (c) was determined using two-way analysis of variance (ANOVA) followed by Tukey’s multiple comparison test to compare the pairwise differences in EGFRt, FC (anti-CD20 CAR-T cells only), and HA (rituximab, RFR-LCDR, rituximab.AA, and RFR-LCDR.AA) staining.
Extended Data Figure 2:
Extended Data Figure 2:. The metabolome of EGFRt control T cells and CAR-T cells showed CAR-dependent metabolic profiles.
To account for batch effects, each metabolomics sample was normalized to its median ion count. Within each row, yellow and blue colors indicate higher and lower levels of a metabolite compared to the row mean of the respective donor CAR-T cells.
Extended Data Figure 3:
Extended Data Figure 3:. Central carbon metabolites, co-factor ratios, and metabolite secretion.
(a) Fructose-1,6-bisphosphate (FBP) levels were higher in the four rituximab-based CAR-T cells than in EGFRt control T cells. (b) TCA cycle metabolites were higher in rituximab CAR-T cells than in EGFRt control T cells. (c) ATP/ADP was significantly lower in rituximab CAR-T cells, while glutathione/glutathione disulfide (GSH/GSSG) and NADH/NAD+ ratios showed no statistical difference. (d) Higher fractions of glucose-derived carbons were secreted as lactate by the four rituximab-based CAR-T cells than by EGFRt control T cells. The lactate-to-glucose carbon flux ratio represents fermentative glycolytic activity. (e) In anti-CD19 and rituximab-based CAR-T cells, higher fractions of glutamine were diverted to glutamate secretion than in EGFRt control T cells. (f) Even in the presence of alanine in the media, rituximab-based CAR-T cells secreted alanine at substantial rates unlike EGFRt control T cells, anti-CD19 CAR-T cells, and Leu16 anti-CD20 CAR-T cells, which consumed alanine. Each box in panels (a)-(e) shows the three quartiles (with the center line representing the median), and the whiskers extend to the minimum and maximum values that are within 1.5-fold of the interquartile range (n=3–15 biological replicates from up to five donors). Metabolite levels in (a)-(c) are normalized to EGFRt control T cells, and the ratios are taken from the normalized metabolite levels. Statistical significance in panels (a)-(e) was determined by two-tailed t tests for a linear mixed-effects model (see Methods) in reference to EGFRt control T cells (†). Panel (f) shows the mean ± s.e.m. with n=3 biological replicates. Statistical significance in panel (f) was determined by two-tailed t test in reference to EGFRt control T cells (†). n.s. indicates no statistical significance.
Extended Data Figure 4:
Extended Data Figure 4:. The TCA cycle activity in CAR-T cells.
(a) [U-13C6]glucose isotope tracing shows expected labeling patterns in the TCA cycle intermediates. (b) [U-13C5]glutamine isotope tracing shows expected labeling patterns in the TCA cycle intermediates. (c) The contribution of glucose to α-ketoglutarate was lower in rituximab anti-CD20 CAR-T cells compared to that of EGFRt control T cells based on the significantly higher M+0 fraction in the former. EGFRt T cells and CAR-T cells from Donors 1 and 4 were labeled for 72 hours in media containing [U-13C6]glucose. Labeling fractions were corrected for natural isotope abundance and impurities. (d) Glutamine contribution to α-ketoglutarate was significantly higher in rituximab anti-CD20 CAR-T cells than in EGFRt control T cells. EGFRt T cells and CAR-T cells from Donor 3 were labeled for 48 hours in media containing 50% [U-13C5]glutamine. Labeling fractions were corrected for natural isotope abundance and impurities. (e) The relative contributions of glucose and glutamine on a carbon basis to the TCA cycle intermediates in the CAR-T cell panel indicated that citrate was derived mainly from glucose while the downstream TCA cycle metabolites were derived mainly from glutamine. Rituximab CAR-T cells displayed higher glutamine-to-glucose contribution ratios compared to EGFRt control T cells. The carbon contributions of glucose and glutamine were obtained by measuring the fractions of the total carbons (12C+13C) of individual metabolites that were 13C and accounting for the enrichment fractions of the respective 13C tracers (see Supplementary Note 5). Panel (c) shows the mean ± s.e.m. with n=6 biological replicates. Panel (d) shows the mean ± s.e.m. with n=3 biological replicates. Statistical significance in panels (c) and (d) was determined by two-tailed t tests in reference to EGFRt control T cells (†) for M+0 labeling. Panel (e) shows the mean ± propagated error, and statistical significance was determined by bootstrapping (see Supplementary Note 5). n.s. indicates no statistical significance.
Extended Data Figure 5:
Extended Data Figure 5:. Tracing nitrogen and carbon reveals nucleotide turnover.
(a) EGFRt T cells and CAR-T cells from Donor 4 were cultured in media containing 50% [γ−15N]glutamine and 50% unlabeled glutamine for 72 hours. Adenosine diphosphate and monophosphate were labeled more in all CAR-T cells than in EGFRt control T cells. Uridine diphosphate in anti-CD20 CAR-T cells and many of the nucleotides in rituximab CAR-T cells were significantly more labeled than those of EGFRt control T cells. (b) EGFRt T cells and CAR-T cells from Donor 5 were cultured in media containing [1,2-13C2]glucose for 48 hours. Nucleotide diphosphates and monophosphates were significantly more labeled in rituximab and RFR-LCDR CAR-T cells than in EGFRt control T cells. The greater labeling fractions in the same (48- and 72-hour) time periods indicated faster nucleotide turnover in rituximab and RFR-LCDR CAR-T cells. The signals of 13C-labeled CDP, CMP, and GMP were too low to be reliable (n.d.). 13C-labeling fractions were corrected for natural isotope abundance and impurities. Plots show the mean ± s.e.m. with n=3 biological replicates. Statistical significance was determined by two-tailed t test in reference to EGFRt control T cells (†) for M+0 labeling. n.s. indicates no statistical significance.
Extended Data Figure 6:
Extended Data Figure 6:. Overflow metabolism and in vivo efficacy of CAR-T cells.
(a) Ammonia can be incorporated into metabolism via glutamate, glutamine, and carbamoyl phosphate. (b-e) EGFRt T cells and CAR-T cells from Donor 4 were cultured in media containing 800 μM 15NH4Cl for 72 hours. (b) Incorporation of 15N from the labeled ammonia (15NH3) into glutamate was minimal in all T cells but significantly higher for anti-CD19 and rituximab-based anti-CD20 CAR-T cells compared with EGFRt control T cells. (c) Incorporation of 15N from 15NH3 into carbamoyl phosphate was minimal in all T cells but significantly lower for rituximab CAR-T cells compared with EGFRt T cells. (d) Incorporation of 15N from 15NH3 into glutamine was significantly lower for anti-CD19 and rituximab-based anti-CD20 CAR-T cells compared with EGFRt control T cells. (e) EGFRt T cells and CAR-T cells secreted thymine, uracil, and xanthine. (f-g) Raji and Ramos lymphoma cells were cultured for 48 hours. (f) Proliferation rates were determined based on the changes in cell numbers between day 1 and day 2. (g) Nutrient uptake and byproduct secretion rates were compared between Raji and Ramos cells. (h) Kaplan-Meier survival curve against Ramos cancer cells. NOD/SCID/IL-2Rγnull (NSG) mice (n=6 animals) were injected intravenously with Ramos cells and subsequently treated with control (EGFRt), anti-CD19, or anti-CD20 CAR T cells. In panels (b)-(e), plots show the mean ± s.e.m. with n=3 biological replicates, and statistical significance was determined by two-tailed t tests in reference to EGFRt control T cells (†). Panels (f)-(g) show the mean ± s.e.m. with n=3 biological replicates, and statistical significance was determined by two-tailed t tests. Statistical significance in panel (h) was determined by multiple log-rank (Mantel-Cox) tests with adjustment using the Benjamini-Hochberg FDR controlling procedure.
Extended Data Figure 7:
Extended Data Figure 7:. Comparison of metabolic fluxes across CAR-T cell variants.
(a) Anti-GD2 CAR-T cells were more similar to rituximab CAR-T cells than any other CAR-T cell variants in terms of nutrient uptake rates (black) and byproduct secretion rates (red) (cf. Fig. 6b). SSD is the sum of squared differences, and L is the total distance between individual points and the line of unity. Plot shows the mean ± s.e.m. with n=12 biological replicates for EGFRt control T cells and anti-CD20 CAR-T cells and n=6 biological replicates for anti-GD2 CAR-T cells. (b) Metabolite labeling patterns in CAR-T cells, which were fed 50% [γ−15N]glutamine, [U-13C6]glucose, and [U-13C5]glutamine, showed the greatest similarity between 14g2a-based anti-GD2 CAR-T cells and rituximab CAR-T cells (cf. Fig. 6c). (c-d) EGFRt T cells and CAR-T cells from Donor 4 were cultured in media containing 50% [γ−15N]glutamine for 72 hours. 15N-labeled pyrimidine and purine nucleobases were measured from media samples collected each day. Ion counts for xanthine represent the sum of M+1 and M+2 15N-labeled ions. (c) Rituximab anti-CD20 and 14g2a anti-GD2 CAR-T cells displayed similarly high accumulation of purine and pyrimidine nucleobases. (d) The four rituximab-based CAR-T cells had faster nucleotide degradation than EGFRt control T cells. Alanine insertions in the non-signaling intracellular domains of CARs resulted in significant differences in thymine secretion. Panels (c) and (d) show the mean ± s.e.m. with n=3 biological replicates, and statistical significance was determined by two-tailed t tests in reference to the day-3 media sample from EGFRt control T cells (†). Further statistical tests were conducted between rituximab and anti-GD2 CAR-T cells, rituximab and rituximab.AA CAR-T cells, and RFR-LCDR and RFR-LCDR.AA CAR-T cells for day-3 nucleobase measurements. n.s. indicates no statistical significance.
Extended Data Figure 8:
Extended Data Figure 8:. Tracing nitrogen and carbon in nucleotide and hexosamine biosynthesis in CAR-T cells with two-alanine insertions.
(a) EGFRt T cells and CAR-T cells from Donor 4 were cultured in media containing 50% [γ−15N]glutamine for 72 hours. Many nucleotides were labeled more in rituximab-based CAR-T cells than in EGFRt control T cells. Alanine insertions resulted in minimal differences. (b-c) EGFRt T cells and CAR-T cells from Donor 5 were cultured in media containing [1,2-13C2]glucose for 48 hours. (b) Many nucleotides were labeled more in rituximab-based CAR-T cells than in the EGFRt control T cells. Alanine insertions resulted in minimal differences. The signals of 13C-labeled CDP, CMP, and GMP were too low to be reliable (n.d.). (c) N-acetylglucosamine-1/6-phosphate (GlcNAc-1/6P) and UDP-N-acetylglucosamine (UDP-GlcNAc) were labeled more in rituximab-based CAR-T cells than in EGFRt control T cells. Rituximab.AA and RFR-LCDR.AA CAR-T cells with alanine insertions increased M+0 fractions of UDP-GlcNAc compared with rituximab and RFR-LCDR CAR-T cells, respectively. 13C-labeling fractions were corrected for natural isotope abundance and impurities. Plots show the mean ± s.e.m. with n=3 biological replicates. Statistical significance of the observed M+0 labeling fractions was determined by two-tailed t test in reference to EGFRt control T cells (†), between rituximab and rituximab.AA CAR-T cells, and between RFR-LCDR and RFR-LCDR.AA CAR-T cells. n.s. indicates no statistical significance.
Extended Data Figure 9:
Extended Data Figure 9:. CAR-T cells were cultured in the absence of antigen stimulation for RNA-seq.
Across three donors, genes associated with (a) glycolysis, (b) the pentose phosphate pathway, (c) the TCA cycle, (d) nucleotide biosynthesis, (e) hexosamine biosynthesis, (f) pyrimidine degradation, (g) purine degradation, and (h) glutamine metabolism are shown. Each row indicates a donor (Donor 2, 5, or 6). Within each row, yellow and blue colors indicate higher and lower levels of the transcript compared with EGFRt control T cells. Arrow colors represent the standard Gibbs free energy of reaction ΔrG’°, which approximates the extent of metabolic flux control based on how close to or far away from equilibrium the reaction is.
Extended Data Figure 10:
Extended Data Figure 10:. Electrostatic property and phosphorylation of CARs may affect T-cell activation and exhaustion.
(a) Activation- (top row) and exhaustion-marker (bottom row) expression on mutant rituximab CAR-T cells were compared to EGFRt, Leu16 CAR-, and rituximab CAR-T cells (n=6 biological replicates from two donors). (b) Phosphorylation of the signaling domains of CARs including the three ITAM regions of CD3ζ was measured (n=2 biologically independent samples). Even with good peptide sequence coverage, CD28 phosphopeptide was below the limit of detection. (c) Top three largest positively charged patches (PCPs) containing continuous positive charged residues are shown in each scFv. Dark blue, largest PCP; medium blue, second largest PCP; light blue, third largest PCP. PCP score (sum of the number of residues in the three largest PCPs) and charge per amino acid are displayed under each construct. (d) Activation- (top row) and exhaustion-marker (bottom row) expression on CAR-T cells were evaluated on day 2 or 3 without antigen stimulation (n=12–18 biological replicates from up to six donors). Donors 2–2 and 5–2 represent second batches of transduced cells from Donors 2 and 5, respectively. Each box in panels (a) and (d) shows the three quartiles (with the center line representing the median), and the whiskers extend to the minimum and maximum values that are within 1.5-fold of the interquartile range. Statistical significance for activation and exhaustion markers in panels (a) and (d) was determined by two-tailed t tests for a linear mixed-effects model (see Methods) in reference to EGFRt control T cells (†). Statistical significance in panel (b) was determined using two-way analysis of variance (ANOVA) followed by Tukey’s multiple comparison test to compare the pairwise differences in ITAM1, ITAM2, and ITAM3 phosphorylation.
Figure 1:
Figure 1:. Construction, proliferation, and metabolome of CAR-T cells.
(a) CAR proteins consist of extracellular domains for antigen binding and intracellular domains for signaling. The scFvs, which determine antigen specificity, were derived from three monoclonal antibodies (FMC63, Leu16, and rituximab) and fused to extracellular spacers followed by CD28 transmembrane (tm) and cytoplasmic (cyto) domains as well as CD3ζ signaling domain. Truncated EGFR (EGFRt) was co-expressed via a self-cleaving (T2A) peptide and used as a transduction marker. Two alanine residues were inserted between the transmembrane and intracellular domains in rituximab.AA and RFR-LCDR.AA CARs. (b) RFR-LCDR CAR was constructed by hybridizing the framework regions (FRs) of rituximab and the complementarity-determining regions (CDRs) of Leu16. (c) The timeline marks T-cell isolation, transduction, expansion, and measurement of proliferation and metabolome. CAR-T cells were generated from human primary T cells between T–16 and T–11 days. T cells were enriched for CAR+ expression by magnetic-activated cell sorting and seeded in fresh RPMI + dFBS media on day 0. Cells were counted for 2 or 3 days, after which their metabolites were extracted for LC-MS analysis. (d) Proliferation rates were determined based on the changes in cell numbers between day 1 and the last time point for each donor’s cells. T cells expressing rituximab-based (rituximab, RFR-LCDR, rituximab.AA, and RFR-LCDR.AA) anti-CD20 CARs grew faster than EGFRt control T cells. Each box shows the three quartiles (with the center line representing the median), and the whiskers extend to the minimum and maximum values that are within 1.5-fold of the interquartile range (n=9 or 15 biological replicates derived from up to five donors). Statistical significance was determined by two-tailed t tests for a linear mixed-effects model (see Methods) in reference to EGFRt control T cells (†). (e) CAR-T cells showed CAR-dependent metabolite abundances. Within each row, yellow and blue colors indicate higher and lower levels of a metabolite compared to EGFRt control T cells.
Figure 2:
Figure 2:. Glycolysis and pentose phosphate pathway (PPP) activity in CAR-T cells.
(a) The experimental timeline marks T-cell seeding in isotope-labeled medium, medium collection, and measurement of intracellular and extracellular metabolites. CAR-T cells were seeded in fresh 13C- or 15N-labeled media at t=0 hours. Media samples were collected for LC-MS analysis between day 1 and the last time point for each donor’s cells, after which cells were also harvested for intracellular metabolite measurement. No media samples were collected for Donor 5. (b) Glucose uptake and lactate secretion rates in rituximab and rituximab.AA anti-CD20 CARs were elevated. Each box shows the three quartiles (with the center line representing the median), and the whiskers extend to the minimum and maximum values that are within 1.5-fold of the interquartile range (n=6 or 12 biological replicates derived from up to four donors). (c-f) EGFRt T cells and CAR-T cells were cultured in media containing [1,2-13C2]glucose for 48 hours. (c) Singly 13C-labeled (M+1) lactate is only generated through the oxidative PPP (oxPPP), while doubly 13C-labeled (M+2) lactate comes from either glycolysis or oxPPP. (d) The (M+1)/(M+2) ratio indicates the activity of oxPPP relative to glycolysis. All but Leu16 CAR-T cells showed lower relative oxPPP activity than EGFRt control T cells. (e) Depending on its synthesis route (oxPPP or non-oxPPP), pentose phosphate contains odd or even numbers of 13C atoms. Pentose phosphate M+1 and M+3 originate from oxPPP, whereas M+2 and M+4 originate from non-oxPPP. (f) The odd-to-even 13C-labeling ratio of pentose phosphate indicated that the relative usage of oxPPP and non-oxPPP for the nucleotide precursor did not change with CAR expression. Panels (d) and (f) show the mean ± the standard error of the mean (s.e.m.) with n=3 biological replicates from Donor 5. Statistical significance of glucose uptake and lactate secretion rates was determined by two-tailed t tests for a linear mixed-effects model (see Methods) in reference to EGFRt control T cells (†). Statistical significance of labeling measurement was determined by one-way analysis of variance (ANOVA) followed by Tukey’s multiple comparison test in reference to EGFRt control T cells (†). n.s. indicates no statistical significance.
Figure 3:
Figure 3:. Rituximab-based CD20 CARs increase T-cell metabolic fluxes.
(a) Amino acid uptake rates were mostly elevated in CAR-T cells compared with EGFRt control T cells. The data represent the mean of measurements from Donors 1–4 cells. (b) Glutamate secretion rates were faster in anti-CD19 and rituximab-based anti-CD20 CAR-T cells compared to the EGFRt control T cells. (c) Rituximab and rituximab.AA CAR-T cells secreted alanine significantly faster than EGFRt control T cells. Each box in (b) and (c) shows the three quartiles (with the center line representing the median), and the whiskers extend to the minimum and maximum values that are within 1.5-fold of the interquartile range (n=6 or 12 biological replicates from up to four donors). (d) Metabolic fluxes through central carbon metabolism were compared between EGFRt control T cells and rituximab anti-CD20 CAR-T cells, which showed the largest differences in uptake and secretion rates as well as isotope labeling patterns (Extended Data Fig. 4). Metabolic flux analysis was performed using nutrient uptake rates, byproduct secretion rates, and intracellular metabolite labeling patterns in cells that were fed [1,2-13C2]glucose, [U-13C6]glucose, or 50% [U-13C515N2]glutamine, which were obtained from Donors 1–6 cells (see Methods). Arrow widths represent the magnitudes of fluxes, normalized to glucose uptake (GLC UPT), for EGFRt T cells. Red and blue colors indicate higher and lower fluxes in rituximab CAR-T cells with respect to EGFRt control T cells, while gray indicates low-confidence flux shifts. Statistical significance for glutamate and alanine secretion in panels (b) and (c) was determined by two-tailed t tests for a linear mixed-effects model (see Methods) in reference to EGFRt control T cells (†).
Figure 4:
Figure 4:. Tracing nitrogen and carbon in nucleotide and hexosamine biosynthesis.
(a) The fates of 15N in [γ−15N]glutamine include ammonia, asparagine, nucleotides, and hexosamines. (b) Nucleotide biosynthesis map shows how stable isotopes of [γ−15N]glutamine and [1,2-13C2]glucose are incorporated into pyrimidines and purines. (c) EGFRt T cells and CAR-T cells from Donor 4 were cultured in media containing 50% [γ−15N]glutamine for 72 hours. Nucleotides were labeled more in anti-CD20 CAR-T cells, especially those with rituximab and RFR-LCDR CARs, than in EGFRt control T cells. (d-e) EGFRt T cells and CAR-T cells from Donor 5 were cultured in media containing [1,2-13C2]glucose for 48 hours. (d) Nucleotides were labeled more in rituximab and RFR-LCDR CAR-T cells than in EGFRt control T cells. The greater labeling fractions in the same (48- and 72-hour) time periods indicated faster nucleotide turnover in rituximab and RFR-LCDR CAR-T cells than in EGFRt control T cells. (e) Hexosamine biosynthesis pathway incorporates glucose carbons and glutamine nitrogen into pathway intermediates. N-acetylglucosamine-1/6-phosphate (GlcNAc-1/6P) and UDP-N-acetylglucosamine (UDP-GlcNAc) were labeled more in rituximab and RFR-LCDR CAR-T cells than in EGFRt control T cells, indicating their increased turnover in the CAR-T cells. 13C-labeling fractions were corrected for natural isotope abundance and impurities. Panels (c-e) show the mean ± s.e.m. with n=3 biological replicates. Statistical significance was determined by two-tailed t test in reference to EGFRt control T cells (†) for M+0 labeling.
Figure 5:
Figure 5:. Overflow metabolism and metabolic compatibility.
(a) Ammonia secretion rates of CAR-T cells were measured. Each box shows the three quartiles (with the center line representing the median), and the whiskers extend to the minimum and maximum values that are within 1.5-fold of the interquartile range (n=12 biological replicates from four donors). (b) Nucleotide degradation pathway shows the fates of 15N from [γ−15N]glutamine to nucleobases. Uracil, thymine, and xanthine (underlined) were secreted by T cells. (c) EGFRt and CAR-T cells from Donor 4 were cultured in media containing 50% [γ−15N]glutamine for 72 hours. 15N-labeled pyrimidine and purine nucleobases were measured from media samples collected each day. (d) The fractions of glutamine-derived nitrogen that were secreted as glutamate, alanine, ammonia, and nucleobases were calculated from uptake and secretion rates. (e) Proliferation rates for EGFRt control T cells and CAR-T cells grown in media containing alanine, ammonia, and/or lactate to mimic the tumor microenvironment. Each box shows the three quartiles (with the center line representing the median), and the whiskers extend to the minimum and maximum values that are within 1.5-fold of the interquartile range (n= 3, 6, or 9 biological replicates from up to three donors). (f) The in vivo efficacy of CAR-T cells was plotted with corresponding metabolic compatibility between cancer and CAR-T cells and overflow metabolism score of CAR-T cells (see Supplementary Note 1). Plot shows the mean ± s.e.m. with n=6 or 12 biological replicates. The marker sizes and colors represent the mean and the relative standard deviation of the days that tumor-bearing mice (n=6 animals) survive with respective CAR-T cell treatment. Gray lines are visual guides for separating efficacious treatment groups. Statistical significance in panels (a) and (e) was determined by two-tailed t tests for a linear mixed-effects model (see Methods) in reference to EGFRt control T cells (†) for ammonia secretion and the control media condition for proliferation rates for each cell type. Panels (c) and (d) show the mean ± s.e.m. with n=3 biological replicates, and statistical significance was determined by two-tailed t tests in reference to EGFRt control T cells (†).
Figure 6:
Figure 6:. Mechanistic insights into unexpected hypermetabolism in CAR-T cells.
(a) The 14g2a-based anti-GD2 (GD2) CAR was constructed similarly to the rituximab anti-CD20 CAR, with the scFv as the only difference. (b) Rituximab anti-CD20 CAR-T cells from Donors 1–4 and GD2 CAR-T cells from Donors 3 and 4 displayed similar rates of nutrient uptake (black) and byproduct secretion (red). SSD is the sum of squared differences, and L is the total distance between individual points and the line of unity. Plot shows the mean ± s.e.m. with n=6 or 12 biological replicates. Statistical significance was determined by two-tailed t test. (c) Metabolites in rituximab and GD2 CAR-T cells, which were fed [γ−15N]glutamine, [U-13C6]glucose, or [U-13C5]glutamine, were labeled similarly. Metabolites with a distance of at least 0.05 are labeled. The transport fluxes and isotope labeling patterns revealed that GD2 CAR-T cells were metabolically most similar to rituximab CAR-T cells (cf. Extended Data Fig. 7). (d) Glycolytic gene expression in CAR-T cells relative to EGFRt control T cells is rank ordered with filled dots representing the highest ranked isoform involved in each of the three rate-determining steps of glycolysis: glucose import (SLC2A1 and SLC2A3), phosphofructokinase (PFKL, PFKM, PFKP, PFKFB1, and PFKFB3), and lactate export (SLC16A1, SLC16A3, SLC16A7, and SLC16A8). (e) Three mutants of rituximab CAR were generated to disable the phosphorylation of CD28 and/or CD3ζ signaling domains: rituximab.28mt-3z, rituximab.28–3zmt, and rituximab.28mt-3zmt. (f) Proliferation rates of CAR-T cells were determined based on the cell number changes over time. Donor 2–2 represents a second batch of transduced cells from Donor 2. (g) The secretion rates of lactate, alanine, glutamate, and ammonia in mutant rituximab anti-CD20 CAR-T cells were compared to those of EGFRt control, Leu16 CAR-, and rituximab CAR-T cells. Each box in panels (f) and (g) shows the three quartiles (with the center line representing the median), and the whiskers extend to the minimum and maximum values that are within 1.5-fold of the interquartile range (n=6 biological replicates from two donors). Statistical significance was determined by two-tailed t tests for a linear mixed-effects model (see Methods) in reference to EGFRt control T cells (†).

Update of

References

    1. Ho P. & Chen YY Synthetic Biology in Immunotherapy and Stem Cell Therapy Engineering. in Synthetic Biology 349–372 (Wiley-VCH Verlag GmbH & Co. KGaA, 2018). doi:10.1002/9783527688104.ch17. - DOI
    1. Brudno JN et al. T Cells Genetically Modified to Express an Anti-B-Cell Maturation Antigen Chimeric Antigen Receptor Cause Remissions of Poor-Prognosis Relapsed Multiple Myeloma. J. Clin. Oncol 36, 2267–2280 (2018). - PMC - PubMed
    1. Cohen AD et al. Safety and Efficacy of B-Cell Maturation Antigen (BCMA)-Specific Chimeric Antigen Receptor T Cells (CART-BCMA) with Cyclophosphamide Conditioning for Refractory Multiple Myeloma (MM). Blood 130, 505–505 (2017).
    1. Majzner RG & Mackall CL Clinical lessons learned from the first leg of the CAR T cell journey. Nat. Med vol. 25 1341–1355 (Nature Publishing Group, 2019). - PubMed
    1. Rafiq S, Hackett CS & Brentjens RJ Engineering strategies to overcome the current roadblocks in CAR T cell therapy. Nat. Rev. Clin. Oncol 2019 173 17, 147–167 (2019). - PMC - PubMed

MeSH terms