. 2024 Apr 24;19(1):38.
doi: 10.1186/s13024-024-00726-8.

Adaptive immune changes associate with clinical progression of Alzheimer's disease

Affiliations

Adaptive immune changes associate with clinical progression of Alzheimer's disease

Lynn van Olst et al. Mol Neurodegener. .

Abstract

Background: Alzheimer's disease (AD) is the most frequent cause of dementia. Recent evidence suggests the involvement of peripheral immune cells in the disease, but the underlying mechanisms remain unclear.

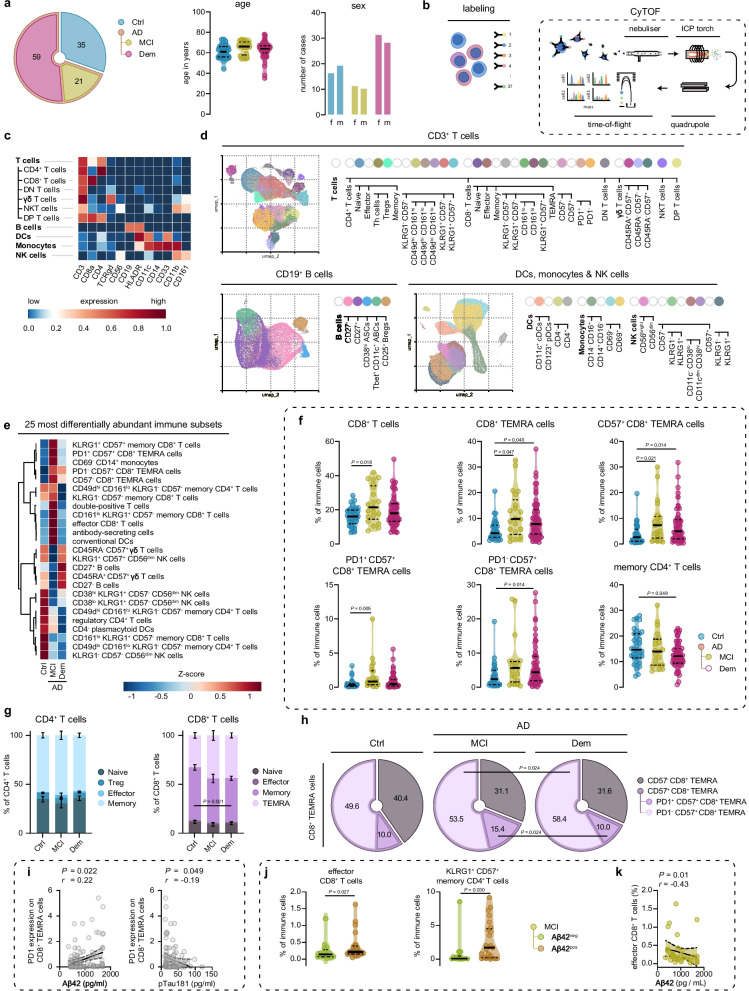
Methods: We comprehensively mapped peripheral immune changes in AD patients with mild cognitive impairment (MCI) or dementia compared to controls, using cytometry by time-of-flight (CyTOF).

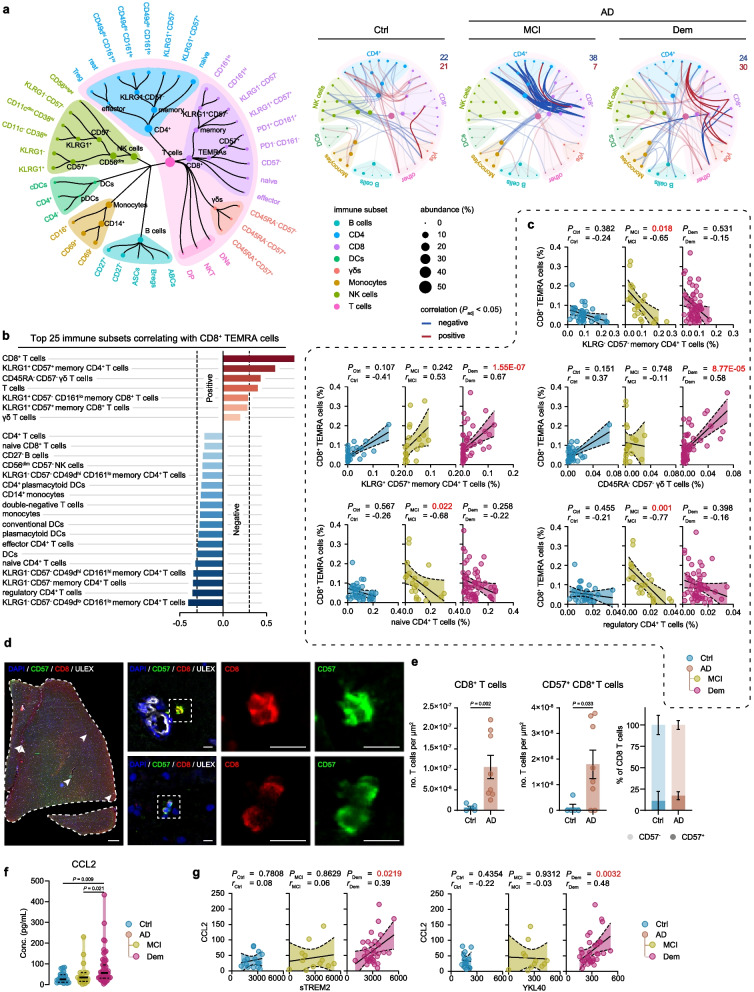
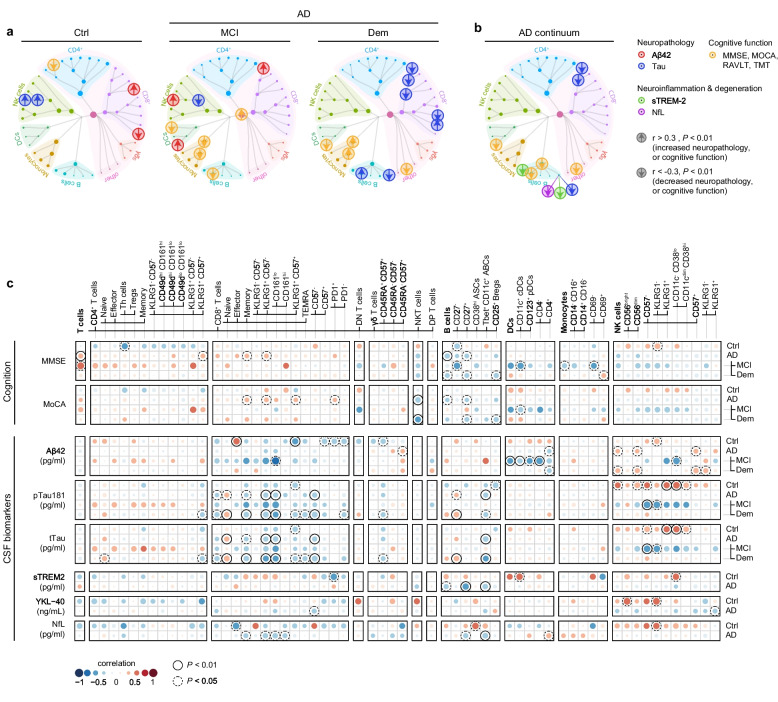
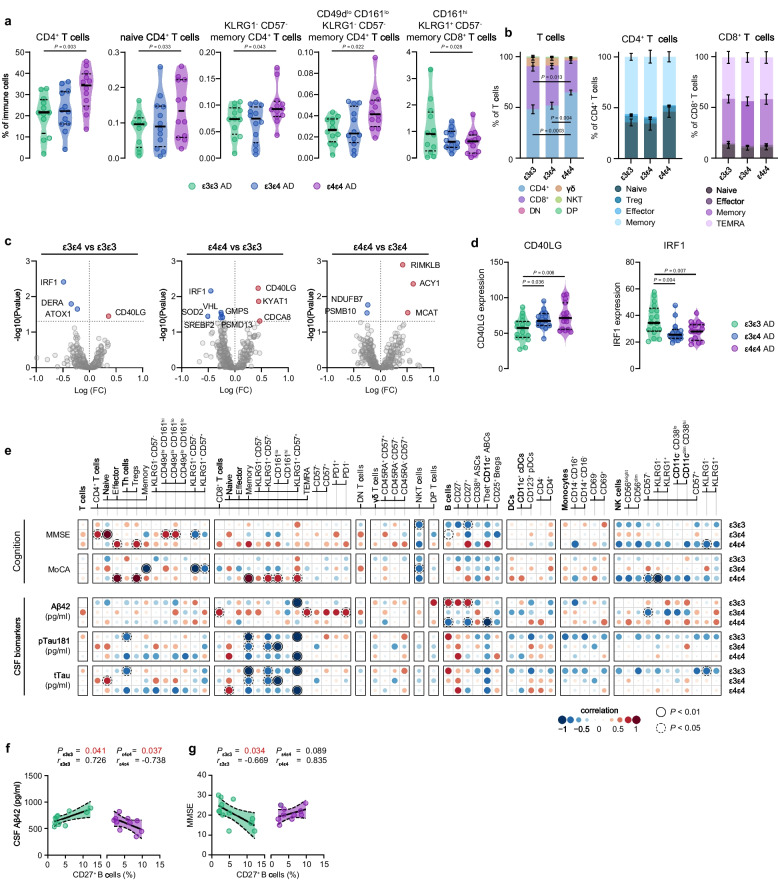
Results: We found an adaptive immune signature in AD, and specifically highlight the accumulation of PD1+ CD57+ CD8+ T effector memory cells re-expressing CD45RA in the MCI stage of AD. In addition, several innate and adaptive immune cell subsets correlated to cerebrospinal fluid (CSF) biomarkers of AD neuropathology and measures for cognitive decline. Intriguingly, subsets of memory T and B cells were negatively associated with CSF biomarkers for tau pathology, neurodegeneration and neuroinflammation in AD patients. Lastly, we established the influence of the APOE ε4 allele on peripheral immunity.

Conclusions: Our findings illustrate significant peripheral immune alterations associated with both early and late clinical stages of AD, emphasizing the necessity for further investigation into how these changes influence underlying brain pathology.

Keywords: APOE; Adaptive immunity; Alzheimer’s disease; Neuroinflammation; T cells; TEMRA cells.


Conflict of interest statement

CET has research contracts with Acumen, ADx Neurosciences, AC-Immune, Alamar, Aribio, Axon Neurosciences, Beckman-Coulter, BioConnect, Bioorchestra, Brainstorm Therapeutics, Celgene, Cognition Therapeutics, EIP Pharma, Eisai, Eli Lilly, Fujirebio, Instant Nano Biosensors, Novo Nordisk, Olink, PeopleBio, Quanterix, Roche, Toyama, Vivoryon. CET is editor in chief of Alzheimer Research and Therapy, and serves on editorial boards of Medidact Neurologie/Springer, and Neurology: Neuroimmunology & Neuroinflammation. CET had consultancy/speaker contracts for Eli Lilly, Merck, Novo Nordisk, Olink and Roche. WMF has performed contract research for Biogen MA Inc, and Boehringer Ingelheim. WMF has been an invited speaker at Boehringer Ingelheim, Biogen MA Inc, Danone, Eisai, WebMD Neurology (Medscape), and Springer Healthcare. WMF has been a consultant to Oxford Health Policy Forum CIC, Roche, and Biogen MA Inc. WMF participated in advisory boards of Biogen MA Inc and Roche. WMF was associate editor of Alzheimer, Research & Therapy in 2020/2021. WMF is associate editor at Brain.

Figures

Fig. 1
Fig. 1
Peripheral CD8+ TEMRA cells accumulate in AD patients before the onset of dementia. a Cohort demographics. b Experimental overview c. Heatmap showing median expression values of selected markers for the major immune cell populations. d UMAPs displaying pre-gated T cells, B cells and DCs, monocytes and NK cells from the blood of control and AD cases. Colors correspond to PARC-guided clustering. e Heatmap showing the top 25 populations with differential abundance between groups measured by ANOVA. f Violin plots displaying the percentage of significant different immune cell subsets out of the total CD45+ immune population using a GLM with age and sex as covariates. g Stacked bar graphs showing the percentage of CD4+ and CD8+ T cell subpopulations of total CD4+ T cells and CD8+ T cells using a GLM with age and sex as covariates. h Pie charts showing the percentage of CD8+ TEMRA subpopulations of total CD8+ TEMRA cells. i Correlation graph showing the association between PD1 expression on CD8+ TEMRA cells and CSF-derived Aβ42 (left) and pTau181 (right) levels using a Spearman's rho correlation with age/sex correction in the entire cohort. j Violin plots displaying the percentage of significant different T cell subsets out of the total CD45+ immune population using a GLM with age and sex as covariates between Aβ-negative and –positive patients with MCI. k Correlation graph showing the association between effector CD8+ T cells and CSF-derived Aβ42 levels using a Spearman's rho correlation with age/sex correction. f, j Violin plots show median ± quartiles. i, k Correlation plot show linear regression ± 95% confidence intervals; a-k. n = 115 in total, n = 35 of control, n = 21 of MCI due to AD, n = 59 of Dem, n = 16 Aβ MCI spectrum, n = 25 Aβ+ MCI spectrum; 3,204,588 CD3+ T cells, 3,168,876 DCs, monocytes & NK cells and 2,288,834 CD19+ B cells were imputed in the clustering analyses; GLM = multivariate general linear model; Ctrl = Control, MCI = mild cognitive impairment; Dem = ; AD = Alzheimer’s disease; TEMRA = terminally differentiated effector memory cells re-expressing CD45RA; DCs = dendritic cells; γδ = gamma-delta; NK = natural-killer
Fig. 2
Fig. 2
Peripheral CD8+ TEMRA cells are inversely correlated to CD4+ T cell subsets in AD patients. a Spearman correlation network of immune populations with nodes visualizing immune subsets and lines representing correlation coefficients for unique relationships between clusters. The size of the nodes represents the abundance of the population, and the color nodes represent the immune parent. Blue lines and red lines represent respectively negative and positive correlations between connected immune subsets. Darker colors present correlations with CD8+ TEMRA subsets. b Graph displays the 25 strongest Spearman correlations between CD8+ TEMRA cells and other immune subsets within the cohort. c Correlation graph showing Spearman's rho correlation with age/sex correction of CD8+ TEMRA cells with selected immune cell populations. Graph shows linear regression ± 95% confidence intervals. d Representative immunohistochemical staining of CD57+ CD8+ T cells in the middle temporal gyrus. The merged overview shows DAPI (blue), ULEX (white), CD8 (red), and CD57 (green). A magnified image shows the separate channels of CD57 and CD8. Scale bar = 1 mm for overview and 10 μm for magnifications. e Bargraph showing the total number of CD8+ and CD57+ CD8+ T cells in the middle temporal gyrus. Bargraphs show mean ± SEM, Mann–Whitney test. f Violin plot displaying the concentration of CCL2 in blood plasma using a GLM with age and sex as covariates. g Correlation graph showing correlations of CCL2 with sTREM2 and YKL40. Graph shows linear regression ± 95% confidence intervals, Spearman's rho correlation with age/sex correction. a-c n = 35 of control, n = 21 of MCI due to AD, n = 57 of Dem. d-e n = 5 of control, n = 8 AD. a-e. f-g n = 24 of control, n = 19 of MCI due to AD, n = 55 of Dem. GLM = multivariate general linear model; Ctrl = Control, MCI = mild cognitive impairment; Dem = dementia; AD = Alzheimer’s disease; TEMRA = effector memory CD8+ T cell re-expressing CD45RA
Fig. 3
Fig. 3
Correlations between peripheral immune subsets and CSF biomarkers for AD pathology and cognition. a, b Clinical outcome measurements are plotted on top of the immune cell network, where the size of the nodes represents the abundance of the population, and the color of nodes represents the immune parent. Circles corresponds to a relation (P < 0.01, Spearman's rho correlation with age/sex correction) between an immune subset and (a) CSF Aβ42 (red), CSF tTau and pTau (blue), cognitive function (yellow) and (b) sTREM-2 (green) and, NfL (purple). Values of CSF Aβ42 and TMT cognitive tests were inverted so that arrows indicate the positive (up) or negative (down) link with CSF biomarkers of AD neuropathology (CSF Aβ42, tTau, and pTau), neuroinflammation or degeneration (CSF sTREM-2 and NfL) and cognitive function (MMSE, MOCA, RAVLT, and TMT). c Correlation matrix showing the association between immune cell populations with CSF biomarkers for AD neuropathology or cognition. A partial two-tailed Spearman correlation was performed and controlled for age and sex. n = 35 of control, n = 21 of MCI due to AD, n = 59 of Dem, n = 80 of AD. For sTREM2, YKL − 40, Nfl; n = 20 of control, n = 52 of AD. CSF = cerebrospinal fluid; GLM = multivariate general linear model; Ctrl = Control, MCI = mild cognitive impairment; Dem = dementia; AD = Alzheimer’s disease; Aβ42 = amyloid-beta 1–42; pTau = tau phosphorylated at threonine 181; tTau = total tau; sTREM-2 = soluble triggering receptor expressed on myeloid cells 2; NfL = neurofilament light; MMSE = Mini-Mental State Examination; MOCA = Montreal Cognitive Assessment; RAVLT = Rey Auditory Verbal Learning Tests; TMT = Trail Making Tests
Fig. 4
Fig. 4
Influence of APOE status on peripheral immunity in AD patients. a Violin plots displaying the percentage of the annotated immune cell population out of the total CD45+ immune population using a GLM with age and sex as covariates in different APOE genotypes across the AD continuum. b Stacked bar graphs showing the percentage of T cell and CD4+ T cells subpopulations out of the total T cell and CD4+ T cell populations. c Volcano plots displaying differentially expressed genes (Punadjusted < 0.05) between different APOE genotypes in AD. Red and blue indicate respectively higher and lower expression. d Violin plots displaying the expression of the two genes that were differentially expressed in both APOE ε4ε4 and APOE ε3ε4 compared to the APOE ε3ε3 carriers. e Correlation matrix showing the association between immune cell populations with CSF biomarkers of AD neuropathology or cognition. A partial two-tailed Spearman correlation was performed and controlled for age and sex. f, g Correlation graph showing correlations of CD27+ B cells with CSF Aβ42 (f) and MMSE (g). a, d Violin plots showing median ± quartiles. f, g Graph shows linear regression ± 95% confidence intervals. n = 12 ε3ε3 AD, n = 12 ε3ε4 AD, n = 12 ε4ε4 AD. GLM = multivariate general linear model; AD = Alzheimer’s disease

References

    1. Castellano JM, Kim J, Stewart FR, Jiang H, DeMattos RB, Patterson BW, et al. Human apoE isoforms differentially regulate brain amyloid-beta peptide clearance. Sci Transl Med. 2011;3(89):89ra57. doi: 10.1126/scitranslmed.3002156. - DOI - PMC - PubMed
    1. Kanekiyo T, Xu H, Bu G. ApoE and Abeta in Alzheimer's disease: accidental encounters or partners? Neuron. 2014;81(4):740–754. doi: 10.1016/j.neuron.2014.01.045. - DOI - PMC - PubMed
    1. Liu CC, Zhao N, Fu Y, Wang N, Linares C, Tsai CW, Bu G. ApoE4 accelerates early seeding of amyloid pathology. Neuron. 2017;96(5):1024–32 e3. doi: 10.1016/j.neuron.2017.11.013. - DOI - PMC - PubMed
    1. Montagne A, Nation DA, Sagare AP, Barisano G, Sweeney MD, Chakhoyan A, et al. APOE4 leads to blood-brain barrier dysfunction predicting cognitive decline. Nature. 2020;581(7806):71–76. doi: 10.1038/s41586-020-2247-3. - DOI - PMC - PubMed
    1. Montagne A, Nikolakopoulou AM, Huuskonen MT, Sagare AP, Lawson EJ, Lazic D, et al. APOE4 accelerates advanced-stage vascular and neurodegenerative disorder in old Alzheimer’s mice via cyclophilin A independently of amyloid-β. Nature Aging. 2021;1(6):506–520. doi: 10.1038/s43587-021-00073-z. - DOI - PMC - PubMed

Publication types