. 2024 Apr 24;23(1):134.
doi: 10.1186/s12933-024-02215-0.

Association between triglyceride-glucose related indices with the all-cause and cause-specific mortality among the population with metabolic syndrome

Affiliations

Association between triglyceride-glucose related indices with the all-cause and cause-specific mortality among the population with metabolic syndrome

Xiaoyuan Wei et al. Cardiovasc Diabetol. .

Abstract

Background: Triglyceride-glucose (TyG) index has been determined to play a role in the onset of metabolic syndrome (MetS). Whether the TyG index and TyG with the combination of obesity indicators are associated with the clinical outcomes of the MetS population remains unknown.

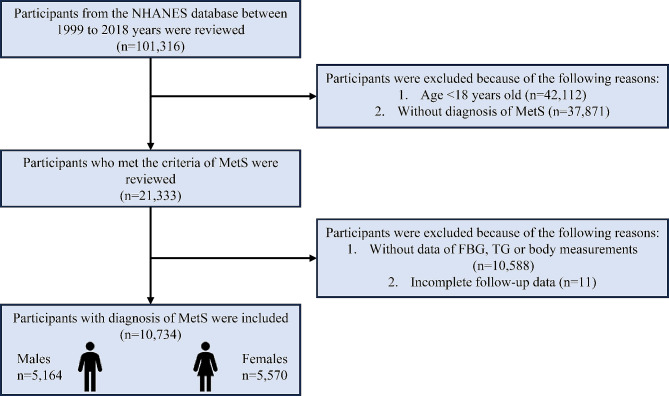
Method: Participants were extracted from multiple cycles of the National Health and Nutrition Examination Survey (NHANES) between 1999 and 2018 years. Three indicators were constructed including TyG index, TyG combining with waist circumference (TyG-WC), and TyG combining with waist-to-height ratio (TyG-WHtR). The MetS was defined according to the National Cholesterol Education Program (NCPE) Adult Treatment Panel III. Kaplan-Meier (KM) curves, restricted cubic splines (RCS), and the Cox proportional hazard model were used to evaluate the associations between TyG-related indices and mortality of the MetS population. The sensitive analyses were performed to check the robustness of the main findings.

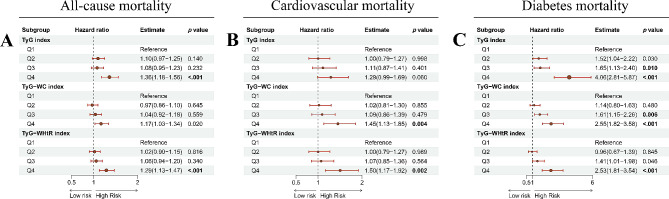
Results: There were 10,734 participants with MetS included in this study, with 5,570 females and 5,164 males. The median age of the study population was 59 years old. The multivariate Cox regression analyses showed high levels of TyG-related indices were significantly associated with the all-cause mortality of MetS population [TyG index: adjustedhazard ratio (aHR): 1.36, 95%confidence interval (CI): 1.18-1.56, p < 0.001; TyG-WHtR index: aHR = 1.29, 95%CI: 1.13-1.47, p < 0.001]. Meanwhile, the TyG-WC and TyG-WHtR index were associated with cardiovascular mortality of the MetS population (TyG-WC: aHR = 1.45, 95%CI: 1.13-1.85, p = 0.004; TyG-WHtR: aHR = 1.50 95%CI: 1.17-1.92, p = 0.002). Three TyG-related indices showed consistent significant correlations with diabetes mortality (TyG: aHR = 4.06, 95%CI: 2.81-5.87, p < 0.001; TyG-WC: aHR = 2.55, 95%CI: 1.82-3.58, p < 0.001; TyG-WHtR: aHR = 2.53 95%CI: 1.81-3.54, p < 0.001). The RCS curves showed a non-linear trend between TyG and TyG-WC indices with all-cause mortality (p for nonlinearity = 0.004 and 0.001, respectively). The sensitive analyses supported the positive correlations between TyG-related indices with mortality of the MetS population.

Conclusion: Our study highlights the clinical value of TyG-related indices in predicting the survival of the MetS population. TyG-related indices would be the surrogate biomarkers for the follow-up of the MetS population.

Keywords: All-cause mortality; Cardiovascular mortality; Diabetes mortality; Metabolic syndrome; TyG index; TyG-WC index; TyG-WHtR index.


Conflict of interest statement

The authors declare no competing interests.

Figures

Fig. 1
Fig. 1
The participants’ selection process in the present study. A total of 101,316 participants from ten cycles of interviews between 1999 and 2018 years were reviewed and 10,734 participants with MetS were ultimately included. NHANES: National Health and Nutrition Examination Survey; MetS: metabolic syndrome; FBG: fasting blood glucose; TG: triglyceride
Fig. 2
Fig. 2
Kaplan-Meier curves show the overall and cause-specific survival probabilities of the MetS population with different quartile levels of TyG, TyG-WC, and TyG-WHtR indices. (A) overall survival with different quartiles of the TyG index; (B) cardiovascular-specific survival with different quartiles of the TyG index; (C) diabetes-specific survival with different quartiles of the TyG index; (D) overall survival with different quartiles of the TyG-WC index; (E) cardiovascular-specific survival with different quartiles of TyG-WC index; (F) diabetes-specific survival with different quartiles of TyG-WC index; (G) overall survival with different quartiles of TyG-WHtR index; (H) cardiovascular-specific survival with different quartiles of TyG-WHtR index; (I) diabetes-specific survival with different quartiles of TyG-WHtR index. MetS: metabolic syndrome; TyG: triglyceride-glucose; WC: waist circumference; WHtR: waist-to-height ratio
Fig. 3
Fig. 3
The forest plots show the associations between TyG, TyG-WC, and TyG-WHtR indices with all-cause and cause-specific mortality of the MetS population. B(A) the association between TyG, TyG-WC, and TyG-WHtR indices with all-cause mortality; (B) the association between TyG, TyG-WC, and TyG-WHtR indices with cardiovascular mortality; (C) the association between TyG, TyG-WC, and TyG-WHtR indices with diabetes mortality. The results were adjusted for age, gender, race, marital status, educational level, family income-poverty ratio, smoking status, alcohol use, cancer, CKD, CVD, BMI (only for TyG index), energy intake, serum levels of TC, HDL-C, LDL-C, BUN, UA, eGFR, ALT, AST, ALB, and TBil. A P-value < 0.017 was considered significant, as we had to correct our analysis for multiple testing (P-value of 0.017 was calculated as: 0.05 divided by 3). TyG: triglyceride-glucose; WC: waist circumference; WHtR: waist-to-height ratio; TC: total cholesterol; CKD: chronic kidney disease; CVD: cardiovascular disease; eGFR: estimated glomerular filtration rate; BUN: blood urea nitrogen; HDL-C: high-density lipoprotein cholesterol; LDL-C: low-density lipoprotein cholesterol; UA: uric acid; ALT: glutamic-pyruvic transaminase; AST: aspartate transaminase; ALB: albumin; TBil: total bilirubin; BMI: body mass index
Fig. 4
Fig. 4
Restricted cubic spline of the linear trends between TyG, TyG-WC, and TyG-WHtR indices with all-cause and cause-specific mortality of MetS population. (A) all-cause mortality risk with different levels of the TyG index; (B) cardiovascular mortality risk with different levels of the TyG index; (C) diabetes mortality risk with different levels of the TyG index; (D) all-cause mortality risk with different levels of TyG-WC index; (E) cardiovascular mortality risk with the different level of TyG-WC index; (F) diabetes mortality risk with the different level of TyG-WC index; (G) all-cause mortality with the different level of TyG-WHtR index; (H) cardiovascular mortality risk with the different level of TyG-WHtR index; (I) diabetes mortality risk with the different level of TyG-WHtR index. The dotted lines represent 95% confidence intervals. Spline analyses were adjusted for age, gender, race, marital status, educational level, family income-poverty ratio, smoking status, alcohol use, cancer, CKD, CVD, BMI (only for TyG index), energy intake, serum levels of TC, HDL-C, LDL-C, BUN, UA, eGFR, ALT, AST, ALB, and TBil. TyG: triglyceride-glucose; WC: waist circumference; WHtR: waist-to-height ratio; TC: total cholesterol; CKD: chronic kidney disease; CVD: cardiovascular disease; eGFR: estimated glomerular filtration rate; BUN: blood urea nitrogen; HDL-C: high-density lipoprotein cholesterol; LDL-C: low-density lipoprotein cholesterol; UA: uric acid; ALT: glutamic-pyruvic transaminase; AST: aspartate transaminase; ALB: albumin; TBil: total bilirubin; BMI: body mass index

References

    1. Samson SL, Garber AJ. Metabolic syndrome. Endocrinol Metab Clin North Am. 2014;43(1):1–23. doi: 10.1016/j.ecl.2013.09.009. - DOI - PubMed
    1. Eckel RH, Grundy SM, Zimmet PZ. The metabolic syndrome. Lancet. 2005;365(9468):1415–28. doi: 10.1016/S0140-6736(05)66378-7. - DOI - PubMed
    1. Saklayen MG. The global epidemic of the metabolic syndrome. Curr Hypertens Rep. 2018;20(2):12. doi: 10.1007/s11906-018-0812-z. - DOI - PMC - PubMed
    1. Beltrán-Sánchez H, Harhay MO, Harhay MM, McElligott S. Prevalence and trends of metabolic syndrome in the adult U.S. population, 1999–2010. J Am Coll Cardiol. 2013;62(8):697–703. doi: 10.1016/j.jacc.2013.05.064. - DOI - PMC - PubMed
    1. Shin D, Kongpakpaisarn K, Bohra C. Trends in the prevalence of metabolic syndrome and its components in the United States 2007–2014. Int J Cardiol. 2018;259:216–9. doi: 10.1016/j.ijcard.2018.01.139. - DOI - PubMed

Publication types

MeSH terms