Physalin H, physalin B, and isophysalin B suppress the quorum-sensing function of Staphylococcus aureus by binding to AgrA
- PMID: 38659576
- PMCID: PMC11039898
- DOI: 10.3389/fphar.2024.1365815
Physalin H, physalin B, and isophysalin B suppress the quorum-sensing function of Staphylococcus aureus by binding to AgrA
Abstract
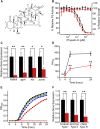
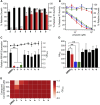
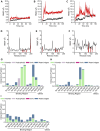
The virulence of Staphylococcus aureus, including methicillin-resistant S. aureus (MRSA), depends on the expression of toxins and virulence factors controlled by the quorum-sensing (QS) system, encoded on the virulence accessory gene regulator (agr) locus. The aim of this study was to identify a phytochemical that inhibits Agr-QS function and to elucidate its mechanism. We screened 577 compounds and identified physalin H, physalin B, and isophysalin B--phytochemicals belonging to physalins found in plants of the Solanaceae family--as novel Agr-QS modulators. Biological analyses and in vitro protein-DNA binding assays suggested that these physalins suppress gene expression related to the Agr-QS system by inhibiting binding of the key response regulator AgrA to the agr promoters, reducing the function of hemolytic toxins downstream of these genes in MRSA. Furthermore, although physalin F suppressed gene expression in the Agr-QS system, its anti-hemolytic activity was lower than that of physalins H, B, and isophysalin B. Conversely, five physalins isolated from the same plant with the ability to suppress Agr-QS did not reduce bacterial Agr-QS activity but inhibited AgrA binding to DNA in vitro. A docking simulation revealed that physalin interacts with the DNA-binding site of AgrA in three docking states. The carbonyl oxygens at C-1 and C-18 of physalins, which can suppress Agr-QS, were directed to residues N201 and R198 of AgrA, respectively, whereas these carbonyl oxygens of physalins, without Agr-QS suppression activity, were oriented in different directions. Next, 100-ns molecular dynamics simulations revealed that the hydrogen bond formed between the carbonyl oxygen at C-15 of physalins and L186 of AgrA functions as an anchor, sustaining the interaction between the carbonyl oxygen at C-1 of physalins and N201 of AgrA. Thus, these results suggest that physalin H, physalin B, and isophysalin B inhibit the interaction of AgrA with the agr promoters by binding to the DNA-binding site of AgrA, suppressing the Agr-QS function of S. aureus. Physalins that suppress the Agr-QS function are proposed as potential lead compounds in the anti-virulence strategy for MRSA infections.
Keywords: Agr-QS modulator; AgrA-DNA inhibition; MRSA; anti-hemolytic activity; molecular docking; molecular dynamics simulation; physalins.
Copyright © 2024 Yamaguchi, Manome, Hara, Yamazaki, Nakamura, Ishibashi and Takaya.
Conflict of interest statement
The authors declare that the research was conducted in the absence of any commercial or financial relationships that could be construed as a potential conflict of interest.
Figures


Similar articles
-
Antisense locked nucleic acids targeting agrA inhibit quorum sensing and pathogenesis of community-associated methicillin-resistant Staphylococcus aureus.J Appl Microbiol. 2017 Jan;122(1):257-267. doi: 10.1111/jam.13321. Epub 2016 Nov 21. J Appl Microbiol. 2017. PMID: 27718524
-
A Novel Aza-Derivative Inhibits agr Quorum Sensing Signaling and Synergizes Methicillin-Resistant Staphylococcus aureus to Clindamycin.Front Microbiol. 2021 Feb 9;12:610859. doi: 10.3389/fmicb.2021.610859. eCollection 2021. Front Microbiol. 2021. PMID: 33633702 Free PMC article.
-
Eliminating extracellular autoinducing peptide signals inhibits the Staphylococcus aureus quorum sensing agr system.Biochem Biophys Res Commun. 2024 Jun 4;711:149912. doi: 10.1016/j.bbrc.2024.149912. Epub 2024 Apr 7. Biochem Biophys Res Commun. 2024. PMID: 38615572
-
Quorum-sensing, intra- and inter-species competition in the staphylococci.Microbiology (Reading). 2023 Aug;169(8):001381. doi: 10.1099/mic.0.001381. Microbiology (Reading). 2023. PMID: 37578829 Free PMC article. Review.
-
Critical Assessment of the Prospects of Quorum-Quenching Therapy for Staphylococcus aureus Infection.Int J Mol Sci. 2023 Feb 16;24(4):4025. doi: 10.3390/ijms24044025. Int J Mol Sci. 2023. PMID: 36835436 Free PMC article. Review.
Cited by
-
Structural characteristics, functions, and counteracting strategies of biofilms in Staphylococcus aureus.Comput Struct Biotechnol J. 2025 Jan 23;27:488-500. doi: 10.1016/j.csbj.2025.01.021. eCollection 2025. Comput Struct Biotechnol J. 2025. PMID: 39916696 Free PMC article. Review.
-
Disarming Staphylococcus aureus: Review of Strategies Combating This Resilient Pathogen by Targeting Its Virulence.Pathogens. 2025 Apr 15;14(4):386. doi: 10.3390/pathogens14040386. Pathogens. 2025. PMID: 40333163 Free PMC article. Review.
References
LinkOut - more resources
Full Text Sources
Research Materials
Miscellaneous

