. 2024;8(4):504-519.
doi: 10.1038/s41550-024-02197-9. Epub 2024 Feb 9.

Newly formed dust within the circumstellar environment of SN Ia-CSM 2018evt

Affiliations

Newly formed dust within the circumstellar environment of SN Ia-CSM 2018evt

Lingzhi 灵芝 Wang王 et al. Nat Astron. 2024.

Abstract

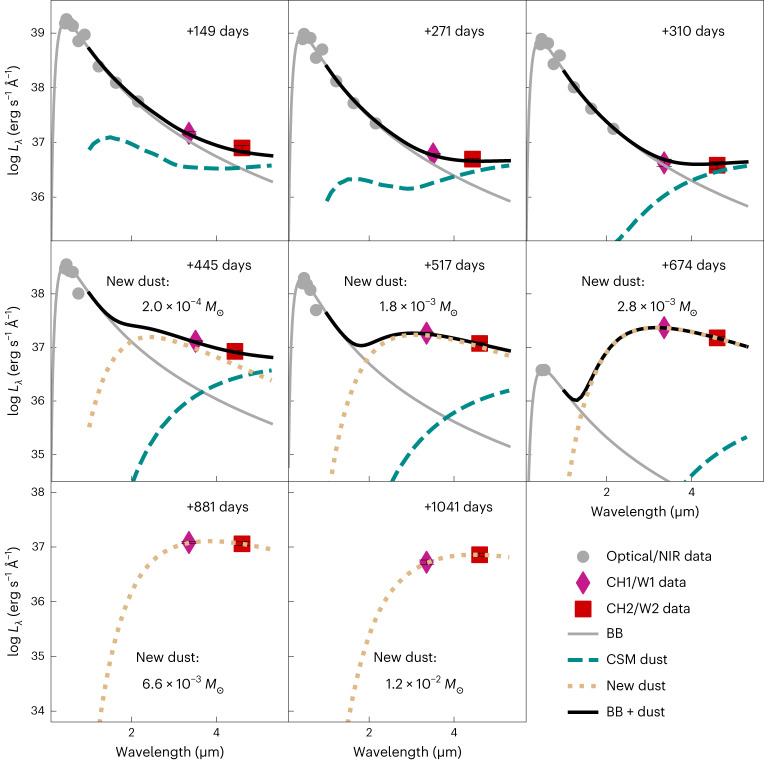
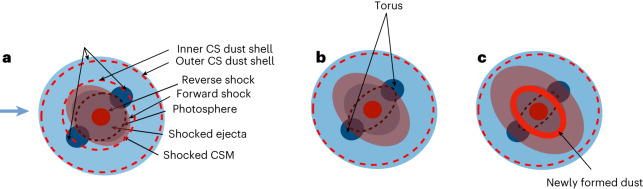
Dust associated with various stellar sources in galaxies at all cosmic epochs remains a controversial topic, particularly whether supernovae play an important role in dust production. We report evidence of dust formation in the cold, dense shell behind the ejecta-circumstellar medium (CSM) interaction in the Type Ia-CSM supernova (SN) 2018evt three years after the explosion, characterized by a rise in mid-infrared emission accompanied by an accelerated decline in the optical radiation of the SN. Such a dust-formation picture is also corroborated by the concurrent evolution of the profiles of the Hα emission line. Our model suggests enhanced CSM dust concentration at increasing distances from the SN as compared to what can be expected from the density profile of the mass loss from a steady stellar wind. By the time of the last mid-infrared observations at day +1,041, a total amount of 1.2 ± 0.2 × 10⁻² M of new dust has been formed by SN 2018evt, making SN 2018evt one of the most prolific dust factories among supernovae with evidence of dust formation. The unprecedented witness of the intense production procedure of dust may shed light on the perceptions of dust formation in cosmic history.

Keywords: Astrophysical dust; Time-domain astronomy.


Conflict of interest statement

Competing interestsThe authors declare no competing interests.

Figures

Fig. 1
Fig. 1. Evidence of the presence of dust in SN 2018evt.
a, MIR and B-band light curves (black dots) of SN 2018evt. All phases are given relative to the estimated B-band maximum at MJD 58352. The Spitzer and NEOWISE observations are shown by purple diamonds and red squares as labelled. The purple and red curves fit the MIR band 1 and band 2 photometry before and after day +310, separately. The black line fits the linearly fading B-band photometry before day ~400, with a decline rate of 0.624 ± 0.006 mag 100 day−1. b, Red-to-blue EW ratios of Hα (green circles), Paβ (red stars) and Brγ (blue triangles) lines. c, Evolution of the flux-weighted centroid velocities ΔV of Hα, Paβ and Brγ lines labelled with the same symbols as b. The ΔV of Hα measured before and after day +310 are fitted with separate linear functions as displayed by the two green line segments. d, Evolution of the EW of the Ca ii IR triplet (Extended Data Table 2) and Hα lines. For the purpose of the presentation, the EW of Hα has been multiplied by a factor of 2. The error bars shown represent 1σ uncertainties of magnitudes, EW ratio, centroid velocity and EW. Source data
Fig. 2
Fig. 2. SED fitting of SN 2018evt at the rest-frame wavelength.
The optical-to-NIR BVgriJHKs data are fitted by a single BB before day +674. Emissions from the CSM dust calculated from our double-shell model (see ‘BB fit and dust sublimation’ and Fig. 4 for more details) are illustrated by cyan-dashed lines. Emissions from the newly formed dust are shown as yellow-dotted lines. Note that the thermal emission of the newly formed dust becomes progressively more dominant over time after day +445. The error bars shown represent 1σ uncertainties of the monochromatic luminosities.
Fig. 3
Fig. 3. Time evolution of the different radii.
The BB photospheric radius RBBOpt and the BB dust radius RBBMIR are derived by fitting a BB spectrum to the optical-to-NIR luminosity and the MIR flux excesses, respectively. The latter is displayed in Fig. 4, and the associated temperature of the newly formed dust can be seen from the inset of Fig. 6. The horizontal grey-dashed line indicates the inner radius of the inner shell of the CSM (2.2 × 1016 cm) in the double-shell model. The inset presents the temporal evolution of the FWHM width of the broad Hα line. Two blue line segments present linear fits of the data before and after day +310, respectively. The shock radius Rs was derived by equation (1) in ‘BB fit and dust sublimation’ by assuming that the shock velocity was 10,000 km s−1 before the first observation at day ~+120 and approximated by the FWHM width of the broad Hα afterward. The error bars shown represent 1σ uncertainties of FWHM.
Fig. 4
Fig. 4. Modelling to the MIR flux excesses of SN 2018evt.
The single-shell CSM dust model (solid green line) with an inner radius of 2.6 × 1017 cm can fit well the declining flux excess in the MIR at day ≲+310 and infer a flatter power-law index of the dust density s = 1.15. In the case of the steady-wind mass loss s = 2.0 for the double-shell model (solid black line), dust grains within the inner shell at 2.2 × 1016 cm were continuously destroyed by the expanding forward shock between days ~+200 and +310, causing a monotonically decreased flux excess in the MIR (dashed grey line). The presence of an outer CSM dust shell with an inner radius of 6.0 × 1017 cm is necessary to account for the time evolution of the flux excess before day +310 (dotted grey line). The prominent rise of the MIR flux excess of SN 2018evt after day +310, which cannot be explained by the thermal emission of any pre-existing dust content, demands a substantial amount of new dust to form promptly in the postshock regions (dotted red line). Panels (a) and (b) present the flux excesses of SN 2018evt at ~3.5 μm (Spitzer CH1 and NEOWISE W1) and ~4.6 μm (Spitzer CH2 and NEOWISE W2), respectively. The error bars shown represent 1σ uncertainties of monochromatic luminosity excesses.
Fig. 5
Fig. 5. Schematic sketches of SN 2018evt at different phases.
The blue arrow marks the viewing direction. The inner and outer CSM dust shells of our double-shell model are shown as dashed red circles. The double-shell CSM model to describe the SED evolution of SN 2018evt at day ≲+310 suggests inner radii of 2.2 × 1016 cm and 6.0 × 1017 cm for the inner and the outer shells, respectively. The single-shell CSM dust model infers an inner radius of 2.6 × 1017 cm. The sketches represent the single-shell model after deleting the inner CS dust shell in a. The brown-dashed ellipses approximate the location of the receding photosphere as the SN ejecta expands over time. a, Unshocked CSM shell and disk-like torus with pre-existing dust being destroyed by SN radiation and CSM shock. Geometric configuration before day +310 when the redshifted component of the Hα line (shown as solid blue ellipses) is blocked by the photosphere, producing blueshifted line profiles. b, As the SN ejecta expands and the photosphere recedes over time, more redshifted emission is revealed, resulting in a redward evolution of the line centroid as seen in Fig. 1c. c, When new dust forms at the postshock CDS (thick solid line), the redshifted side of Hα is blocked again, leading to blueward evolution of the line profile.
Fig. 6
Fig. 6. Temporal evolution of the mass of the newly formed dust.
As shown by the black line, the mass of the newly formed dust of SN 2018evt can be well fitted by a power law: Md ∝ t4 for 0.3 μm graphite grains. The dust masses calculated for graphite and silicate particles of radius 0.05 μm are also presented. The inset traces the temperature evolution of newly formed graphite dust particles of radius 0.3 μm. The dust masses estimated for Type IIP supernovae 2004et and 1987A and IIn supernovae 2005ip, 2006jd and 2010jl are also shown. The error bars shown represent 1σ uncertainties of masses and temperatures.
Extended Data Fig. 1
Extended Data Fig. 1. The early-time comparisons of SNe 2018evt, and 1991T.
The spectrum of SN 2018evt (black curve) closely resembles the spectrum of SN 1991T at day -9 (red curve) in panel (a),, which exhibits the strong Fe III λ 4404, λ 5129 absorptions and Hα emission, visible Si III λ 4564 absorption, Ni III blends around 4750Å, 5350Å, and weak S II W and Si II λ 6355 as marked (for example,). Panel (b) compares the early-time photometry of SN 2018evt (stars), and SN 1991T (solid circles). A power law f ∝ τ+trn is applied to fit the early V - and c − b and photometry, where τ = (t-tBmax)/(s(1+z)),tBmax= 58352, s = 1.0 for stretch value and z = 0.02523 for the redshift of SN 2018evt. The fitting yields a rise time tr = 18.76 ± 0.24 days, and a power-law index n = 1.57 ± 0.07 (grey curve). The estimated tr is consistent with the V -b and rise time tr(V) = 20.00 ± 0.68 days of SN 1991T/1999aa-like events. The interpolations of BVRI light curves of SN 1991T are shown in dashed curves. The inset in panel (b) compares the B -V color curves between SNe 2018evt and 1991T, indicating a color difference < ~ 0.1 mag at similar phases. The corresponding Milkyway extinction is 0.05 mag for SN 2018evt. The error bars shown represent 1 − σ uncertainties of magnitudes, and colors.
Extended Data Fig. 2
Extended Data Fig. 2. Optical spectra of SN 2018evt.
Panel (a) shows optical spectra of SN 2018evt spanning from days +136 to +579 relative to B-band maximum. Phases and facilities are marked on the right. Spectra of SN 2018evt obtained at days +136, +272, and +351 are also compared to that of other Type Ia-CSM SNe (PTF11kx, and SN 2002ic) at similar phases. Panel (b) portrays the Hα profile of SN 2018evt from panel (a). For each epoch, the red dashed line mirrors the spectral profile of the blue side across the peak flux of the intermediate Hα (for example, see Extended Data Fig. 6 for two Gaussian fits to Hα). Its deviation from the red emission wing illustrates the time-variant asymmetry of the Hα profile.
Extended Data Fig. 3
Extended Data Fig. 3. NIR spectra of SN 2018evt.
Phases and facilities are marked on the right spanning from ~ +125 to +516 days relative to the B-band maximum. Several most prominent lines are labeled. The near-IR spectrum of SN 2012ca obtained at days +198 - +208 is shown for comparison.
Extended Data Fig. 4
Extended Data Fig. 4. The optical and MIR light curves of SN 2018evt.
Panel (a) The BV gri band light curves of SN 2018evt. Panels (b) and (c) present the ~ 3.5 μm (Spitzer CH1 and NEOWISE W 1) and ~ 4.6 μm (Spitzer CH2 and NEOWISE W 2) photometry of SN 2018evt, respectively. Black-solid lines show polynomial fits to the light curves before and after day +310. The MIR light curves of several other SNe Ia-CSM at similar phases are shown for comparison, including SNe 2002ic, 2005gj, PTF11kx, 2012ca, 2013dn,, and 2020eyj. The error bars shown represent 1 - σ uncertainties of magnitudes. Source data
Extended Data Fig. 5
Extended Data Fig. 5. The images of SN 2018evt observed with Spitzer and NEOWISE.
The first and the second rows display the Spitzer CH1 (3.6 μm) and CH2 (4.5 μm)-band images obtained from 2019-05-19 (day +271) to 2019-11-09 (day +445), respectively. The third and the fourth rows present the NEOWISE W 1 (3.4 μm) and W 2 (4.6 μm) observations of the SN 2018evt field, respectively. The left column shows the reference images constructed by coadding the pre-SN exposures between January 2017 and January 2018. The reference-subtracted images obtained from 2019-01-18 (day +149) to 2021-06-28 (day +1041) are shown in the remaining subpanels as labeled. Panels (a) and (b) display the Spitzer and NEOWISE images, respectively. In each subpanel, the magenta cross indicates the location of SN 2018evt. North is up, east is to the left.
Extended Data Fig. 6
Extended Data Fig. 6. The Hα profile of SN 2018evt observed with WiFeS at day +307 fitted with two Gaussian functions.
The FWHM widths of the broad (cyan-dashed line) and intermediate (blue-dotted line) components yield 5877 ± 32 km s−1 and 1643 ± 12 km s−1, respectively. The red-solid curve gives the combination of these two components. The bottom gray line represents the Hα profile after subtracting the broad and intermediate components. An arbitrary offset has been applied to the residual spectrum for the purpose of presentation. The inset provides a zoom-in view of the P-Cygni profile as displayed in the residual spectrum. A double-Gaussian component fit to the residual spectrum near the Hα core is illustrated by the cyan curve. The location of the peak of the emission component suggests a redshift z =0.02561 ± 0.00019, the location of the minimum of the absorption component measures a wind velocity Vw = 91 ± 58 km s−1.
Extended Data Fig. 7
Extended Data Fig. 7. Galactic extinction-corrected B-V, g-r, and g-i color curves of SN 2018evt.
All colors were binned for 20 days to increase the signal-to-noise ratio. The colors predicted by the scattering of the newly-formed dust in the post-shock CDS are also presented by gray symbols as labeled. The calculation was carried out by assuming that the intrinsic colors of SN 2018evt are identical to the values at day ~ +310, as indicated by the horizontal black line segments. The results of the 0.05 μm graphite are shown by gray circles and linearly fitted by gray-dashed lines. The predicted colors of the 0.05 μm silicate dust are presented by gray squares and linearly fitted by gray-dotted lines. The error bars shown represent 1 - σ uncertainties of colors.

References

    1. Morgan HL, Edmunds MG. Dust formation in early galaxies. Mon. Not. R. Astron. Soc. 2003;343:427–442.
    1. Matsuura M, et al. The global gas and dust budget of the Large Magellanic Cloud: AGB stars and supernovae, and the impact on the ISM evolution. Mon. Not. R. Astron. Soc. 2009;396:918–934.
    1. Hoflich, P., Khokhlov, A. & Wheeler, C. in From Gas to Stars to Dust, Vol. 73 (eds Haas, M. R. et al.) Ch. 57 (Astronomical Society of the Pacific, 1995).
    1. Ferrara A, Peroux C. Late-time cosmic evolution of dust: solving the puzzle. Mon. Not. R. Astron. Soc. 2021;503:4537–4543.
    1. Rho J, et al. Freshly formed dust in the Cassiopeia A supernova remnant as revealed by the Spitzer space telescope. Astrophys. J. 2008;673:271–282.