[Preprint]. 2024 Apr 20:2024.04.19.590186.
doi: 10.1101/2024.04.19.590186.

Glycogen phase separation drives macromolecular rearrangement and asymmetric division in E. coli

Affiliations

Glycogen phase separation drives macromolecular rearrangement and asymmetric division in E. coli

Yashna Thappeta et al. bioRxiv. .

Abstract

Bacteria often experience nutrient limitation in nature and the laboratory. While exponential and stationary growth phases are well characterized in the model bacterium Escherichia coli, little is known about what transpires inside individual cells during the transition between these two phases. Through quantitative cell imaging, we found that the position of nucleoids and cell division sites becomes increasingly asymmetric during transition phase. These asymmetries were coupled with spatial reorganization of proteins, ribosomes, and RNAs to nucleoid-centric localizations. Results from live-cell imaging experiments, complemented with genetic and 13C whole-cell nuclear magnetic resonance spectroscopy studies, show that preferential accumulation of the storage polymer glycogen at the old cell pole leads to the observed rearrangements and asymmetric divisions. In vitro experiments suggest that these phenotypes are likely due to the propensity of glycogen to phase separate in crowded environments, as glycogen condensates exclude fluorescent proteins under physiological crowding conditions. Glycogen-associated differences in cell sizes between strains and future daughter cells suggest that glycogen phase separation allows cells to store large glucose reserves without counting them as cytoplasmic space.

Keywords: Asymmetric division; bacteria; glycogen; nutrient limitation; phase separation.


Conflict of interest statement

DISCLOSURE AND COMPETING INTERESTS STATEMENT The authors declare no competing interests.

Figures

Fig 1:
Fig 1:. Mean single-cell features change as the cell density of the culture increases.
Except for panel A for which the same culture was analyzed across the entire growth curve, samples of different cultures of CJW4677 were collected at 42 different ODs (n > 500 cells for each OD) for cell imaging. Shown are binned data for the indicated OD range, with the mean describing the averaged mean value for cell samples from three OD values and error bars indicating the standard deviation. Grey, red, and blue shades indicate exponential, transition, and stationary phases, respectively. A Growth curves of two independent cultures of strain CJW4677. OD measurements were manually collected by spectrophotometry over time. B Scatter plot of OD vs. mean cell area. C Same as panel B but for mean number of nucleoids per cell. D Scatter plot of OD vs. fraction of cells with one nucleoid. E Same as panel D but for the fraction of constricting cells in the population. F Scatter plot of OD vs. mean division asymmetry, which was calculated by dividing the absolute distance of the division position from the cell center by cell length and averaging across cells. This was done for cultures at ODs at which the fraction of dividing cells in the population was greater than 0.05. G Scatter plot of OD vs mean nucleoid asymmetry, which was determined by calculating the absolute distance between the nucleoid mid-point and cell center, normalized for cell length. Note that for cells with two nucleoids, their relative mid-points were averaged such that when the center of each nucleoid was positioned at the relative quarter cell positions, the mean mid-point was at the cell center.
Fig 2:
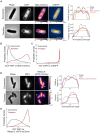
Fig 2:. The localization pattern of cytoplasmic components changes in transition phase.
A Representative phase contrast and fluorescence images of DAPI-labeled CJW7325 cells expressing RplA-mCherry and msfGFP, along with corresponding cell signal intensity profiles. Cultures were in exponential phase (OD 0.14) or transition phase (OD 1.83), as indicated. Fluorescence intensity is indicated in arbitrary units (a.u.). Scale bar: 2 μm B Distributions of signal correlation factor (SCF) values between DAPI and RplA-mCherry for exponential (n = 1242 cells) and transition (n = 1444 cells) phases. C The same as panel B but for DAPI and msfGFP. D Representative images of DAPI-stained CJW5685 cells expressing RNase E ΔMTS labeled with mCherry in exponential (OD 0.1) and transition phases (OD 1.30) along with signal intensity profiles for the indicated (*) cell. Scale bar: 2 μm E Distributions of SCF values between DAPI and RNase E ΔMTS-mCherry for exponential (n = 281 cells) and transition (n = 3174 cells) phases.
Fig 3:
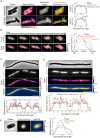
Fig 3:. Subcellular rearrangement of the cytoplasm is not driven by inner membrane collapse or nucleoid association.
A Images of MitoTracker Green-labeled cells (CJW7324) in exponential and transition phase. Fluorescence intensities are indicated in arbitrary units (a.u.). Signal intensity profiles are provided for the cells indicated by asterisks. White arrows indicate signal depletion at a pole. Scale bar: 2 μm B Timelapse sequence of a cell (CJW5159) expressing RplA-GFP and HupA-mCherry, with N and O indicating the new and old poles, respectively. Cells in late exponential phase (OD ~0.5) were washed in spent medium from a transition-phase culture (OD = 2.63) and spotted on an agarose pad containing the same spent medium. The RplA-GFP images were scaled to reflect the 5–95% range of signal intensity for each image. Next to the image series is the signal intensity profile for the cell indicated by an asterisk. Scale bar: 2 μm C Representative phase contrast and fluorescence images of cephalexin-treated and DAPI-labeled CJW7325 cells carrying RplA-mCherry and msfGFP in transition phase, with the corresponding signal intensity profiles. Fluorescence intensities are indicated in arbitrary units (a.u.). Scale bar: 5 μm D Same as C but showing a band of enriched msfGFP signal (purple arrowhead) in the region lacking DAPI staining (grey bracket). Scale bar: 5 μm E Phase contrast and fluorescence images of a CJW7326 cell carrying HupA-mCherry and msfGFP, with the corresponding signal intensity profile. Scale bar: 1 μm
Fig 4:
Fig 4:. Glycogen accumulation in transition phase drives cellular rearrangement.
A Representative relative whole cell 13C CPMAS spectral overlays of WT cell extracts (strain CJW2168) from cultures in exponential vs. transition phase (top), purified bovine and mussel glycogen (middle), and WT vs. ΔglgBXCAP (CJW7537) cell extracts from transition phase cultures (bottom). Dashed rectangle indicates sugar carbon region of spectrum. B Representative images of WT (CJW7606) and ΔglgBXCAP (CJW7607) cells in transition phase (OD 2.7) labeled with DAPI and expressing mScarlet and the glycogen sensor, along with the signal intensity profiles for indicated (*) cells. Fluorescence intensities are indicated in arbitrary units (a.u.). Scale bar: 2 μm C Distributions of SCF values of the glycogen sensor vs. DAPI or mScarlet for WT cells (n = 3591) in transition phase. D Density contour plot showing the area difference of glycogen sensor signal between the cell poles normalized by the cell area versus the nucleoid asymmetry (n = 5794 cells). The latter was calculated by determining the offset of the nucleoid mid-point from cell center normalized to cell length. The contour lines represent the 0.10, 0.2, 0.3, 0.4, 0.50, 0.6, 0.7, 0.8 and 0.9 probability envelopes of the data. Spearman correlation coefficient (ρ) is 0.748 (p-value = 0). E Example phase contrast and fluorescence images of DAPI-labeled CJW7606 cell carrying mScarlet and the glycogen sensor. The cell was from a culture in transition phase following cephalexin treatment. Grey bracket indicates DNA-free region where glycogen accumulation (orange arrowheads) sandwiches a band of RplA-mCherry enrichment (purple arrowhead). To the right is the corresponding signal intensity profile, where the grey shading indicates the DNA free-region with bands of glycogen biosensor and RplA-mCherry enrichment. Scale bar: 2 μm
Fig 5.
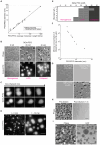
Fig 5.. Mimicking intracellular conditions of crowding and ionic strength induces phase transition of glycogen into liquid condensates that partially exclude GFP.
A Plot showing dynamic light scattering (DLS) measurements of the particle diameter size for PEG and PEO polymers of different molecular weights in IS buffer. Samples were measured in triplicate for 300 s at 25°C with a 90-degree detection angle. The line indicates the empirical relation (hydrodynamic diameter (σPEG/PEO) = 0.029*MWPEG/PEO(0.571±0.009)) determined by Devanand and Selser (1991). B Phase contrast and ConA-FITC fluorescence images of representative fields of view showing no LLPS (left), LLPS (center), and collapsed aggregates (right) obtained with the indicated concentrations of 3 kDa PEG. All samples were made using the IS buffer and contained 9 g/L of glycogen. Scale bar: 10 μm C Example montages of glycogen condensates labeled with ConA-FITC undergoing fusion events over time. Scale bar: 3 μm D Fluorescence images of ConA-FITC-labeled glycogen condensates imaged at t ~ 3 min and t ~ 30 min after the addition of 3 kDa PEG. Scale bar: 10 μm E Phase diagram of glycogen phases as a function of glycogen and 3 kDa PEG concentrations. F Plot showing the minimal concentration required to drive LLPS as a function of the average Stokes diameters for all tested PEG/PEO crowders. Phase separation was determined by assessing the formation of droplets using phase contrast imaging. The average diameter for each PEG/PEO crowder corresponds to the measurements shown in (A). G Phase contrast images of representative fields of view of glycogen (10 g/L) in IS buffer mixed with the indicated concentration and molecular weight of PEG or PEO (separately or combined). Scale bar: 10 μm H Phase contrast images of glycogen (10 g/L) and 3 kDa PEG (20 mM) mixtures in IS buffer before and after a two-fold dilution. For both conditions, imaging was performed within 1 min after mixing. Scale bar: 10 μm I Phase contrast and GFP images of a representative field of view of glycogen (10g/L) in IS buffer mixed with GFP (15 μM) and 3 kDa PEG (20 mM). Scale bar: 10 μm
Fig 6:
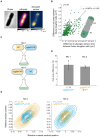
Fig 6:. Asymmetry in glycogen accumulation creates cell size differences and asymmetric cell divisions.
A Example images of an asymmetrically dividing cell (CJW7606) in transition phase. The cell expresses the glycogen sensor and mScarlet. Fluorescence intensities are indicated in arbitrary units (a.u.). Scale bar: 2 μm B Scatter plot of the difference in cell area and the difference in the area occupied by the glycogen sensor between future daughter cells. Constricting cells (n = 365) were divided into two future daughter cells based on the cell constriction position (illustrated in the inset). Spearman correlation coefficient (ρ) is 0.54 (p-value = 1.28×10⁻²⁷). C Schematic of co-cultured pairs of WT and ΔglgBXCAP cells constitutively expressing mSCFP3 or mVenus. D Plot showing the percentage difference in area between co-cultured WT and ΔglgBXCAP cells carrying either mVenus (yellow) or mSCFP3 (cyan). The names of the co-cultured strain pairs are Mix 1 (CJW7666/CJW7667) and Mix 2 (CJW7665/CJW7668). E Each marker (black diamond) corresponds to the average percent difference in cell area (100%*((WT-ΔglgBXCAP)glgBXCAP)) for each co-culture biological replicate. It corresponds to the mean of the distribution of the cell area difference statistics generated using bootstrapping for each biological replicate (n = 500 samplings). Error bars correspond to the standard deviations of the combined distributions of size differences across all biological replicates. F Density contour plots of the relative division position as a function of the nucleoid centroid position in dividing cells for transition-phase cells (n > 123) from co-cultured pairs shown in panel D. The values +0.5 and −0.5 represent cell poles while 0 corresponds to the cell center. Spearman correlation coefficient (ρ) for WT cells is 0.893 (p-value = 0) for mix 1 and 0.836 (p-value = 0) for mix 2.

Similar articles

References

    1. Åkerlund T, Nordström K, Nordström N & Bernander R (1995) Analysis of Cell Size and DNA Content in Exponentially Growing and Stationary-Phase Batch Cultures of Escherichia coli. J Bacteriol 177: 6791–6797 - PMC - PubMed
    1. Alatossava T, Jütte H, Kuhn A & Kellenberger E (1985) Manipulation of intracellular magnesium content in polymyxin B nonapeptide-sensitized Escherichia coli by ionophore A23187. J Bacteriol 162: 413–419 - PMC - PubMed
    1. Alberti S, Gladfelter A & Mittag T (2019) Considerations and Challenges in Studying Liquid-Liquid Phase Separation and Biomolecular Condensates. Cell 176: 419–434 doi:10.1016/j.cell.2018.12.035 [PREPRINT] - DOI - PMC - PubMed
    1. Alberti S & Hyman AA (2021) Biomolecular condensates at the nexus of cellular stress, protein aggregation disease and ageing. Nat Rev Mol Cell Biol 22: 196–213 - PubMed
    1. Alberti S, Saha S, Woodruff JB, Franzmann TM, Wang J & Hyman AA (2018) A User’s Guide for Phase Separation Assays with Purified Proteins. J Mol Biol 430: 4806–4820 - PMC - PubMed

Publication types