[Preprint]. 2024 Apr 15:2024.04.12.589315.
doi: 10.1101/2024.04.12.589315.

CD4-mediated immunity shapes neutrophil-driven tuberculous pathology

Affiliations

CD4-mediated immunity shapes neutrophil-driven tuberculous pathology

Benjamin H Gern et al. bioRxiv. .

Update in

Abstract

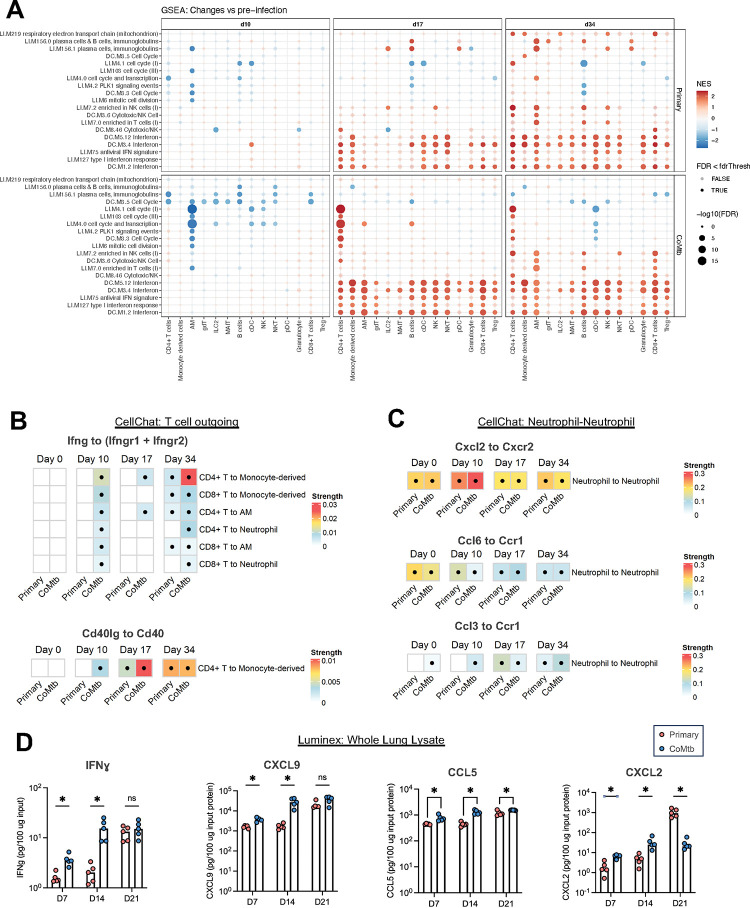
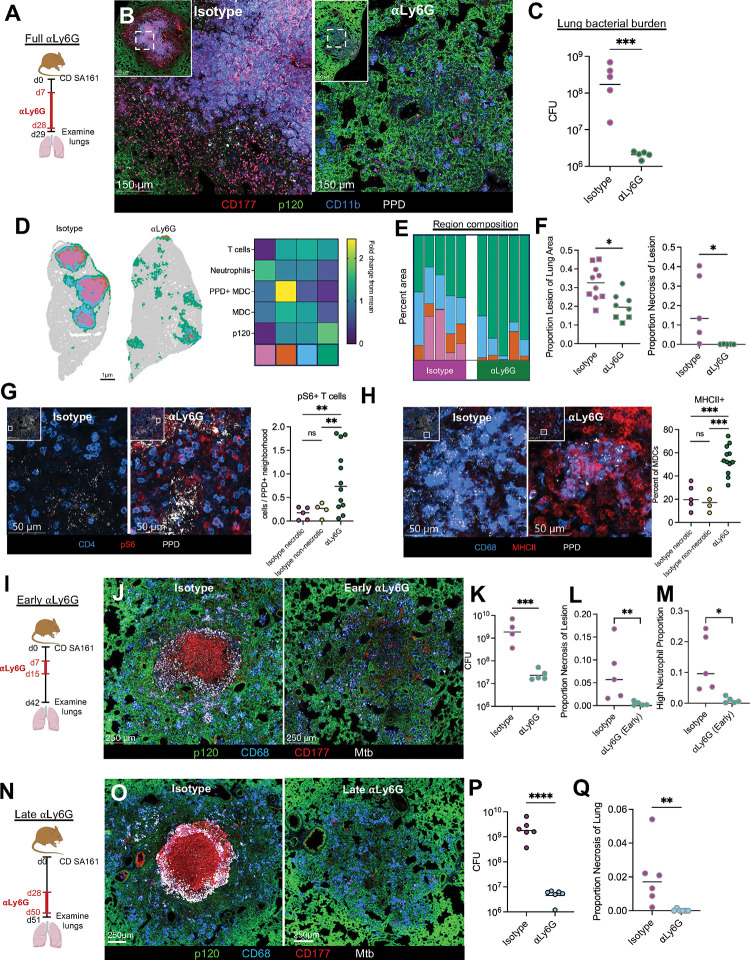
Pulmonary Mycobacterium tuberculosis (Mtb) infection results in highly heterogeneous lesions ranging from granulomas with central necrosis to those primarily comprised of alveolitis. While alveolitis has been associated with prior immunity in human post-mortem studies, the drivers of these distinct pathologic outcomes are poorly understood. Here, we show that these divergent lesion structures can be modeled in C3HeB/FeJ mice and are regulated by prior immunity. Using quantitative imaging, scRNAseq, and flow cytometry, we demonstrate that Mtb infection in the absence of prior immunity elicits dysregulated neutrophil recruitment and necrotic granulomas. In contrast, prior immunity induces rapid recruitment and activation of T cells, local macrophage activation, and diminished late neutrophil responses. Depletion studies at distinct infection stages demonstrated that neutrophils are required for early necrosis initiation and necrosis propagation at chronic stages, whereas early CD4 T cell responses prevent neutrophil feedforward circuits and necrosis. Together, these studies reveal fundamental determinants of tuberculosis lesion structure and pathogenesis, which have important implications for new strategies to prevent or treat tuberculosis.

Keywords: CD4 T cells; Mycobacterium tuberculosis; alveolitis; granuloma; neutrophils; quantitative imaging; tuberculosis.


Conflict of interest statement

Declaration of Interests The authors declare no competing interests.

Figures

Figure 1:
Figure 1:. Pre-existing immunity abrogates the formation of necrotic granulomas.
A-C: Day 98 post CD infection (n=5 per group). A) Representative histology images of lung sections. B) Principal component analysis of pathology scores. C) Mtb lung burden in Primary, BCG, and CoMtb Groups. D-L: Day 35 post ULD infection (n= 10 primary, 5 CoMtb). D) Representative confocal microscopy images demonstrating preserved alveolar integrity in non-necrotic Primary and CoMtb lesions. E) Representative confocal microscopy images depicting major cell populations within lesions. F) Percent of mice with necrotic lesions, covers two independent experiments. G) Heatmap showing cellular composition of clustered microenvironments. H) Representative map showing 50um2 neighborhoods, color-coded microenvironment. I) Percent area of lesion comprised by each microenvironment. Uninvolved regions (grey) not included. J) Percent of lesion comprised by necrotic region (pink). K) Ratio of lymphoid (blue, green) to myeloid (yellow, orange, pink) predominant regions. L) Relative density of PPD signal per 50 um2 neighborhood. Single-group comparisons by Mann-Whitney U test. *p < 0.05, **p < 0.01, ***p < 0.001, ****p < 0.0001. Error bars (F) reflect 95% confidence intervals. Points represent individual mice or lesions from individual mice. Data are representative of one (A-C) or two (D-L) independent experiments. See also Figure S1.
Figure 2:
Figure 2:. CoMtb alters the immune landscape following Mtb infection.
A-B: Day 35 post ULD infection, n = 8. A) PCoA analysis of ROI transcriptomes, color coded by lesion type (necrotic vs non-nercotic, 3 ROIs per point) or location (uninvolved, 1 ROI per point)). B) GSEA analysis showing pathways enriched in primary necrotic lesions vs primary non-necrotic lesions. C-E: Multiple timepoints post CD infection. C) UMAP depicting cell types identified by scRNAseq analysis of lung parenchymal cells, heatmap showing changes in cellular abundance across timepoints, numbers reflect the median number of cells of a given type per thousand cells. D) Change in proportions of selected cell populations over time, as determined by scRNAseq. E) Change in numbers of selected cell populations over time, as determined by flow cytometry. F) Change in proportions of early and late neutrophil clusters over time, as determined by scRNAseq. G) GSEA analysis showing pathways enriched in early and late neutrophil clusters. Points represent individual lesions (A, 3 ROIs samples per lesion, 1 per uninvolved area), and individual mice (D, E, F). False discovery rate-adjusted p values determined using the R fgsea package. Data are representative of one (A-D, F-G) or two (E) independent experiments. See also Figures S2 and S3.
Figure 3:
Figure 3:. CoMtb accelerates T cell and MDC activation, blunts neutrophil responses.
Multiple timepoints post CD infection. A) GSEA analysis showing pathways enriched following aerosol infection at days 10, 17, and 34 post infection, in the setting of primary infection and CoMtb. B) Predicted strength of selected T cell to myeloid cell signaling interactions quantified using CellChat. C) Predicted strength of significant neutrophil-neutrophil interactions in CellChat’s chemokine pathways. D) Levels of IFN, CXCL9, CCL5, and CXCL2, measured by Luminex. False discovery rate-adjusted p values determined using the R fgsea package. Dots in B and C indicate strength is significantly higher compared to a null distribution (i.e., CellChat-reported p value < 0.05). Single-group comparisons in D by t test. Data are representative of one (A-C) or two independent experiments (D) experiments. See also Figures S2 and S3.
Figure 4:
Figure 4:. CoMtb shapes early tuberculous lesion cellularity and organization.
Day 17 post CD infection, n = 5 per group. A) Representative confocal images showing lesions and zoom-ins highlighting T cells, MDCs, and neutrophils. B) Relative cellular density of these cell types within lesions as determined by histo-cytometry. C) Pearson correlation coefficients of the indicated cell populations within microenvironments. D) Confocal image and spots/neighborhood of p120 staining. Single-group comparisons in by unpaired t test. Correlations by Pearson’s correlation test. Points represent individual lesions. Data are representative of two independent experiments.
Figure 5:
Figure 5:. CD4 T cells are required for CoMtb-mediated protection from lesion necrosis.
A) Experimental outline. Subset of mice received CoMtb, then all mice aerosol infected with CD Mtb. Mice then received CD4 depleting antibody or isotype from d-1 until harvest. n = 3–5 per group. B) Representative confocal images showing presence of necrosis with CD4 administration. C) Pulmonary bacterial burdens. D) Representative map showing 50um2 neighborhoods, color-coded microenvironment and heatmap showing cellular composition of clustered microenvironments. E) Percent area of lesion comprised by each microenvironment. Uninvolved regions (grey) not included. F) Percent of lesion comprised by necrotic region (pink). Single-group comparisons by Mann-Whitney U test. Points represent individual mice. Data are representative of two independent experiments. See also Figure S4.
Figure 6:
Figure 6:. Neutrophils drive lesion necrosis.
A) Experimental outline for A-H. Mice received CD aerosol infection, then administered Ly6G depleting antibody or isotype from d7-d28, lungs taken d29. B) Representative confocal images showing abrogation of necrosis with Ly6G administration. C) Pulmonary bacterial burdens. D) Representative map showing 50um2 neighborhoods, color-coded microenvironment and heatmap showing cellular composition of clustered microenvironments. E) Percent area of lesion comprised by each microenvironment. Uninvolved regions (grey) not included. F) Percent lesion (any color) of total lung area, and percent of lesion comprised by necrotic region (pink). G) Representative confocal images and quantification showing increased pS6+ T cells following Ly6G administration. H) Representative confocal images and quantification showing increased MHCII+ in MDCs following Ly6G administration. I) Experimental outline for I-M. Mice received CD aerosol infection, then administered Ly6G depleting antibody or isotype from d7-d15, lungs taken d43. J) Representative confocal images showing abrogation of necrosis with “Early” Ly6G administration. K) Pulmonary bacterial burdens. L) Percent of lesion comprised by necrotic region (pink). M) Percent of lesion comprised by microenvironments with high neutrophil density. N) Experimental outline for N-Q. Mice received CD aerosol infection, then administered Ly6G depleting antibody or isotype from d28-d49, lungs taken d50. O) Representative confocal images showing decreased necrosis with “Late” Ly6G administration. P) Pulmonary bacterial burdens. Q) Percent of lung area comprised by necrotic region (pink). Single-group comparisons by unpaired t test (C, F left, K, P) or Mann-Whitney U test (F right, G, H, L, M, Q). Points represent individual mice. Data are each representative of three (A-H) or two (I-Q) independent experiments. See also Figure S5.

References

    1. Hunter R.L. (2016). Tuberculosis as a three-act play: A new paradigm for the pathogenesis of pulmonary tuberculosis. Tuberculosis 97, 8–17. 10.1016/j.tube.2015.11.010. - DOI - PMC - PubMed
    1. Pagán A.J., and Ramakrishnan L. (2015). Immunity and Immunopathology in the Tuberculous Granuloma. Cold Spring Harb. Perspect. Med. 5, a018499. 10.1101/cshperspect.a018499. - DOI - PMC - PubMed
    1. Rich A.R. (1944). The Pathogenesis of Tuberculosis (C. C. Thomas; ).
    1. Gautam U.S., Foreman T.W., Bucsan A.N., Veatch A.V., Alvarez X., Adekambi T., Golden N.A., Gentry K.M., Doyle-Meyers L.A., Russell-Lodrigue K.E., et al. (2017). In vivo inhibition of tryptophan catabolism reorganizes the tuberculoma and augments immune-mediated control of Mycobacterium tuberculosis. Proc. Natl. Acad. Sci., 201711373. 10.1073/pnas.1711373114. - DOI - PMC - PubMed
    1. Kauffman K.D., Sallin M.A., Sakai S., Kamenyeva O., Kabat J., Weiner D., Sutphin M., Schimel D., Via L., Barry C.E., et al. (2017). Defective positioning in granulomas but not lung-homing limits CD4 T-cell interactions with Mycobacterium tuberculosis-infected macrophages in rhesus macaques. Mucosal Immunol. 10.1038/mi.2017.60. - DOI - PMC - PubMed

Publication types