[Preprint]. 2024 Apr 26:2024.04.17.589812.
doi: 10.1101/2024.04.17.589812.

A Futile Cycle?: Tissue Homeostatic Trans-Membrane Water Co-Transport: Kinetics, Thermodynamics, Metabolic Consequences

Affiliations

A Futile Cycle?: Tissue Homeostatic Trans-Membrane Water Co-Transport: Kinetics, Thermodynamics, Metabolic Consequences

Charles S Springer Jr et al. bioRxiv. .

Abstract

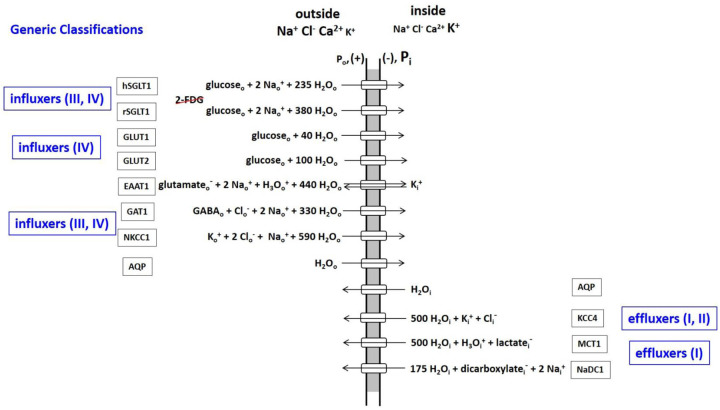
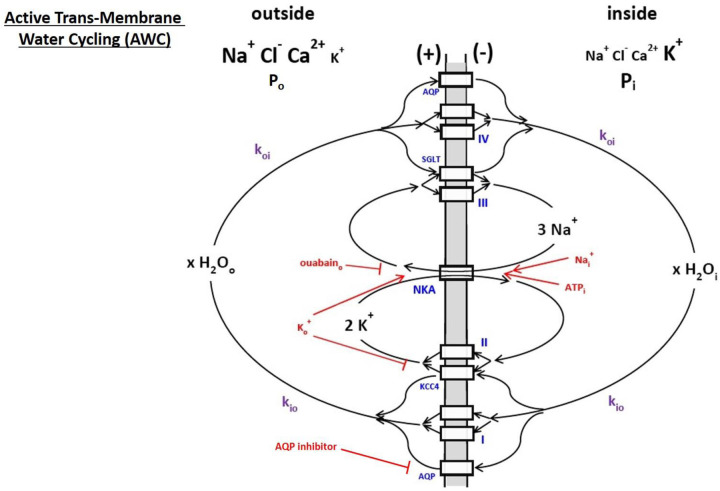
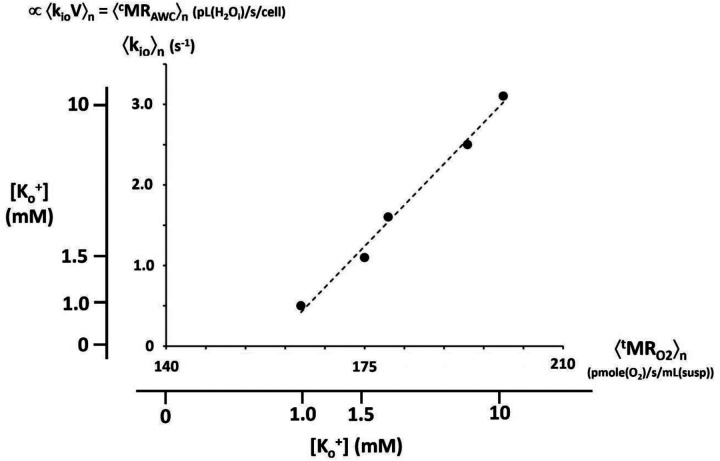
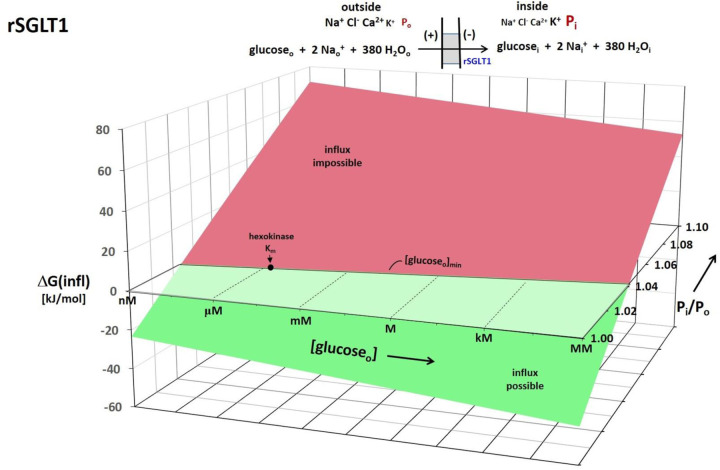
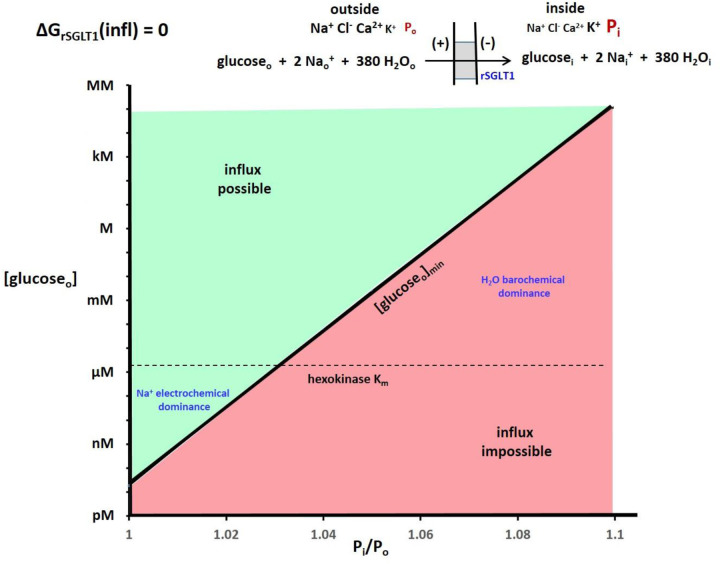
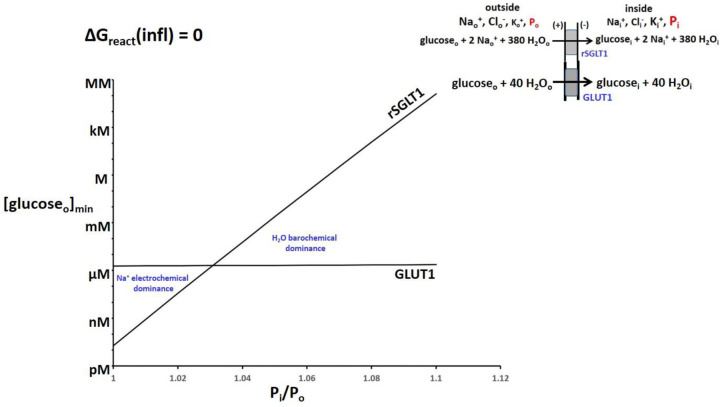
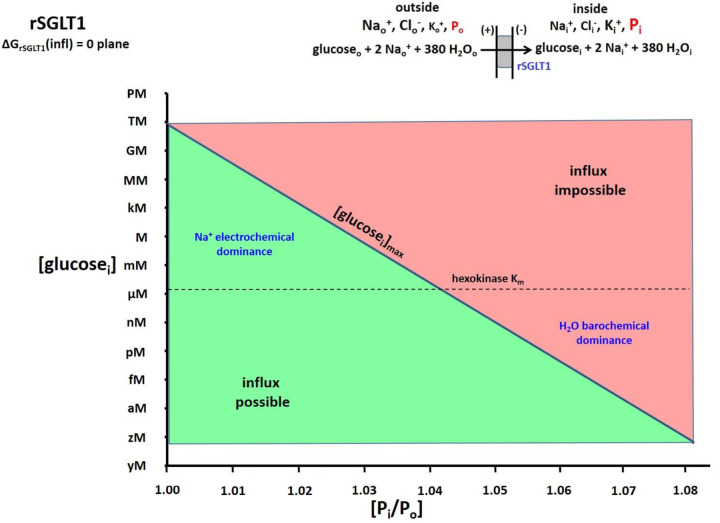
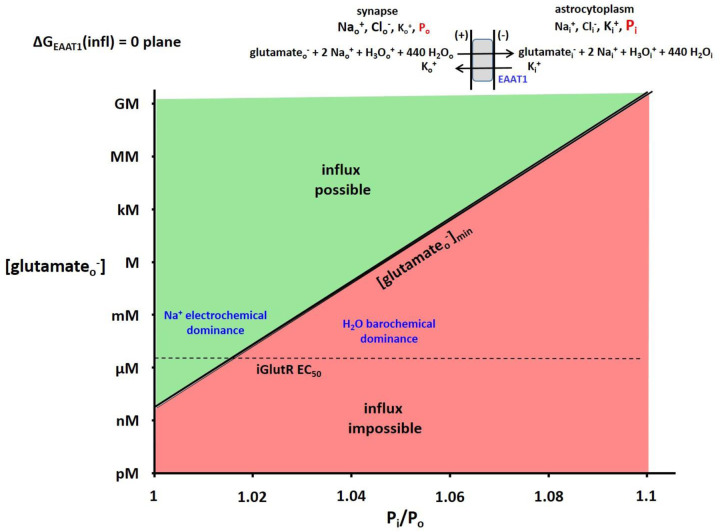
The phenomenon of active trans-membrane water cycling (AWC) has emerged in little over a decade. Here, we consider H2O transport across cell membranes from the origins of its study. Historically, trans-membrane water transport processes were classified into: A) compensating bidirectional fluxes ("exchange"), and B) unidirectional flux ("net flow") categories. Recent literature molecular structure determinations and molecular dynamic (MD) simulations indicate probably all the many different hydrophilic substrate membrane co-transporters have membrane-spanning hydrophilic pathways and co-transport water along with their substrates, and that they individually catalyze category A and/or B water flux processes, although usually not simultaneously. The AWC name signifies that, integrated over the all the cell's co-transporters, the rate of homeostatic, bidirectional trans-cytolemmal water exchange (category A) is synchronized with the metabolic rate of the crucial Na+,K+-ATPase (NKA) enzyme. A literature survey indicates the stoichiometric (category B) water/substrate ratios of individual co-transporters are often very large. The MD simulations also suggest how different co-transporter reactions can be kinetically coupled molecularly. Is this (Na+,K+-ATPase rate-synchronized) cycling futile, or is it consequential? Conservatively representative literature metabolomic and proteinomic results enable comprehensive free energy analyses of the many transport reactions with known water stoichiometries. Free energy calculations, using literature intracellular pressure (Pi) values reveals there is an outward trans-membrane H2O barochemical gradient of magnitude comparable to that of the well-known inward Na+ electrochemical gradient. For most co-influxers, these gradients are finely balanced to maintain intracellular metabolite concentration values near their consuming enzyme Michaelis constants. The thermodynamic analyses include glucose, glutamate-, gamma-aminobutyric acid (GABA), and lactate- transporters. 2%-4% Pi alterations can lead to disastrous concentration levels. For the neurotransmitters glutamate- and GABA, very small astrocytic Pi changes can allow/disallow synaptic transmission. Unlike the Na+ and K+ electrochemical steady-states, the H2O barochemical steady-state is in (or near) chemical equilibrium. The analyses show why the presence of aquaporins (AQPs) does not dissipate the trans-membrane pressure gradient. A feedback loop inherent in the opposing Na+ electrochemical and H2O barochemical gradients regulates AQP-catalyzed water flux as an integral AWC aspect. These results also require a re-consideration of the underlying nature of Pi. Active trans-membrane water cycling is not futile, but is inherent to the cell's "NKA system" - a new, fundamental aspect of biology.


Conflict of interest statement

CONFLICTS OF INTEREST: CSS and TMB are co-inventors on U.S. patent 11,728,038, “Activity MRI” (issued 15 August, 2023), which describes the MADI approach.

Figures

Figure 1.
Figure 1.. An Inventory of water transporting membrane proteins.
The water stoichiometric values are taken from (19), and should be thought of as means of shot-to-shot variations (see text).
Figure 2.
Figure 2.. A cartoon of active trans-membrane water cycling (AWC).
The rate constant for steady-state cellular water efflux is kio; that for steady-state cellular water influx is koi. The Na+,K+-ATPase enzyme is indicated as NKA, while AQP, KCC4, and SGLT are defined in Figure 1. The actions of NKA substrates intracellular Na+ and ATP (Nai+ and ATPi) and extracellular K+ (Ko+) are indicated in red, as are the NKA inhibitor extracellular ouabain (ouabaino) and an extracellular AQP inhibitor. Generic transporters I, II, III, and IV are exemplified in Figure 1: the actions of AQP, KCC4, and SGLT are shown here as specific examples. The quantity x is the AWC water stoichiometry integrated over the entire cell. Thus, for example, cMRH2O(influx) = cMRH2O(efflux) = xcMRNKA = x(cMRNa+(influx))/3 = x(cMRK+(efflux))/2, where cMR represents a cellular metabolic rate. First and second approximations of this cartoon have appeared in (15) and (2), respectively.
Figure 3.
Figure 3.. A correlation of kio with tMRO2.
Independent [Ko+] titrations of paramagnetic agent-superfused [SS-NMR] studies of organotypic, cultured [spiking] rat somatosensory cortex [ordinate] and direct studies of isolated rat brain synaptosome suspensions [abscissa] allow correlation of the population-averaged 〈kion and 〈tMRO2n quantities, respectively. The outer [Ko+] scales are non-linearly related to the linear, inner 〈kion and 〈tMRO2n scales due to their Michaelis-Menten relationships. The correlation of 〈kion and 〈tMRO2n is very strong. The SS-NMR studies also indicate the mean cell volume 〈V〉n is rather constant. Thus, 〈kioV〉n = 〈cMRAWCn (pL(H2Oi)/s/cell) correlates with 〈tMRO2n (pmole(O2)/s/mL(suspension)). (This is a combination of Figures 3C and 3E of reference (31), where details are provided. The points are synaptosome measurements: the dashed line is the Michaelis-Menten fitting (Km = 4.5 mM) of the cortical culture measurements.)
Figure 4.
Figure 4.. A 3D plot for the rSGLT1 reaction.
The vertical axis measures the Gibbs free energy change (ΔG) for the influx direction shown, and calculated with Eq. (6). The logarithmic oblique axes plot the extracellular glucose concentration, [glucoseo], and the intracellular/extracellular hydraulic pressure ratio (Pi/Po) over the experimentally measured range. For this calculation, the Table 1 concentrations and the Tables 2 and 3a free energy terms were used (chemogenic ΔGH2O(infl) = − 3 J/mole). The intracellular glucose concentration, [glucosei], the membrane potential, Em,oi, and Po were held fixed at 2 μM, − 91 mV, and 1 atm, respectively (T = 310 K). The surface is colored green when influx is thermodynamically possible and red when it is impossible. Thus, the intersection of the ΔG surface with the ΔG = 0 plane traces the trajectory of the (Pi/Po)-dependence of the minimum, [glucosei]min, value. The value of the intracellular hexokinase Km (1.7 μM) for glucosei is indicated.
Figure 5.
Figure 5.. The 2D plot of the Figure 4 ΔGrSGLT1(influx) = 0 plane.
The regions where the Na+ electrochemical gradient dominate and the H2O barochemical gradient dominate are indicated. The dependence is so strong that small percentage changes of Pi cause very large changes of the minimum [glucoseo] required for glucose uptake. The hexokinase Km for glucosei (1.7 μM) is indicated with a horizontal line.
Figure 6.
Figure 6.. The (Pi/Po)-dependences of [glucoseo]min for rSGLT1 (from Fig. 5) and for GLUT1.
Equation (4) was used, with the intracellular glucose concentration, [glucosei], the membrane potential, Em,oi, and Po held fixed at 2 μM, −91 mV, and 1 atm, respectively (T = 310 K). The regions of Na+ electrochemical and H2O barochemical dominance are very evident. Influx through the rSGLT1 transporter is much more sensitive to Pi/Po than that (barely noticeable) through the GLUT1 transporter. This is due to the much greater water stoichiometry of the former (Fig. 1).
Figure 7.
Figure 7.. The 2D plot of the ΔGrSGLT1(influx) = 0 plane from a 3D plot similar to Figure 4.
Equation (6) was used and, in this case, the extracellular glucose concentration, [glucoseo], the membrane potential, Em,oi, and Po were held fixed at 5 mM, −91 mV, and 1 atm, respectively (T = 310 K). The surface is colored green when influx is thermodynamically possible and red when it is impossible. Thus, the intersection of the ΔG surface with the ΔG = 0 plane traces the trajectory of the (Pi/Po)-dependence of the (in this case) maximum intracellular glucose concentration, [glucosei]max, value allowing uptake. The Km value of the cytoplasmic hexokinase for glucosei (1.7 μM) is indicated with a horizontal dashed line. It is clear when Pi is small, tremendous values of [glucosei] are allowed, which would easily saturate hexokinase. However, this is not the case when Pi is only a few percentage points greater.
Figure 8.
Figure 8.. The 2D plot of the ΔGEAAT1(influx) = 0 plane from the 3D plot analogous to Figure 4.
The (in this case) astrocytic glutamate concentration, [glutamatei], the membrane potential, Em,oi, and Po were fixed at 1.4 mM (the Km value for glutamine synthetase), −91 mV, and 1 atm, respectively (T = 310 K). The surface is colored green when influx is thermodynamically possible and red when it is impossible. Thus, the intersection of the ΔG surface with the ΔG = 0 plane traces the trajectory of the (Pi/Po)-dependence of the minimum synaptic glutamate concentration, [glutamateo]min, value required for astrocyte uptake. The EC50 value of the iGlutR receptor for synaptic glutamateo (2.3 μM) is indicated with a horizontal dashed line. It is clear glutamateo is well-cleared from the synapse when Pi is small, and not when Pi is only a few percentage points greater. In the latter case, the receptors would be saturated, and synaptic transmission would be interrupted.

References

    1. Springer C. S., Baker E. M., Li X., Moloney B., Wilson G. J., Pike M. M., Barbara T. M., Rooney W. D., Maki J. H., Metabolic activity diffusion imaging [MADI]: I. Metabolic, cytometric modeling and simulations. NMR Biomed. 36, e4781 (2023). - PubMed
    1. Springer C. S., Baker E. M., Li X., Moloney B., Wilson G. J., Anderson V. C., Sammi M. K., Pike M. M., Garzotto M. G., Kopp R. P., Coakley F. V., Rooney W. D., Maki J. H., Metabolic activity diffusion imaging [MADI]: II. Non-invasive, high-resolution human brain imaging of sodium pump flux and cell metrics. NMR Biomed. 36, e4782 (2023). - PubMed
    1. Neil J. J., Ackerman J. J. H., Metabolic activity diffusion imaging (MADI): A new paradigm. NMR in Biomed. 36, e4841 (2023). - PubMed
    1. Schlegel J., Baker E., Holland S., Stoller J., Packwood W., Li X., Barajas R., Springer C., Pike M., Metabolic activity diffusion imaging [MADI] of rat brain glioma. Proc. Int. Soc. Magn. Reson. Med. 31, 3924 (2023).
    1. Pike M. M., Li X., Baetscher E., Barbara T. M., Sammi M. K., Stevens A. A., Springer C. S., Does MADI detect temporal brain metabolic activity changes?” Proc. Int. Soc. Magn. Reson. Med. 31, 5177 (2023).

Publication types