[Preprint]. 2024 Apr 16:2024.04.13.589370.
doi: 10.1101/2024.04.13.589370.

Competition for resources can reshape the evolutionary properties of spatial structure

Affiliations

Competition for resources can reshape the evolutionary properties of spatial structure

Anush Devadhasan et al. bioRxiv. .

Update in

Abstract

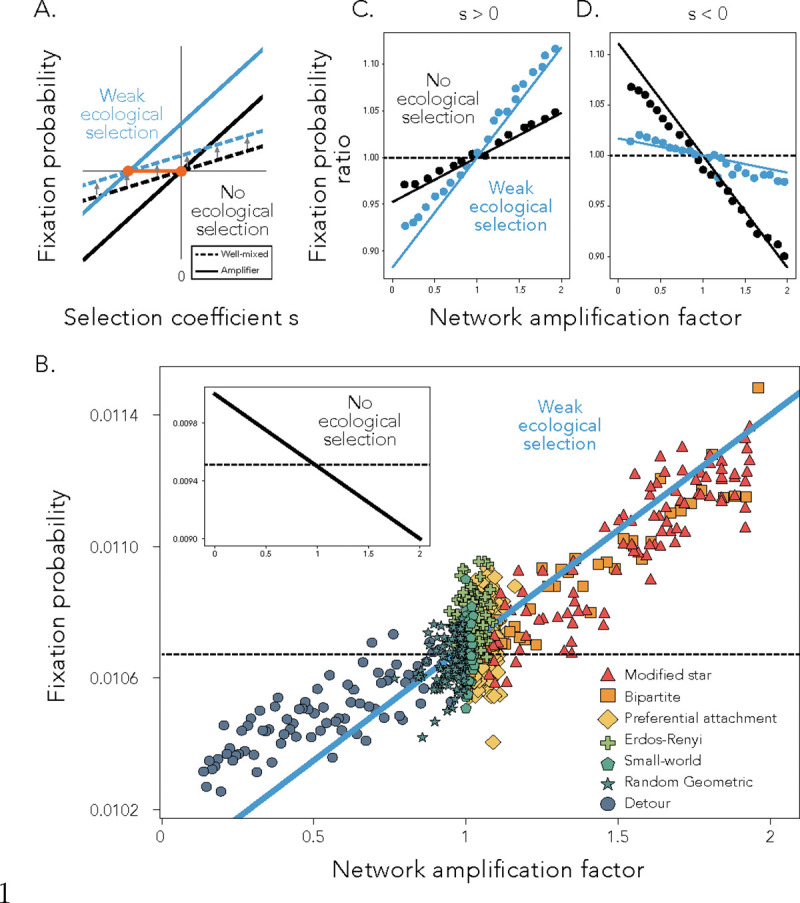
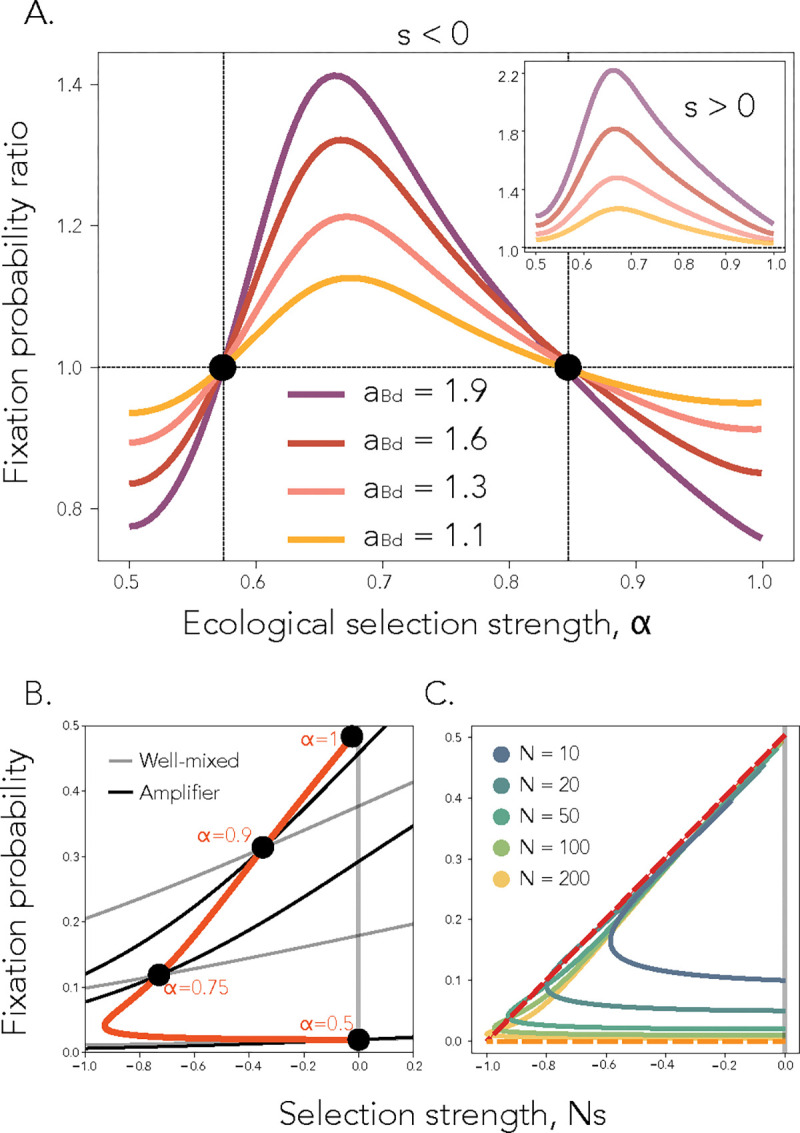
Many evolving ecosystems have spatial structures that can be conceptualized as networks, with nodes representing individuals or homogeneous subpopulations and links the patterns of interaction and replacement between them. Prior models of evolution on networks do not take ecological niche differences and eco-evolutionary interplay into account. Here, we combine a resource competition model with evolutionary graph theory to study how heterogeneous topological structure shapes evolutionary dynamics under global frequency-dependent ecological interactions. We find that the addition of ecological competition for resources can produce a reversal of roles between amplifier and suppressor networks for deleterious mutants entering the population. Moreover, we show that this effect is a non-linear function of ecological niche overlap and discuss intuition for the observed dynamics using simulations and analytical approximations.

Keywords: eco-evolutionary dynamics; evolutionary graph theory; generalist populations; graph-structured populations; population structure; probabilities of fixation; specialist populations; time to fixation.


Figures

Figure 1:
Figure 1:. The role of network topology in shaping mutant fixation probabilities for generalist populations.
Panel A shows an illustration of the effect of weak ecological selection on the probability of fixation. Fixation probability is shown on the y-axis and selection strength on the x-axis. One set of black dashed (well-mixed) and continuous (amplifier) lines show the fixation probability under no ecological selection, while the other set in blue showcases the regime with weak ecological selection. The orange points show the points of intersection for the two ecological regimes. Panel B Fixation probability on the y-axis as a function of network amplification factor on the x-axis, across network families. Each dot represents the fixation probability of a single network, calculated using 106 simulation runs. The dashed line represents equation (5) for a well-mixed population, while the solid blue line shows equation (6) for graph topologies. Here, s=0.001,N=100 and α=0.53 (blue solid line) and α=0.5 for the insert. In Panels C and D, dots show the ratio of fixation probabilities across network families and the well-mixed population baseline, as a function of network amplification factor, for a beneficial (s=0.001, Panel C) and deleterious (s=0.002, Panel D) mutant, estimated using 106 simulation runs. Lines show the analytic approximations using equations (5) and (6). Here, N=100 and α=0.525(blue lines).
Figure 2:
Figure 2:. The role of spatial structure in specialist populations.
Panel A shows toy representations of the mutant trajectory in the generalist (grey) and in the specialist (red/black) regimes. Panel B shows the theoretically exact establishment probabilities for well-mixed (solid lines, darker red) and an amplifier (solid lines, lighter red) population (equations (A30) and (A35)). Here, aBd=2, N=500 and α=0.8. The slight change in the establishment probability is also showcased for α=0.99. The corresponding analytic approximations (PestWM and PestS) are shown using black dotted lines. Panel C shows the theoretically exact conditional fixation probabilities (equations (A29) and (A34)) for a well-mixed (solid lines, darker color) and an amplifier (solid lines, lighter color) population, with amplification factor 2. Here, N=500 and three different values of Ns, as depicted in the figure. The corresponding analytic approximations (equations (11) and (12)) are shown using black dotted lines. Panel D shows establishment probabilities, Panel E shows conditional fixation probabilities, and Panel F shows total fixation probabilities, as a function of amplification factor, for various PA star networks, computed numerically for two different values of α, as shown, and s=0.01. The solid pink line shows the analytic approximation for the conditional fixation probability given by equation (12). Panel G Dots show an approximation of fixation probability using the approach described in the main text on a diverse array of amplifier topologies with varying amplification factors. Here, N=100,s=0.001 and α=0.9. The solid red line shows equation (13) and the dotted line showcases the well-mixed result as comparison. The insert shows the analytic approximation of the fixation probability, given by equation (12), for s=0.001 and α=1 (solid black line). The dotted line again shows the well-mixed fixation probability.
Figure 3:
Figure 3:. There exist parameter regimes with establishment - conditional fixation tradeoffs.
Panel A: Each point shows the conditional fixation probability as a function of the establishment probability for amplifier networks with amplification factor as on the x-axis in Panel B. The total fixation probability is shown by the color of the point, as in the colorbar. In Panel B, each point shows the total fixation probability as a function of the amplification factor of the network. For both panels, α=0.8 and s=0.012.
Figure 4:
Figure 4:. Ecological interactions can reverse the role of amplifiers and suppressors for weakly deleterious mutants.
Panel A. Ratio of fixation probabilities between various amplifier networks and a well-mixed population. Here, N=50 and s=0.01. The insert shows a beneficial mutant with s=0.01. Panel B. Comparison of probabilities of fixation as a function of mutant selection strength for a well-mixed population (grey lines) and an amplifier of selection (black lines, amplification factor equal to 1.92), for four different values of ecological strength α, as written in the figure. The orange line follows the exact point of intersection between the well-mixed and amplifier populations, as ecological strength α is continuously varied. For α=0.5, we recapture previous results from evolutionary graph theory, where the intersection point is at Ns = 0. Here, fixation probabilities are computed exactly, as described in Appendix 4. Population size N=50. Panel C. The points of intersection of the fixation probability between well mixed and a star population, for varying population sizes N, as depicted in the legend. The orange dotted line shows the approximation for PfixS* in the generalist regime (Appendix 3) and the red dotted line shows the approximation for PfixS* in the specialist regime (see Appendix 7).
Figure 5:
Figure 5:. Well-mixed populations do not minimize fixation time.
We plot the unconditional fixation time as a function of the pure selection coefficient s for a well-mixed population, a suppressor, and an amplifier network. Here, N=100. Each point of the graph shows the unconditional fixation time for a single network for a specific values of s and α, using 106 simulation runs. Solid lines connect points corresponding to the same network. The shape of the point represents the value of ecological selection and the color represents the network type, as shown in the legend. In contrast to dynamics observed in the absence of ecological selection (α=0.5), for α>0.5, there exist network topologies that can decrease time at equilibrium and time to fixation, compared to well-mixed populations.

Similar articles

References

    1. Allen Benjamin, Lippner Gabor, Chen Yu-Ting, Fotouhi Babak, Momeni Naghmeh, Yau Shing-Tung, and Nowak Martin A.. Evolutionary dynamics on any population structure. Nature, 544:227 EP –, 2017. - PubMed
    1. Altrock Philipp M and Traulsen Arne. Fixation times in evolutionary games under weak selection. New Journal of Physics, 11(1):013012, 2009.
    1. Altrock Philipp M, Traulsen Arne, and Nowak Martin A. Evolutionary games on cycles with strong selection. Physical Review E, 95(2):022407, 2017. - PubMed
    1. Archetti Marco and Pienta Kenneth J. Cooperation among cancer cells: applying game theory to cancer. Nature Reviews Cancer, 19(2):110–117, 2019. - PMC - PubMed
    1. Bairey Eyal, Kelsic Eric D, and Kishony Roy. High-order species interactions shape ecosystem diversity. Nature Communications, 7(1):12285, 2016. - PMC - PubMed

Publication types