[Preprint]. 2024 Apr 8:rs.3.rs-4156736.
doi: 10.21203/rs.3.rs-4156736/v1.

Development of a First-in-Class RIPK1 Degrader to Enhance Antitumor Immunity

Affiliations

Development of a First-in-Class RIPK1 Degrader to Enhance Antitumor Immunity

Jin Wang et al. Res Sq. .

Update in

Abstract

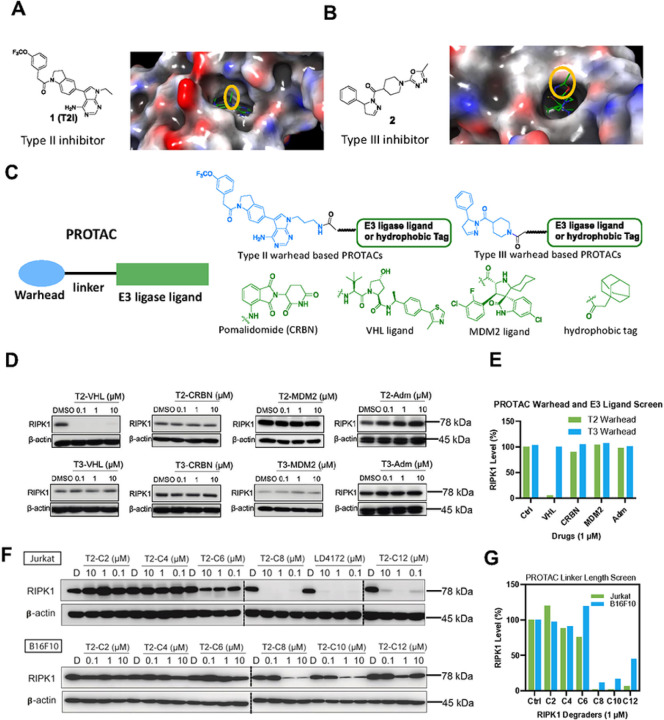
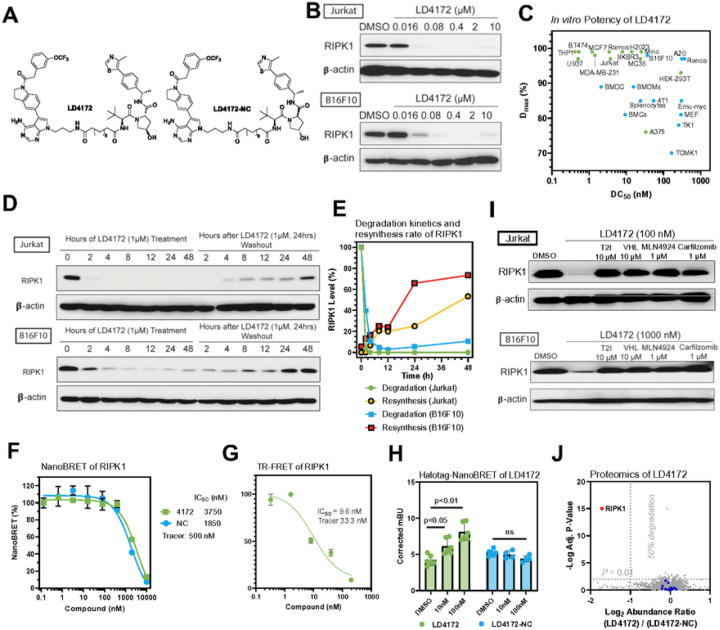
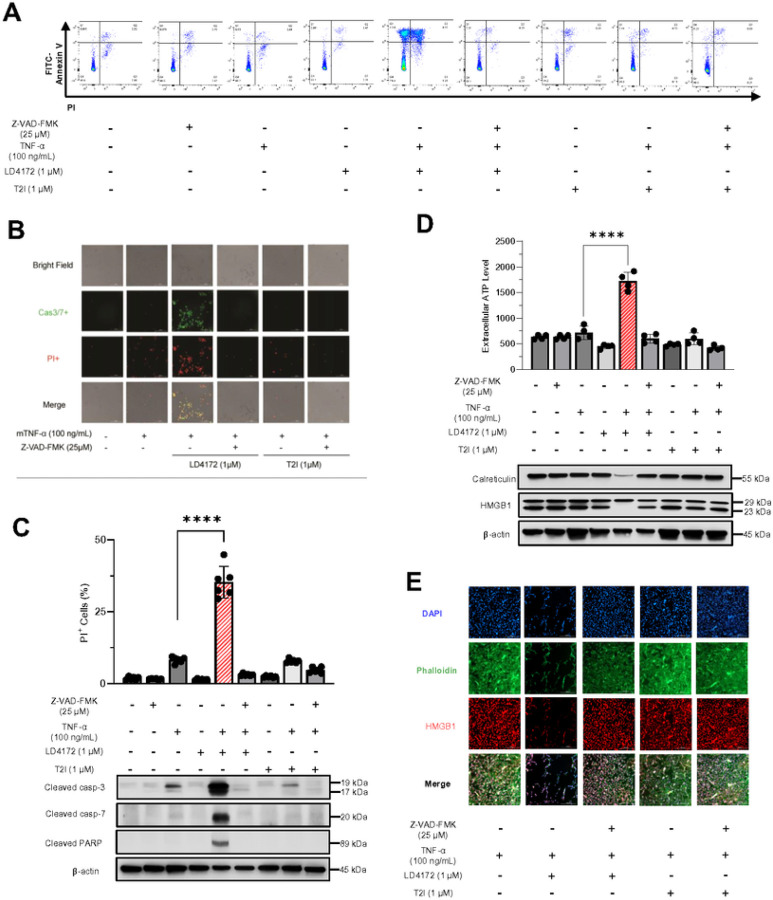
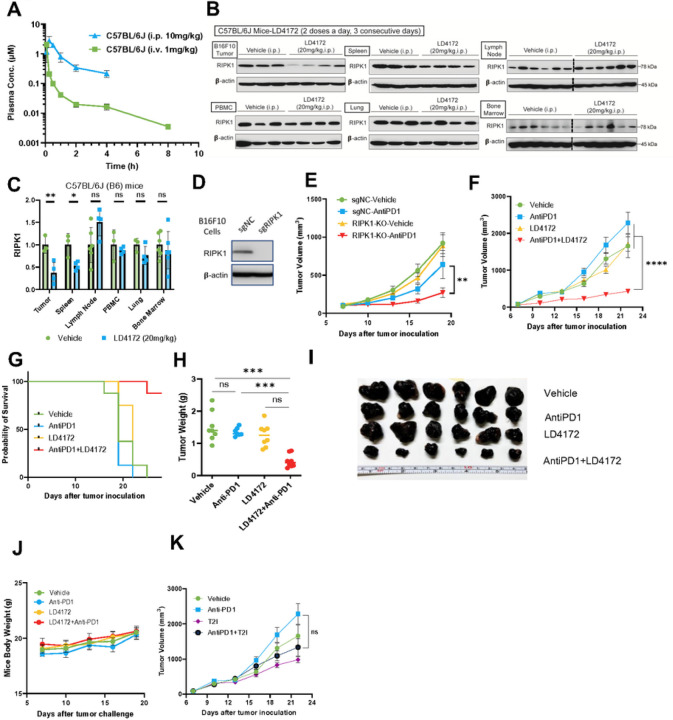
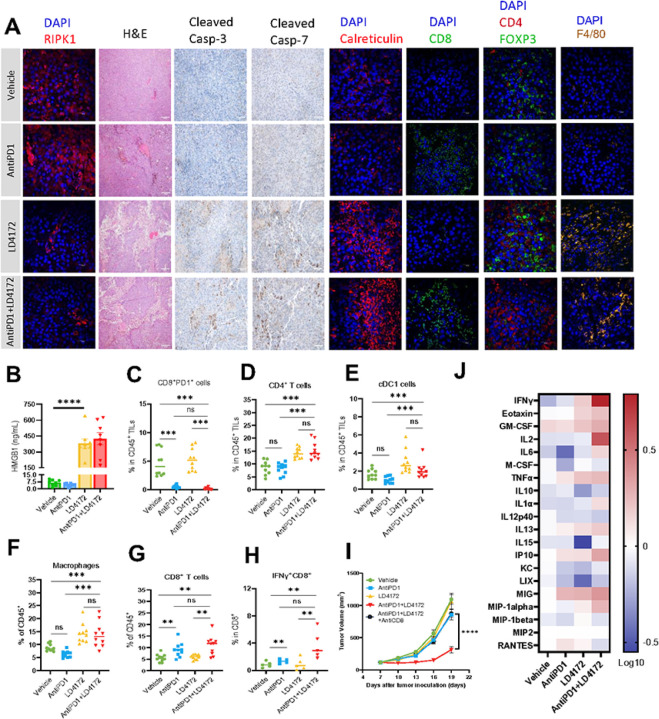
The scaffolding function of receptor interacting protein kinase 1 (RIPK1) confers intrinsic and extrinsic resistance to immune checkpoint blockades (ICBs) and has emerged as a promising target for improving cancer immunotherapies. To address the challenge posed by a poorly defined binding pocket within the intermediate domain, we harnessed proteolysis targeting chimera (PROTAC) technology to develop a first-in-class RIPK1 degrader, LD4172. LD4172 exhibited potent and selective RIPK1 degradation both in vitro and in vivo. Degradation of RIPK1 by LD4172 triggered immunogenic cell death (ICD) and enriched tumor-infiltrating lymphocytes and substantially sensitized the tumors to anti-PD1 therapy. This work reports the first RIPK1 degrader that serves as a chemical probe for investigating the scaffolding functions of RIPK1 and as a potential therapeutic agent to enhance tumor responses to immune checkpoint blockade therapy.


Conflict of interest statement

Conflicts of interest J.W. is the co-founder of CoActigon Inc. and Chemical Biology Probes, LLC. Y.X., D.L., and J.W. are inventors of a patent covering RIPK1 degraders reported in this work.

Figures

Figure 1
Figure 1
Design and screen of RIPK1 PROTACs. A, Chemical structure and docking modeling of type II inhibitor 1 with the kinase domain of RIPK1 (PDB: 4NEU). The group exposed to solvent region is highlighted with yellow circle. B, Chemical structure and co-crystal structure of type III inhibitor 2 in complex with RIPK1 (PDB: 6R5F). The solventexposed group of inhibitor 2 is highlighted with yellow circle. C, A small library design of RIPK1 PROTACs. Either Type II inhibitor 1 or type III inhibitor 2 is conjugated with various E3 ligase ligands or adamantane tag to generate a small library of RIPK1 PROTACs. D, Quantification of RIPK1 levels in Jurkat cells treated with indicated compounds for 24 h at 0, 0.1, 1 and 10 μM, followed by Western blotting. E, Quantification of D. F, Quantification of RIPK1 levels in both Jurkat and B16F10 cells treated with type II inhibitor-based PROTACs with different linker lengths for 24 h, followed by Western blotting. G, Quantification of F.
Figure 2
Figure 2
LD4172, a RIPK1 PROTAC, induces potent and highly specific degradation of RIPK1 in a panel of cell lines. A, Chemical structures of RIPK1 PROTAC, LD4172, and its negative control, LD4172-NC. LD4172-NC has an identical warhead and linker as LD4172 but with an inactive VHL ligand and is therefore unable to engage VHL to induce ubiquitination. B, Quantification of RIPK1 levels in both Jurkat and B16F10 cells treated with LD4172 at indicated concentrations for 24 h, followed by Western blotting. C, DC50 and Dmax of LD4172 in various human and mouse cell lines. DC50, the drug concentration causing 50% protein degradation; Dmax, the maximum level of protein degradation. D, RIPK1 degradation kinetics induced by LD4172 treatment (1 μM) and resynthesis kinetics upon washout of LD4172 in both Jurkat and B16F10 cells. E, Quantification of D. The degradation half-life of RIPK1 induced by LD4172 (1 μM) is <2 h in Jurkat and B16F10 cells. The resynthesis half-life of RIPK1 is ~48 h and ~24 h in Jurkat and B16F10 cells, respectively. F, NanoBRET based in-cell RIPK1 target engagement. HEK293 cells were transfected with a plasmid expressing nLuc-RIPK1 fusion protein for 24 h, followed by incubating with a RIPK1 NanoBRET tracer (500 nM) and different concentrations of LD4172 and LD4172-NC (n=3). G, Time-resolved fluorescence resonance energy transfer (TR-FRET) based biochemical binding assay for RIPK1. GST-tagged human RIPK1 (1 nM), Tb-labeled anti-GST antibody (0.3 nM), a RIPK1 TR-FRET tracer (350 nM) and different concentrations of LD4172 (n=3) were incubated for 2 hours, followed by TR-FRET measurements with an excitation wavelength at 340 nm and emission wavelengths at 495 and 520 nm. H, NanoBRET based in-cell assay for ternary complex formation. HEK293T cells were co-transfected with nLuc-RIPK1 and VHL-HaloTag plasmids for 24 h, followed by treatment with indicated concentrations of LD4172 or LD4172-NC (n=3). I, LD4172 induced RIPK1 degradation depends on ternary complex formation, neddylation and proteasome activity. Representative immunoblots of RIPK1 in both Jurkat and B16F10 cells. Cells were treated with RIPK1 inhibitor (T2I), VHL ligand, a neddylation inhibitor (MLN4924) or a proteasome inhibitor (Carfilzomib) at indicated concentrations for 4 hours, followed by LD4172 treatment for 4 hours. J, Proteome profiling of LD4172 induced protein degradation. MDA-MB- 231 cells were treated with LD4172 (200 nM) or LD4172-NC (200 nM) for 6 h (n=3). In total, ~10,000 proteins were quantified in the proteomics experiment. RIPK1 (red dot) is the only protein showing >50% degradation with p < 0.01. Blue dots represent kinases that are inhibited by the warhead of LD4172 but not degraded by LD4172.
Figure 3
Figure 3
LD4172 sensitizes B16F10 cells to TNFα-mediated apoptosis. A, Representative flow cytometry dot plots of apoptosis. In all four plots, viable cells are seen in the left lower quadrant (FITC-/PI-), early apoptotic cells in the right lower quadrant (FITC+/PI-), and late apoptotic cells in the right upper quadrant (FITC+/PI+). B, Representative images of PI (red) and caspase 3/7 (Cas3/7+, green) staining of B16F10 cells. Cell death assessed by PI uptake using Cytation 5 imager. C, Western blots for the expression of cleaved caspase3, cleaved caspase7, and cleaved PARP in B16F10 cells. D, Quantification of extracellular ATP level. Western blots for the expression of HMGB1 and calreticulin in B16F10 cells. E, Immunofluorescence staining of HMGB1 in B16F10 cells. B16F10 cells were treated in the presence or absence of TNFα (100 ng/mL), Z-VAD-FMK (25 μM), LD4172 (1 μM), and/or T2I (1 μM) as indicated for 72 hours. Data are representative of three independent experiments. Error bars represent SD.
Figure 4
Figure 4
LD4172 synergizes with Anti-PD1 to inhibit tumor growth. A, Plasma concentrations of LD4172 in C57BL/6J mice administered 1 mg/kg intravenously (i.v.) or 10 mg/kg intraperitoneally (i.p.) (n=4). B, Representative immunoblots of RIPK1 in different tissues of C57BL/6J mice treated with LD4172 (n=3–4). C, Densitometric analysis of RIPK1 protein levels in different tissues (n=3 or 4). D, Representative immunoblots of RIPK1 levels of B16F10 cells transduced with gRNA specific for RIPK1 or non-targetable control (sgNC). E, B16F10-RIPK1-KO tumors sensitized to anti-PD1 treatment: 3×10⁵ B16F10 cells transduced with gRNA specific for RIPK1 or non-targetable control (sgNC) were inoculated into C57BL/6J mice. After seven days, mice with measurable tumors (~100 mm3) were randomly treated with or without anti-PD1 in vivo (100 μg per dose, i.p., every three days, n=8). F, Tumor growth curve of mice with B16F10 tumors treated with LD4172 and/or anti-PD1 (n=8). C57B6/J mice were subcutaneously inoculated with 3×10⁵ B16F10 tumor cells. After seven days (tumor size ~ 100 mm3), mice were treated every three days with anti- PD1 (100 μg per dose, i.p.), daily with LD4172 (20 mg/kg, i.p.), a combination of LD4172 and anti-PD1 (same dose as their individual doses), or their corresponding vehicle control. G, Kaplan-Meier survival curve for all experimental groups. H, Final tumor weight (g) from F after 22d of treatment (n=8). I, Representative images of B16F10 tumors collected at the end of treatment. J, Mouse body weight (n=8). K, Tumor growth curve of mice with B16F10 tumors treated with T2I and/or anti-PD1 (n=8). The experimental conditions and treatment regimens were the same as F except using the RIPK1 kinase inhibitor T2I (20 mg/kg, i.p.) to replace LD4172. Representative data from at least three independent experiments are shown. Data are expressed as the mean ± SEM. * p<0.05; ** p<0.01; *** p<0.001, **** p<0.0001, respectively. ns, indicates no statistical significance.
Figure 5
Figure 5
LD4172 alters the tumor immune microenvironment. A. Representative immunofluorescent images depict RIPK1, Calreticulin, CD8, CD4, Foxp3, or F4/80, as well as hematoxylin and eosin (H&E) images, alongside representative images illustrating cleaved caspase3/7 levels in B16F10 tumors under the indicated treatment for five days. n = 4–6 independent fields per group. Scale bars are shown as follows: 20 μm, objective 60X; 200 μm, objective 60X. B. The mouse plasma HMGB1 level from different treatment groups (n=8). C-G. Flow cytometry quantification of PD1+CD8+ T cells (C), CD4+ T cells (D), cDC cells (E), macrophages (F), and CD8+ T cells (G) in B16F10 tumors following 5 days of indicated treatment (n = 10/group). H. Flow cytometric quantification of IFNγ+ CD8+ T cells in B16F10 tumors treated with the indicated treatments for 5 days and stimulated with PMA/ionomycin in vitro for 6 h (n = 10/group). I. Tumor volume (mm3) of vehicle-, anti-PD1-, LD4172-, anti-PD1+LD4172-, and anti-PD1+LD4172+anti-CD8–treated B16F10 tumors (n=8). J. Heat map showing log 10-fold changes in the concentration of mouse plasma cytokines normalized by the mean value of control mice (n=8). For all experiments: LD4172: 20 mg/kg; anti-PD1 antibody: 100 μg/mice; Combo: LD4172 plus anti-PD1. Representative data from at least three independent experiments are shown. Data are expressed as the mean ± SEM. * p<0.05; ** p<0.01; *** p<0.001; **** p<0.0001, respectively. “ns” indicates no statistical significance.

References

    1. Korman AJ, Garrett-Thomson SC, Lonberg N (2022) The foundations of immune checkpoint blockade and the ipilimumab approval decennial. Nat Rev Drug Discov 21:509–528 - PubMed
    1. Vesely MD, Zhang T, Chen L (2022) Resistance Mechanisms to Anti-PD Cancer Immunotherapy. Annu Rev Immunol 40:45–74 - PubMed
    1. Upadhaya S, Neftelinov ST, Hodge J, Campbell J (2022) Challenges and opportunities in the PD1/PDL1 inhibitor clinical trial landscape. Nat Rev Drug Discovery 21:482–483 - PubMed
    1. Mifflin L, Ofengeim D, Yuan J (2020) Receptor-interacting protein kinase 1 (RIPK1) as a therapeutic target. Nat Rev Drug Discov 19:553–571 - PMC - PubMed
    1. Cucolo L et al. (2022) The interferon-stimulated gene RIPK1 regulates cancer cell intrinsic and extrinsic resistance to immune checkpoint blockade. Immunity 55:671–685e10. - PMC - PubMed

Publication types