[Preprint]. 2024 Apr 8:rs.3.rs-4078779.
doi: 10.21203/rs.3.rs-4078779/v1.

A multidimensional investigation of sleep and biopsychosocial profiles with associated neural signatures

Affiliations

A multidimensional investigation of sleep and biopsychosocial profiles with associated neural signatures

Aurore A Perrault et al. Res Sq. .

Abstract

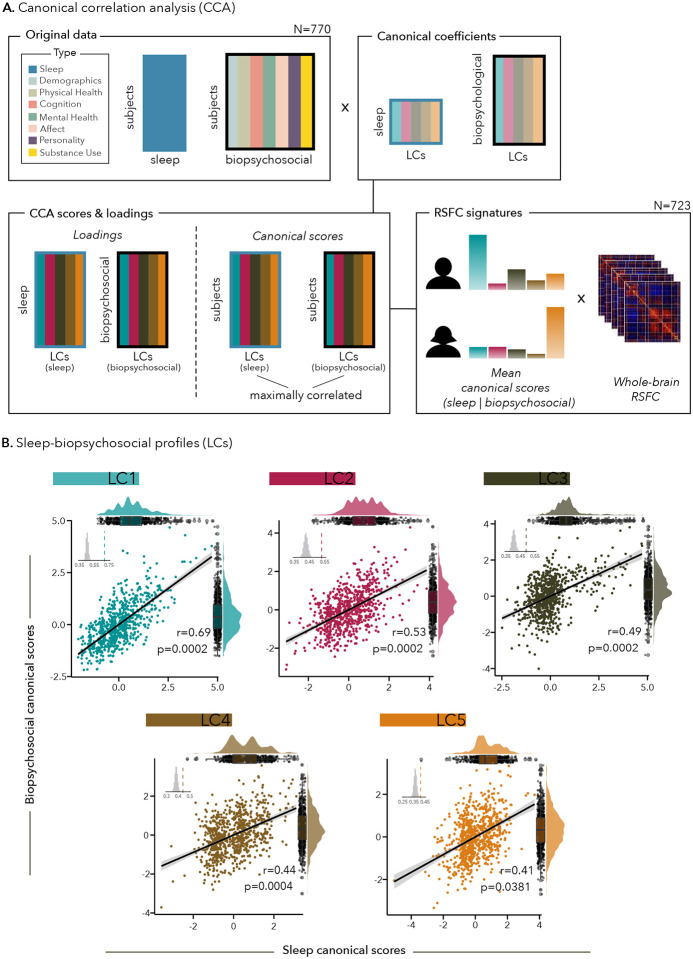
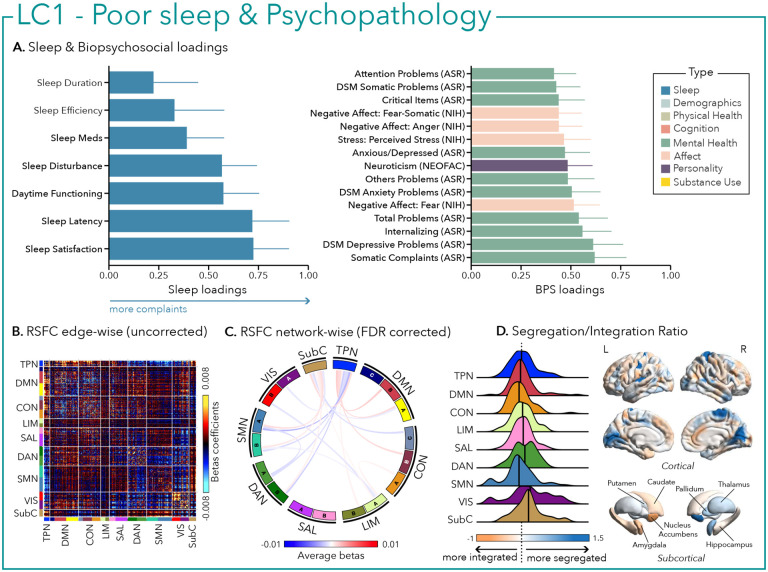
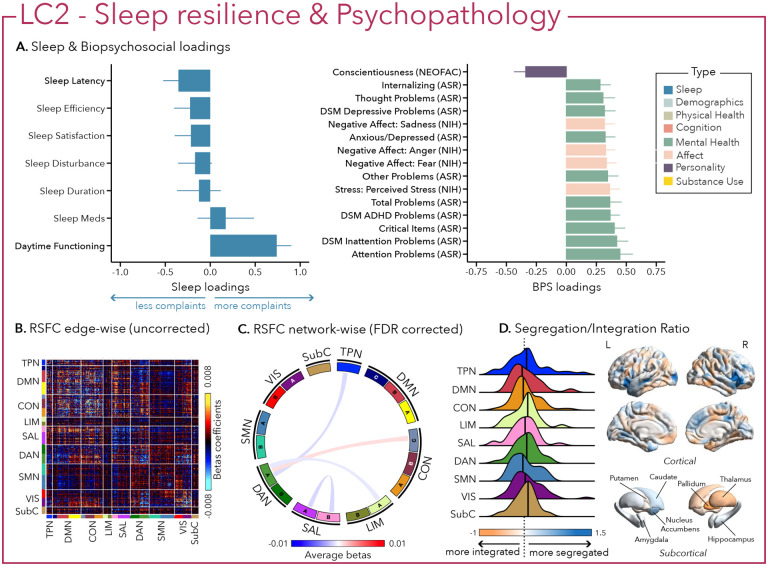
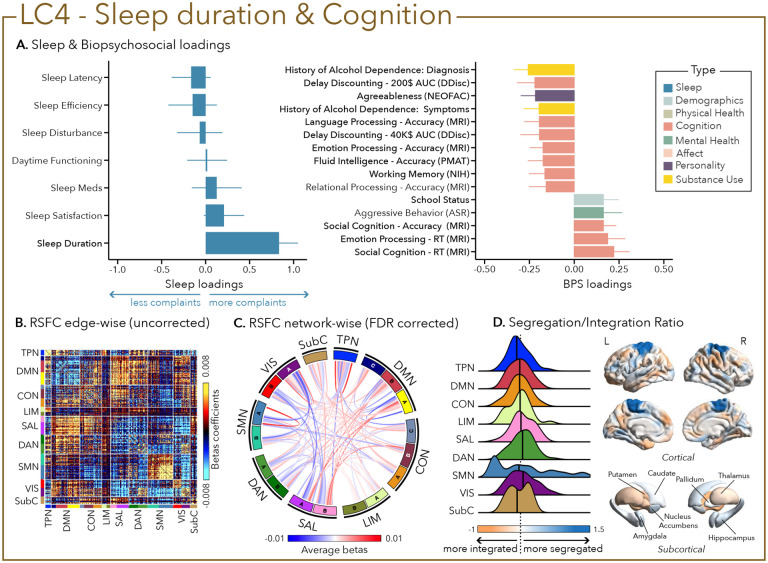
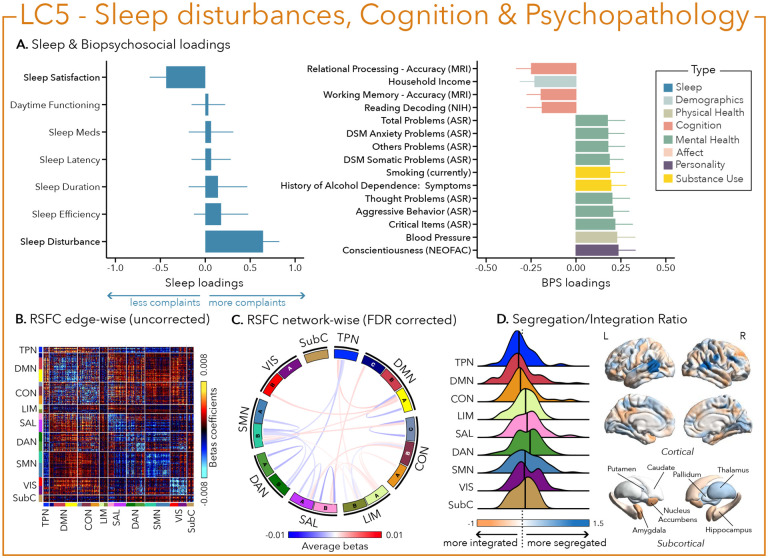
Sleep is essential for optimal functioning and health. Interconnected to multiple biological, psychological and socio-environmental factors (i.e., biopsychosocial factors), the multidimensional nature of sleep is rarely capitalized on in research. Here, we deployed a data-driven approach to identify sleep-biopsychosocial profiles that linked self-reported sleep patterns to inter-individual variability in health, cognition, and lifestyle factors in 770 healthy young adults. We uncovered five profiles, including two profiles reflecting general psychopathology associated with either reports of general poor sleep or an absence of sleep complaints (i.e., sleep resilience) respectively. The three other profiles were driven by sedative-hypnotics-use and social satisfaction, sleep duration and cognitive performance, and sleep disturbance linked to cognition and mental health. Furthermore, identified sleep-biopsychosocial profiles displayed unique patterns of brain network organization. In particular, somatomotor network connectivity alterations were involved in the relationships between sleep and biopsychosocial factors. These profiles can potentially untangle the interplay between individuals' variability in sleep, health, cognition and lifestyle - equipping research and clinical settings to better support individual's well-being.

Keywords: biopsychosocial outcomes; cognition; multivariate; profile; psychopathology; sleep.


Conflict of interest statement

Additional Declarations: There is NO Competing Interest.

Figures

Figure 1 -
Figure 1 -. Canonical correlation analysis reveals five sleep-biopsychosocial profiles (LCs).
(A) Canonical correlation analysis (CCA) flowchart and RSFC signatures; (B) Scatter plots showing correlations between biopsychosocial and sleep canonical scores. Each dot represents a different participant. Inset shows the null distribution of canonical correlations obtained by permutation testing; note that the null distribution is not centered at zero. The dashed line indicates the actual canonical correlation computed for each LC. The distribution of sleep (top) and biopsychosocial (right) canonical scores is shown on rain cloud plots.
Figure 2 –
Figure 2 –. First latent component (LC1) reflects poor sleep and psychopathology.
(A) Sleep loadings (left) and top 15 strongest biopsychosocial (BPS) loadings (right) for LC1. Greater loadings on LC1 were associated with higher measures of poor sleep and psychopathology. Higher values on sleep (blue) and biopsychosocial (green, purple, pink) loadings indicate worse outcomes. Error bars indicate bootstrapped-estimated confidence intervals (i.e., standard deviation) and measures in bold indicate statistical significance (after FDR correction q<0.05); (B) Unthresholded edge-wise beta coefficients obtained from generalized linear models (GLM) between participants’ LC1 canonical scores (i.e., averaged sleep and behavior canonical scores) and their RSFC data; (C) FDR-corrected network-wise beta coefficients computed with GLMs within and between 17 Yeo networks and subcortical regions. (D) Distribution of the integration/segregation ratio in each of the 7 Yeo networks and subcortical regions associated with LC1 (left). The dashed line indicates the median of all parcels, and the bold black lines represent the median for each network. The integration/segregation ratio values for the 400 Schaeffer parcellation and 7 subcortical regions are projected on cortical and subcortical surfaces (right).
Figure 3 –
Figure 3 –. Second latent component (LC2) reflects sleep resilience and psychopathology.
(A) Sleep loadings (left) and top 15 strongest biopsychosocial (BPS) loadings (right) for LC2. Greater loadings on LC2 were associated with higher measures of complaints of daytime dysfunction and psychopathology. Positive values on sleep (blue) loadings indicate worse outcomes while positive values on biopsychosocial (green, purple, pink) loadings reflect higher magnitude on these measures. Error bars indicate bootstrapped-estimated confidence intervals (i.e., standard deviation) and measures in bold indicate statistical significance. (B) Unthresholded edge-wise beta coefficients obtained from generalized linear models (GLM) between participants’ LC1 canonical scores (i.e., averaged sleep and behavior canonical scores) and their RSFC data; (C) FDR-corrected network-wise beta coefficients computed with GLMs within and between 17 Yeo networks and subcortical regions. (D) Distribution of the integration/segregation ratio in each of the 7 Yeo networks and subcortical regions associated with LC2 (left). The dashed line indicates the median of all parcels, and the bold black lines represent the median for each network. The integration/segregation ratio values for the 400 Schaeffer parcellation and 7 subcortical regions are projected on cortical and subcortical surfaces (right).
Figure 4 –
Figure 4 –. Third latent component (LC3) reflects hypnotics and sociability.
(A) Sleep loadings (left) and top 15 strongest biopsychosocial (BPS) loadings (right) for LC3. Greater loadings on LC3 were associated with the use of sedative-hypnotics and measures of positive social relationships, lower body mass index (BMI) and poor visual episodic memory performance. Positive values on sleep (blue) loadings indicate worse outcomes while positive values on the mental health (green), affect (pink) and personality (purple) categories of biopsychosocial loadings reflect higher magnitude on these measures. Positive value in the physical health (olive) category represents higher value and positive values in the cognition (orange) category indicate either higher accuracies or slower reaction times (RT). Error bars indicate bootstrapped-estimated confidence intervals (i.e., standard deviation) and measures in bold indicate statistical significance. (B) Unthresholded edge-wise beta coefficients obtained from generalized linear models (GLM) between participants’ LC1 canonical scores (i.e., averaged sleep and behavior canonical scores) and their RSFC data; (C) FDR-corrected network wise beta coefficients computed with GLMs within and between 17 Yeo networks and subcortical regions. (D) Distribution of the integration/segregation ratio in each of the 7 Yeo networks and subcortical regions associated with LC3 (left). The dashed line indicates the median of all parcels, and the bold black lines represent the median for each network. The integration/segregation ratio values for the 400 Schaeffer parcellation and 7 subcortical regions are projected on cortical and subcortical surfaces (right).
Figure 5 –
Figure 5 –. Fourth latent component (LC4) reflects sleep duration and cognition.
(A) Sleep loadings (left) and top 15 strongest biopsychosocial (BPS) loadings (right) for LC4. Greater loadings on LC4 were associated with shorter sleep duration and measures of poor cognitive performance. Positive values on sleep loadings indicate worse outcomes while positive values on the mental health (green), substance use (yellow), demographics (light blue) and personality (purple) categories of biopsychosocial loadings reflect higher magnitude on the measures. Positive values in the cognition (orange) category indicate either higher accuracies or slower reaction times (RT). Error bars indicate bootstrapped-estimated confidence intervals (i.e., standard deviation) and measures in bold indicate statistical significance. (B) Unthresholded edge-wise beta coefficients obtained from generalized linear models (GLM) between participants’ LC1 canonical scores (i.e., averaged sleep and behavior canonical scores) and their RSFC data; (C) FDR-corrected network-wise beta coefficients computed with GLMs within and between 17 Yeo networks and subcortical regions. (D) Distribution of the integration/segregation ratio in each of the 7 Yeo networks and subcortical regions associated with LC4 (left). The dashed line indicates the median of all parcels, and the bold black lines represent the median for each network. The integration/segregation ratio values for the 400 Schaeffer parcellation and 7 subcortical regions are projected on cortical and subcortical surfaces (right).
Figure 6 –
Figure 6 –. Fifth latent component (LC5) reflects sleep disturbance, cognition and psychopathology.
(A) Sleep loadings (left) and top 15 strongest biopsychosocial (BPS) loadings (right) for LC5. Greater loadings on LC5 were associated with the presence of sleep disturbances, higher measures of psychopathology and lower cognitive performance. Positive values on sleep loadings indicate worse outcomes while positive values on the mental health (green), substance use (yellow) and personality (purple) categories of biopsychosocial loadings reflect higher magnitude on these measures. Positive values in the cognition (orange) category indicate either higher accuracies or slower reaction times (RT), while positive values in the demographics (light blue) and physical health (olive) categories represent higher values. Error bars indicate bootstrapped-estimated confidence intervals (i.e., standard deviation) and measures in bold indicate statistical significance. (B) Unthresholded edge-wise beta coefficients obtained from generalized linear models (GLM) between participants’ LC1 canonical scores (i.e., averaged sleep and behavior canonical scores) and their RSFC data; (C) FDR-corrected network-wise beta coefficients computed with GLMs within and between 17 Yeo networks and subcortical regions. (D) Distribution of the integration/segregation ratio in each of the 7 Yeo networks and subcortical regions associated with LC5 (left). The dashed line indicates the median of all parcels, and the bold black lines represent the median for each network. The integration/segregation ratio values for the 400 Schaeffer parcellation and 7 subcortical regions are projected on cortical and subcortical surfaces (right).

Similar articles

References

    1. Becker S. P., Langberg J. M. & Byars K. C. Advancing a Biopsychosocial and Contextual Model of Sleep in Adolescence: A Review and Introduction to the Special Issue. J. Youth Adolesc. 44, 239–270 (2015). - PubMed
    1. Verma K., Singh D. & Srivastava A. Sleep disorders and its consequences on biopsychosocial health: A narrative review. Yoga Mimamsa 54, 101 (2022).
    1. Havelka M., Luanin J. D. & Luanin D. Biopsychosocial Model – The Integrated Approach to Health and Disease. Coll Antropol (2009). - PubMed
    1. Bolton D. & Gillett G. The Biopsychosocial Model of Health and Disease: New Philosophical and Scientific Developments. (Springer International Publishing, Cham, 2019). doi:10.1007/978-3-030-11899-0. - DOI - PubMed
    1. Roth T. et al. Sleep Problems, Comorbid Mental Disorders, and Role Functioning in the National Comorbidity Survey Replication (NCS-R). Biol. Psychiatry 60, 1364–1371 (2006). - PMC - PubMed

Publication types

LinkOut - more resources