[Preprint]. 2024 Dec 23:2024.04.15.589545.
doi: 10.1101/2024.04.15.589545.

Enteric glia regulate Paneth cell secretion and intestinal microbial ecology

Affiliations

Enteric glia regulate Paneth cell secretion and intestinal microbial ecology

Aleksandra Prochera et al. bioRxiv. .

Update in

Abstract

Glial cells of the enteric nervous system (ENS) interact closely with the intestinal epithelium and secrete signals that influence epithelial cell proliferation and barrier formation in vitro. Whether these interactions are important in vivo, however, is unclear because previous studies reached conflicting conclusions [1]. To better define the roles of enteric glia in steady state regulation of the intestinal epithelium, we characterized the glia in closest proximity to epithelial cells and found that the majority express PLP1 in both mice and humans. To test their functions using an unbiased approach, we genetically depleted PLP1+ cells in mice and transcriptionally profiled the small and large intestines. Surprisingly, glial loss had minimal effects on transcriptional programs and the few identified changes varied along the gastrointestinal tract. In the ileum, where enteric glia had been considered most essential for epithelial integrity, glial depletion did not drastically alter epithelial gene expression but caused a modest enrichment in signatures of Paneth cells, a secretory cell type important for innate immunity. In the absence of PLP1+ glia, Paneth cell number was intact, but a subset appeared abnormal with irregular and heterogenous cytoplasmic granules, suggesting a secretory deficit. Consistent with this possibility, ileal explants from glial-depleted mice secreted less functional lysozyme than controls with corresponding effects on fecal microbial composition. Collectively, these data suggest that enteric glia do not exert broad effects on the intestinal epithelium but have an essential role in regulating Paneth cell function and gut microbial ecology.


Figures
Figure 1.
Figure 1.. Mucosal glia in human and mouse small intestines widely express Plp1.
A) t-SNE plot of 94,451 cells isolated from terminal ileal mucosal biopsies from 13 children with non-inflammatory, functional gastrointestinal disorders [20], colored by annotated cell identity. PLP1 and SOX10 expression exhibit relative specificity to glia; the cells express high levels of these transcripts. S100B is expressed by glia as well as non-glial cells such as macrophages and monocytes. GFAP is undetectable in this dataset. B) Heatmap of gene expression from 82,417 cells obtained by scRNAseq of mucosal biopsies from inflamed and non-inflamed segments of terminal ileum obtained from 11 adults with Crohn’s disease [21]. In contrast to PLP1, SOX10, and S100B, which are most highly expressed in glia (arrow), GFAP expression is highest in non-glial cells. C) Whole-mount immunostaining of ileum from an adult Plp1-eGFP mouse for GFAP imaged at the level of the villus- (top panels) and crypt-associated mucosa (bottom panels). Most glia in the villi express both PLP1 and GFAP while virtually all glia in the mucosa surrounding epithelial crypts are PLP1+ and not immunoreactive for GFAP. (D) Quantification of the percentages of GFAP+, PLP1+, GFAP+PLP1+ cells in the mucosa. Each data point represents an individual mouse, with triangles representing males and circles representing females. Scale bars = 100μm (large panels) and 20μm (magnified images). Error bars represent SEM. **** p<0.0001 by one-way ANOVA with Tukey multiple comparisons test.
Figure 2.
Figure 2.. Glial ablation induces muted, region-specific transcriptional changes along the longitudinal axis of the intestine.
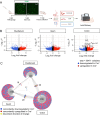
A) Schematic of the experimental timeline for bulk RNA-sequencing of intestinal tissue segments from male Plp1CreER Rosa26DTA/+ mice (annotated as Cre+) and Rosa26DTA/+ littermate controls (annotated as Cre). Tissues were collected 11 days after administration of tamoxifen (11dpt; n = 4 per genotype). In this model, the majority of enteric glial cells (EGC) are eliminated by 5dpt, as seen on the representative IHC image of S100B staining in Cre+ and Cre small intestine mucosa. Glia depletion is stable through at least 14dpt [12]. B) Volcano plots showing differentially expressed genes in duodenum, ileum, and colon of Cre and Cre+ mice. Genes that reached statistical significance cutoff of padj < 0.05 are labeled. Red and blue colors denote up- and down-regulated genes in Cre+ mice compared to Cre mice with p-value < 0.05, respectively. Differential analysis was conducted using DESeq2. C) DiVenn analysis illustrates genes that were up- (red) or down-regulated (blue) in the duodenum, ileum, and colon of Cre+ mice compared to Cre controls at 11dpt with p<0.05 threshold for significance. Nodes linking tissues constitute genes that were differentially expressed in Cre+ mice compared to Cre controls in both of those tissues. Yellow color marks genes with discordant direction of change between the different tissue regions. Numbers indicate the number of genes at each node or tissue segment that were identified as differentially expressed. Overall, this analysis illustrates that most differentially expressed genes in Cre+ mice were region-specific with little overlap between duodenum, ileum, and colon.
Figure 3.
Figure 3.. Glial ablation causes enrichment of specific epithelial cell type signatures without altering epithelial composition.
A) DiVenn analysis illustrates genes that were consistently up- (red) or down-regulated (blue) in the ileal epithelia and full-thickness ileal segments of Cre+ mice compared to Cre controls at 11dpt with p<0.05 threshold for significance. Yellow color marks genes with discordant direction of change between the ileal epithelia and full-thickness ileal segments. B) Gene set enrichment analysis (GSEA) of gene expression data from Cre+ vs. Cre ileal epithelium using single-cell gene signatures for epithelial cell types (schematic representation of component cell types on the left) derived from Haber et al., 2017 ([34], Supplementary Table 1). The Paneth cell signature was most significantly enriched in the ileal epithelium of glia-depleted mice. Red color denotes the significant enrichment consistent across two independent GSEA. Thresholds for DE analysis: p-value <0.05. *** p<0.001, FDR <.001, ** p<0.001, FDR <0.01, * p<0.05, FDR <0.05, ns – non-significant. C – D) Quantification of epithelial subtypes in the small intestines of Cre and Cre+ mice with representative IHC images and flow cytometry plots below each graph showing the marker and approach used for cell identification. Each data point represents an individual mouse, with triangles representing males and circles representing females. Error bars represent SEM. ns - not significant by unpaired parametric t-test. Scale bar = 100μm. E-Cadherin (E-CAD) labels cell borders, LYZ1 marks Paneth cells, Lgr5 transcript expression marks intestinal stem cells (SCs), Alcian blue marks goblet cells, Chromogranin A (CHGA) marks enteroendocrine cells, and NKM216-2-4 identifies microfold (M) cells by flow cytometry. Cell nuclei are labeled with DAPI (blue) in the IHC panels.
Figure 4.
Figure 4.. Glial depletion triggers morphological changes in Paneth cells.
A) Representative images of UEA-I staining of Paneth cell granules in the small intestine of Cre and Cre+ mice (observed in at least 3 mice per genotype). Scale bar = 10μm. B) Representative transmission electron microscopy images of Paneth cells (n = 2 mice per genotype from independent cohorts). Paneth cells in Cre+ mice are globular, exhibit loss of polarity, and have heterogeneous granules (PG; arrows indicate errant granules). L, Lumen of the intestinal crypts; LP, lamina propria. Scale bar = 3μm.
Figure 5.
Figure 5.. Enteric glial depletion impairs Paneth cell secretion and alters the composition of the gut microbiome.
A) Pathway analysis using GO term for cellular compartment shows significant enrichment of Paneth cell genes in glial-depleted mice. B) Schematic of explant assay used to analyze Paneth cell secretion. Small intestinal explants were acutely isolated, ligated at both ends, and incubated in oxygenated media at 37°C for 30min. Luminal contents were then extracted and analyzed for lysozyme activity by fluorometric assay. C) Luminal lysozyme activity in ileal explants from Cre+ and Cre mice. Lysozyme activity was lower in ileal explants from Cre+ mice compared to Cre littermate controls (p=0.0188), mirroring the effects of Paneth cell disruption by dithizone (DTZ) in wildtype mice (p=0.0571). Each data point represents one mouse (n = 4 per treatment, n= 9 mice per genotype). Open triangles in DTZ group represent subset of explants incubated with 10µM carbachol to stimulate secretion. Error bars represent SEM. ns – non-significant, p values shown are from Mann-Whitney U test. D - G) Microbiome analysis by 16S rDNA sequencing of fecal pellets from Cre and Cre+ mice at 0dpt (baseline, pre-induction) and 11dpt. Graphs depict α-diversity (D) and β-diversity (E) where each data point represent one mouse, with triangles indicating males and circles indicating females. Error bars represent SEM. p-values reflect unpaired parametric t-test. Analysis of phylum- (F) and species- (G) specific differences at 11dpt using LEfSe (p<0.1, LDA>1, FDR-adjusted significance values provided). Any phyla or species detected as differentially abundant at baseline are demarcated in grey. H) Working model of glial regulation of Paneth cell function. In the normal intestine, Paneth cells are loaded with secretory granules containing LYZ1 that are released into the gut lumen in response to acetylcholine (ACh) and other signals to regulate microbial composition. Upon glial depletion, Paneth cell secretion is disrupted leading to dysmorphic granules, diminished LYZ1 secretion, and altered fecal microbial composition. This occurs without a change in Paneth cell number, loss of muscarinic acetylcholine receptor expression, or denervation of the cholinergic fibers that normally surround epithelial crypts.

References

    1. Prochera A. and Rao M., “Mini-Review: Enteric glial regulation of the gastrointestinal epithelium,” Neurosci. Lett., vol. 805, p. 137215, May 2023, doi: 10.1016/j.neulet.2023.137215. - DOI - PMC - PubMed
    1. Seguella L. and Gulbransen B. D., “Enteric glial biology, intercellular signalling and roles in gastrointestinal disease,” Nat. Rev. Gastroenterol. Hepatol., vol. 18, no. 8, pp. 571–587, Aug. 2021, doi: 10.1038/s41575-021-00423-7. - DOI - PMC - PubMed
    1. Rosenberg H. J. and Rao M., “Enteric glia in homeostasis and disease: From fundamental biology to human pathology,” iScience, vol. 24, no. 8, p. 102863, Aug. 2021, doi: 10.1016/j.isci.2021.102863. - DOI - PMC - PubMed
    1. Ferri G.-L., Probert L., Cocchia D., Michetti F., Marangos P. J., and Polak J. M., “Evidence for the presence of S-100 protein in the glial component of the human enteric nervous system,” Nature, vol. 297, no. 5865, pp. 409–410, Jun. 1982, doi: 10.1038/297409a0. - DOI - PubMed
    1. Mestres P., Diener M., and Rummer W., “Electron Microscopy of the Mucosal Plexus of the Rat Colon,” Cells Tissues Organs, vol. 143, no. 4, pp. 275–282, 1992, doi: 10.1159/000147262. - DOI - PubMed

Publication types