[Preprint]. 2024 Apr 16:2024.04.16.589745.
doi: 10.1101/2024.04.16.589745.

Geranylgeranylated-SCFFBXO10 Regulates Selective Outer Mitochondrial Membrane Proteostasis and Function

Affiliations

Geranylgeranylated-SCFFBXO10 Regulates Selective Outer Mitochondrial Membrane Proteostasis and Function

Sameer Ahmed Bhat et al. bioRxiv. .

Update in

Abstract

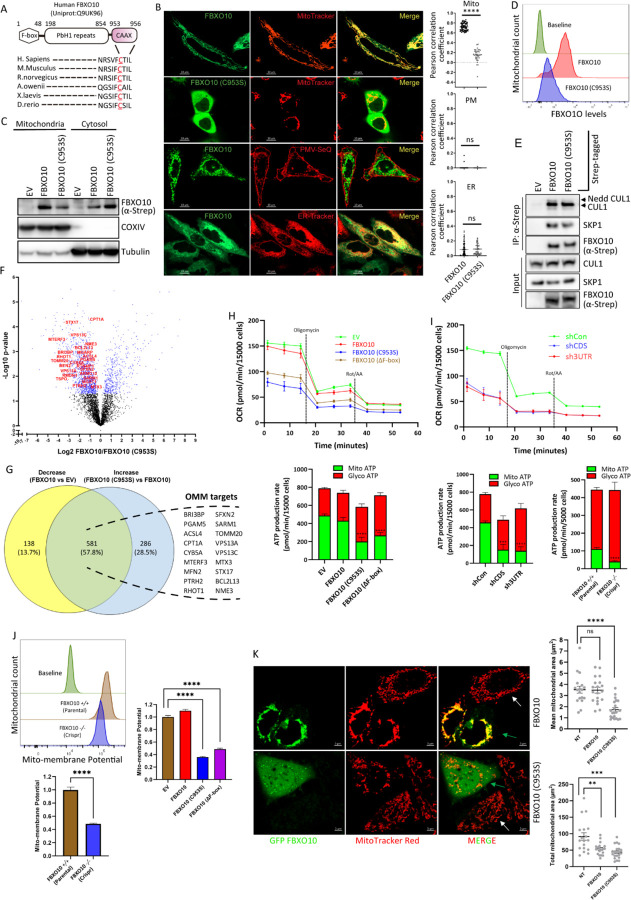
E3-ubiquitin ligases (E3s) are main components of the ubiquitin-proteasome system (UPS), as they determine substrate specificity in response to internal and external cues to regulate protein homeostasis. However, the regulation of membrane protein ubiquitination by E3s within distinct cell membrane compartments or organelles is not well understood. We show that FBXO10, the interchangeable component of the SKP1/CUL1/F-box ubiquitin ligase complex (SCF-E3), undergoes lipid-modification with geranylgeranyl isoprenoid at Cysteine953 (C953), facilitating its dynamic trafficking to the outer mitochondrial membrane (OMM). FBXO10 polypeptide does not contain a canonical mitochondrial targeting sequence (MTS); instead, its geranylgeranylation at C953 and the interaction with two cytosolic factors, PDE6δ (a prenyl group-binding protein), and HSP90 (a mitochondrial chaperone) orchestrate specific OMM targeting of prenyl-FBXO10 across diverse membrane compartments. The geranylgeranylation-deficient FBXO10(C953S) mutant redistributes away from the OMM, leading to impaired mitochondrial ATP production, decreased mitochondrial membrane potential, and increased mitochondrial fragmentation. Phosphoglycerate mutase 5 (PGAM5) was identified as a potential substrate of FBXO10 at the OMM using comparative quantitative mass spectrometry analyses of enriched mitochondria (LFQ-MS/MS), leveraging the redistribution of FBXO10(C953S). FBXO10, but not FBXO10(C953S), promoted polyubiquitylation and degradation of PGAM5. Examination of the role of this pathway in a physiological context revealed that the loss of FBXO10 or expression of prenylation-deficient-FBXO10(C953S) inhibited PGAM5 degradation, disrupted mitochondrial homeostasis, and impaired myogenic differentiation of human iPSCs and murine myoblasts. Our studies identify a mechanism for selective E3-ligase mediated regulation of mitochondrial membrane proteostasis and metabolic health, potentially amenable to therapeutic intervention.


Conflict of interest statement

Declaration of interests. None.

Figures

Figure 1.
Figure 1.. Mitochondrial function and selective proteostasis at outer mitochondrial membrane (OMM) controlled by FBXO10.
(A) FBXO10 polypeptide terminates in a CaaX motif with Cysteine953 conserved across species. FBXO10 schematic at top shows the predicted protein domain configuration highlighting F-box, PBH1 and newly identified C-terminal CaaX motif. The alignment of C-terminal amino acid sequences of FBXO10 orthologs is shown. CaaX motif with Cysteine953 is underlined. The numerals on top represent the position from the N-terminus corresponding to human polypeptide. (B) FBXO10 subcellular distribution at mitochondria depends on the integrity of CaaX-Cysteine953. HeLa cells expressing GFP-FBXO10 (panels 1, 3 and 4) and CaaX-motif mutant GFP-FBXO10(C953S) (panel 2) were either treated with MitoTracker, ER-Tracker or co-transfected with PMV-SeQ to decorate mitochondrial networks (panels 1 and 2), ER (panel 4) and plasma membranes (PM, panel 3), respectively. ER-Tracker and Mito-Tracker were added 15 minutes prior to live cell confocal imaging by ZEISS-LSM700 confocal microscope, as shown by representative captured images. Pearson correlation coefficients (PCC) for the subcellular organelle colocalization of GFP-FBXO10 and GFP-FBXO10 (C953S) were analyzed in different cells [MitoTracker: N= 64 for FBXO10 and N= 35 for FBXO10 (C953S); PMV-SeQ: N= 85 for FBXO10 and N= 70 for FBXO10 (C953S); ER-Tracker : N= 157 for FBXO10 and N= 33 for FBXO10 (C953S)]. Statistical analysis of plotted PPCs in scatter plots confirmed subcellular distribution of GFP-FBXO10 exclusively at mitochondria in contrast to CaaX-motif mutant GFP-FBXO10(C953S) which re-distributes away from the mitochondria, ER and PM. p-values were calculated by student-T-test. Scale bar 10 μM. (C) FBXO10, but not CaaX-mutant FBXO10(C953S), is retained in subcellular mitochondrial fractions. STREP-tagged FBXO10, FBXO10(C953S), and vehicle (EV) were expressed in HEK-293T cells and post-harvesting cell lysates were subjected to subcellular fractionation using stepwise ultracentrifugation (see Methods). Enriched mitochondrial and cytosolic fractions were assayed by SDS-PAGE and immunoblotted as indicated. Representative of three independent experiments is shown. (D) CaaX-mutant FBXO10(C953S) is delocalized away from mitochondria. Enriched mitochondrial fractions were isolated from HEK293T cells expressing ptd-Tomato-FBXO1O, ptd-Tomato-FBXO10 (C953S) and non-expressing controls by stepwise centrifugation. Isolated mitochondrial fractions were incubated with MitoView green to allow mitochondrial tracking during flowcytometry analysis (FACS) for the quantification of ptd-Tomato-FBXO10 and ptd-Tomato-FBXO10 (C953S) signals. Representative FACS histogram confirms localization of FBXO10 at mitochondria (middle panel) shown as rightward shifted peak from the baseline non-expressing controls (top panel) and delocalization of FBXO10 (C953S) away from mitochondria shown as peak closer/matching baseline non-expressing controls (bottom panel). Representative of three independent experiments is shown. (E) FBXO10 and CaaX-mutant FBXO10(C953S) assemble into Cullin1-Ring-Ligase (CRL-1) complexes. STREP-tagged FBXO10, FBXO10(C953S) and empty vector (EV) were expressed in HEK293T cells and post cell harvesting, STREP-Tactin immunoprecipitations were performed with standard protocols. Subsequently, immunoprecipitated complexes were subject to SDS-PAGE and immunoblotting as shown. Shown is representative of three independent experiments. (F) Comparative mass spectrometry uncovers selective mitochondrial proteostasis via FBXO10. Perturbations in mitochondria-associated proteome was assayed by label free quantification (LFQ) mass spectrometry analysis (LFQ-MS/MS) of enriched mitochondrial fractions isolated by stepwise centrifugation from stable HEK293T cells expressing FBXO10, FBXO10 (C953S) and empty vector. Computational analysis of detected data sets under the three experimental conditions revealed changes in mitochondria-associated protein levels. The volcano plot shows significantly altered proteins between FBXO10 and FBXO10(C953S) data sets. OMM proteins that showed significant reciprocal protein level changes, i.e., decrease upon FBXO10 but increase upon FBXO10(C953S) expression, are highlighted (≥2 folds, at FDR 5%). FDR: False discovery rate. Three independent biological replicates of each FBXO10, FBXO10 (C953S) and empty vector samples were assayed by LFQ-MS/MS. (G) Candidate OMM targets of FBXO10 revealed by analysis of LFQ-MS/MS data sets. Computational analysis of data detected by LFQ-MS/MS under the experimental conditions mitochondrial proteome revealed changes in mitochondria-associated protein levels. Venn diagram depicts overlap of significantly deregulated protein numbers, i.e., decreased in FBXO10 vs EV and increased in FBXO10 (C953S) vs FBXO10 data sets. List of eighteen OMM proteins with reciprocal protein level changes, i.e., decrease upon FBXO10 but increase upon FBXO10(C953S) expression is shown (≥2 folds, at FDR 5%). Three independent biological replicates of each FBXO10, FBXO10 (C953S) and empty vector samples were assayed by LFQ-MS/MS. (H) CaaX-mutant FBXO10(C953S) and E3-ligase activity deEicient FBXO10(ΔF-box) inhibit mitochondrial ATP production. Measurement of mitochondrial ATP production was carried out in C2C12 cell stably expressing FBXO10, FBXO10 (C953S), FBXO10 (Δ-Fbox) and empty vector (EV) by Seahorse XF Real-Time ATP Assay. Line graphs show oxygen consumption rate (OCR) and bar graph shows mitochondrial and glycolytic ATP production rate (pmol/min) obtained from OCR and ECAR measurements. Bar graphs represent quantifications of ten biological replicates. Error bars indicate SEM. (I) FBXO10 gene deletion and silencing inhibit mitochondrial ATP production. CRISPR/Cas9-mediated FBXO10 gene deletion was carried out in C2C12 cells. FBXO10 silencing was carried out with two independent shRNAs targeted to untranslated (3’UTR) and coding (CDS) regions in C2C12 cells. Measurement of mitochondrial ATP production rate in indicated samples (controls, shRNA and CRISPR-Cas9 clone), was performed by Seahorse XF Real-Time ATP Assay as in (H). n= 10 for shCon, sh3UTR and shCDS; n= 11 for FBXO10 +/+, n=9 for FBX010 −/− where n represents the number of biological replicates. (J) FBXO10 gene deletion, CaaX-mutant FBXO10(C953S) and E3-ligase activity deEicient FBXO10(ΔF-box) inhibit mitochondrial membrane potential. Measurement of mitochondrial membrane potential was carried out by flowcytometry upon TMRM treatment (100nM) in differentiated C2C12 cell stably expressing FBXO10, FBXO10(C953S), FBXO10(Δ-Fbox), empty vector (EV) and CRISPR/Cas9-mediated FBXO10 gene deleted C2C12 clone (bottom). Bar graphs represent quantifications of three biological replicates for EV, FBXO10, FBXO10(C953S), FBXO10(Δ-Fbox) four biological replicates for FBXO10 +/+, n=9 for FBX010 −/−. p-values were calculated by a student-T-test. Error bars indicate SEM. (K) FBXO10 promotes perinuclear mitochondrial clustering whereas CaaX-mutant FBXO10(C953S) promotes mitochondrial fragmentation. HeLa cells expressing GFP-FBXO10 (top panel) and GFP-FBXO10(C953S) (bottom panel) were treated with MitoTracker for ~30 minutes prior to live cell confocal imaging using ZEISS-LSM750 microscope. Representative images depict the changes in mitochondrial network dynamics upon FBXO10 and FBXO10 (C953S) expression. Green arrows point to transfected cells whereas white arrows indicate non-transfected cell in the same field of view analyzed for morphological dynamic alterations. Scatter plots show total mitochondrial network areas/cell and mean mitochondrial areas calculated from non-transfected (NT), FBXO10 and FBXO10 (C953S) expressing cells using ImageJ mitochondrial analyzer software. [n=18 NT, n=19 FBXO10, n=21 FBXO10 (C953S)], p-values were calculated by a student-T-test. Error bars indicate SEM. Scale bar, 5 μm.
Figure 2.
Figure 2.. Geranylgeranylation of CaaX-cysteine953 is indispensable for the distribution of FBXO10 at outer mitochondrial membrane.
(A) Inhibition of geranylgeranylation re-distributes GFP-FBXO1O away from mitochondria into cytosol. HeLa cells expressing GFP-FBXO10 were treated with geranylgeranylation inhibitor (GGTi-2418, 50 μM) farnesylation inhibitor (FTi-lonafarnib, 10 μM), clinical drug statin (lovastatin, 15 μM) and vehicle for 16 hours. MitoTracker was added to decorate mitochondrial for ~30 minutes prior to live cell confocal imaging using ZEISS-LSM700 microscope. Representative images depict the changes in mitochondrial distribution of GFP-FBXO10 (panel 1) upon inhibition of farnesylation (panel 2), geranylgeranylation (panel 3) and mevalonate pathway (panel 4). Pearson correlation coefficients (PCC) for the colocalization of GFP-FBXO10 and mitochondria were analyzed in different cells [ vehicle (n=70), GGTi (n=72), Fti (n=73) and lovastatin (n= 77)]. Statistical analysis of plotted PPCs in scatter plots is shown (right). p-values were calculated by student-T-test. Scale bar 10μM. (B) Inhibition of geranylgeranylation results in loss of FBXO10 from subcellular mitochondrial fractions. HEK-293T cells expressing STREP-tagged FBXO10 cells were treated with geranylgeranylation inhibitor (GGTi-2418, 50 μM) or vehicle DMSO for 16 hours. Post-harvesting cell lysates were subjected to subcellular fractionation using stepwise ultracentrifugation (see Methods). Enriched mitochondrial and cytosolic fractions were assayed by SDS-PAGE and immunoblotted as indicated. Shown is representative of two independent experiments. (C) GGTi-2418 delocalizes FBXO10 from mitochondria. HeLa cells expressing ptd-Tomato-FBXO10 were treated with geranylgeranylation inhibitor (GGTi-2418, 50 μM) or vehicle DMSO for 16 hours. Enriched mitochondrial fractions were isolated by stepwise centrifugation. Isolated mitochondrial fractions were incubated with MitoView green facilitating mitochondrial tracking during flowcytometry analysis (FACS) for the quantification of mitochondria-associated ptd-Tomato-FBXO10 signal. Representative FACS histogram confirms localization of FBXO10 at mitochondria (middle panel) shown as rightward shifted peak from the baseline non-expressing controls (top panel) and delocalization of FBXO10 away from mitochondria upon GGTi-2418 treatment shown as peak closer/matching baseline non-expressing controls (bottom panel). Shown is representative of three independent experiments. (D) Metabolic labelling with tritiated mevalonate shows Cystine953 acceptor site for the FBXO10 prenylation. HEK293T cells expressing FLAG-FBXO10 and FLAG-FBXO10(C953S) were metabolically labeled with tritiated (H3)-mevalonolactone according to the protocol described in the methods section. Post-labeling, cells were harvested, and whole cell lysates were processed to carry out anti-FLAG immunoprecipitations. Tritium (H3) labeled immunocomplexes and lysates were subjected to SDS-PAGE using pre-cast gradient BoltTM 4–12% Bis-Tris Plus gels and transferred to a PVDF membrane. Subsequently, the PVDF membrane was exposed to a Phosphor-screen and H3-labeled proteins were detected with the Phosphor-imager. The autoradiograph (top), developed after exposure to Phosphor-screen, shows that FLAG-FBXO10, but not FLAG-FBXO10(C953S) is prenylated. (*) indicates non-specific. Bottom: PVDF membrane was probed with anti-FLAG immunoblotting. (E) FBXO10 along with SCF-subunits associate with outer mitochondrial membrane (OMM). Enriched intact mitochondrial fractions were isolated from HEK293T cells expressing STREP-FBXO1O by stepwise centrifugation. Isolated mitochondrial fractions were subjected to Trypsin protease protection (TPP) assay protocol (see methods). Mitochondrial lysates prepared from samples that underwent TPP-assay and untreated controls were subjected to SDS-PAGE followed by immunoblotting for the SCF-FBXO10 components and sub-mitochondrial membrane compartment specific markers, as indicated. Representative of three independent experiments is shown. (F) FBXO10 localizes at outer mitochondrial membrane (OMM). Enriched intact mitochondrial fractions were isolated from HEK293T cells expressing GFP-FBXO1O by stepwise centrifugation. Isolated mitochondrial fractions were subjected to Trypsin protease protection (TPP) as in (H). Samples that underwent TPP-assay and untreated controls were subjected to flowcytometry analysis (FACS) to quantify mitochondria-associated GFP-FBXO10 signal. Representative FACS histogram confirms FBXO10 at OMM (middle panel) shown as rightward shifted peak in untreated samples from the baseline non-expressing controls (top panel) and its loss from OMM due to Trypsin protease access at OMM shaving off GFP-FBXO10 in TPP-samples shown as leftward shifted peak closer/matching baseline non-expressing controls (bottom panel). Representative of three independent experiments is shown. (G) Dynamic subcellular distribution of FBXO10 at mitochondria. Fluorescence recovery after photobleaching (FRAP) analysis was carried out to monitor mobility of FBXO10 in HeLa cells expressing GFP-FBXO10. After focal photodestruction of the GFP signal with 488nm laser, the recovery of the GFP-FBXO10 signal in the bleached area was recorded over indicated time period using ZEISS-LSM700 microscope. In parallel an unbleached focal area was also monitored as control. Shown are the representative images of 18 independent cells analyzed for FRAP. The plot shows averaged GFP-FBXO10 signal recovery of 18 independent bleached areas from separate cells. GFP-signal before photodestruction was set as 100%. Calculated Recovery Rate: 0.23±0.04(%/μm2/sec). Error bar: SEM
Figure 3.
Figure 3.. The lipid-binding PDE6δ chaperone mediates delivery of geranylgeranylated-FBXO10 to OMM
(A) PDE6δ binds FBXO10, but not geranylgeranylation-deEicient FBXO10(C953S). STREP-tagged FBXO10, FBXO10(C953S) and empty vector (EV) were expressed in HEK293T cells. Post-cell harvesting STREP-Tactin immunoprecipitations were performed with standard protocols. Subsequently, immunoprecipitated complexes and corresponding whole cell lysates were subject to SDS-PAGE and immunoblotting as indicated. Representative of three independent experiments is shown. (B) SpeciEic binding of PDE6δ to CaaX motif containing F-box protein, FBXO10. FLAG-tagged indicated F-box family proteins representing FBXL, FBXW and FBXO subgroups and empty vector (EV) were expressed in HEK293T cells. Post cell harvesting anti-FLAG immunoprecipitations were performed with standard protocols. Subsequently, immunoprecipitated complexes were subject to SDS-PAGE and immunoblotting as indicated. Representative of two independent experiments is shown. (C) Deltarasin treatment inhibits PDE6δ binding to FBXO10. STREP-tagged FBXO10 expressing HEK293T cells were treated with deltarasin (2.5 μM) or DMSO overnight before cell harvesting. Deltarasin and DMSO treated frozen cell pellets were processed for STREP-Tactin immunoprecipitations with standard protocols. Subsequently, immunoprecipitated complexes were subject to SDS-PAGE and immunoblotting as indicated. Bar graph shows quantification of PDE6δ binding (n=2). Error Bar: SEM. Representative of two independent experiments is shown. (D) PDE6δ depletion delocalizes FBXO10 away from OMM. Non-targeting siRNA or siRNA targeting PDE6δ were transfected in HeLa cells for 20 hours as indicated. Post 20 hours, GFP-FBXO10 was expressed for 16 hours. Post treatment cells were treated with Mito-Tracker to decorate mitochondria before visualization by live cell confocal microscopy. Confocal images were captured using ZEIS LSM700 microscope. Shown are representative images of three independent experiments. Scale bar, 5 μm (E) Changing the equilibrium between PDE6δ and FBXO10 re-distributes FBXO10 away from OMM. GFP-FBXO10 and mCherry-PDE6δ were co-transfected in HeLa cells for overnight. Live cell confocal imaging of GFP-FBXO10 co-expressed with mCherry-tagged PDE6δ captured with ZEISS LSM750 confocal microscope. Green arrows indicate delocalization of GFP-FBXO10 in cells co-expressing mCherry-PDE6δ. white arrows indicate typical OMM distribution of FBXO10 in cells without mCherry-PDE6δ co-expressed. Shown is representative of three independent experiments. Scale bar 10μM. (F) Deltarasin treatment delocalizes FBXO10 away from OMM. Deltarasin (2.5μM) or DMSO treatment was carried out in HeLa expressing GFP-FBXO10 for 16 hours as indicated. Post treatment cells were treated with Mito-Tracker to decorate mitochondria before visualization by live cell confocal microscopy. Confocal images were captured using ZEIS LSM700 microscope. Shown is representative of two independent experiments. Scale bar: 5 μm.
Figure 4.
Figure 4.. HSP90 coordinates with PDE6δ for the speciRic targeting of geranylgeranylated-FBXO10 to OMM
(A) HSP90 and HSP70 bind FBXO10 and FBXO10(C953S). TOM70 binds FBXO10 but not FBXO10(C953S). STREP-tagged FBXO10 and FBXO10(C953S) were expressed in HEK293T cells before cell harvesting. Frozen cell pellets were processed for STREP-Tactin immunoprecipitations with standard protocols. Subsequently, immunoprecipitated complexes were subject to SDS-PAGE and immunoblotting as indicated. Shown is representative of three independent experiments. (B) Inhibition of HSP90, but not HSP70, redistributes FBXO10 away from mitochondria. CCT018159 (HSP90i: 10 μM), PES-Cl (HSP70i: 5 μM) or DMSO treatment was carried out in HeLa expressing GFP-FBXO10 for 16 hours as indicated. Post treatment cells were treated with Mito-Tracker to decorate mitochondria before visualization by live cell confocal microscopy. Confocal images were captured using ZEIS LSM700 microscope. Shown are representative images (n=70 for DMSO and n=47 for PES-Cl and n=29 for CCT018159). Pearson correlation coefficients (PCC) for the colocalization of GFP-FBXO10 and mitochondria were analyzed in different cells. Statistical analysis of plotted PPCs in scatter plots is show (right). p-values were calculated by student-T-test. Scale bar: 5 μm. (C) Delocalization of mitochondria associated FBXO10 by inhibition of HSP90, but not HSP70. Enriched intact mitochondrial fractions, as part of the experiment shown in Fig. 2C, were isolated from ptd-Tomato-FBXO1O expressing HEK293T cells treated with CCT018159 (10 μM), PES-Cl (10 μM) or DMSO for 16 hours by stepwise centrifugation. Before fractionation MitoView Green was added to non-expressing and ptd-Tomato-FBXO1O expressing cells undergoing treatments for 15 minutes to track mitochondria during flowcytometry analysis (FACS) to quantify mitochondria-associated ptd-Tomato-FBXO10 signal. Representative FACS histogram confirms FBXO10 at OMM (panel 2 and 3 from top) shown as rightward shifted peak in untreated and PES-Cl (HSP70i) treated samples from the baseline non-expressing controls (panel 1) and its loss from OMM due to CCT018159 (HSP90i) and GGTi treatments, but not PES-Cl, shown as leftward shifted peak closer/matching baseline non-expressing controls (panel 4, 5 from top). Representative of three independent experiments is shown. (D) Loss of FBXO10 from mitochondrial fractions upon HSP90 inhibition. HEK-293T cells expressing FLAG-tagged FBXO10 cells were treated with PES-Cl (10 μM), CCT018159 (10 μM) or vehicle DMSO for 16 hours. Post-harvesting cell lysates were subjected to subcellular fractionation using stepwise ultracentrifugation (see Methods). Enriched mitochondrial and cytosolic fractions were assayed by SDS-PAGE and immunoblotted as indicated. Representative of three independent experiments is shown. (E) HSP90 and PDE6D binding to FBXO10 is mutually independent. HEK293T cells expressing FLAG-tagged FBXO10 were treated with deltarasin and/or CCT018159 overnight before cell harvesting. Frozen cell pellets were processed for STREP-Tactin immunoprecipitations with standard protocols. Subsequently, immunoprecipitated complexes were subject to SDS-PAGE and immunoblotting as indicated. Representative of two independent experiments is shown. (F) HSP90, but not HSP70, silencing delocalizes FBXO10 away from OMM. Non-targeting siRNA or siRNA targeting HSP90 and HSP70 were transfected in two consecutive cycles in HeLa cells for total of 40 hours. Post-20-hour silencing, GFP-FBXO10 was expressed for 20 hours. Post-treatments cells were treated with Mito-Tracker for ~30 minutes to decorate mitochondria before visualization by live cell confocal microscopy. Confocal images were captured using ZEIS LSM700 microscope. Shown are representative images (N=38 for siRNA NT, N=37 siRNA HSP70 and N=29 siRNA HSP90). Pearson correlation coefficients (PCC) for the colocalization of GFP-FBXO10 and mitochondria were analyzed in different cells. Statistical analysis of plotted PPCs in scatter plots is shown (right). p-values were calculated by student-T-test. Scale bar: 5 μm. (G) PDE6δ co-immunoprecipitated mitochondrial FBXO10 and TOM70. STREP-tagged PDE6δ was co-expressed with FLAG-FBXO10 and FLAG-FBXO10(C953S) in HEK293T cells before cell harvesting. Frozen cell pellets were processed for Strep-Tactin immunoprecipitations with standard protocols. Subsequently, immunoprecipitated complexes were subject to SDS-PAGE and immunoblotting as indicated. Representative of two independent experiments is shown. (H) Simultaneous inhibition of HSP90 and PDE6D efEiciently delocalizes FBXO10 away from OMM. Enriched intact mitochondrial fractions were isolated from ptd-Tomato-FBXO1O expressing HEK293T cells treated with DMSO, CCT018159, deltarasin and in combination as indicated for 16 hours by stepwise centrifugation. Post fractionation MitoView Green was added to non-expressing and ptd-Tomato-FBXO1O expressing cells undergoing treatments for ~30 minutes to track mitochondria during flowcytometry analysis (FACS) to quantify mitochondria-associated ptd-Tomato-FBXO10 signal. Representative FACS histogram confirms FBXO10 at OMM (panel 2 from bottom) shown as rightward shifted peak from the baseline non-expressing controls (panel 1) and its loss from OMM due to treatments with CCT018159 (HSP90i) alone (panel 5), deltarasin alone (panel 4), and combination of deltarasin and CCT018159 (panel 6), shown as leftward shifted peaks closer/matching baseline non-expressing controls.
Figure 5.
Figure 5.. Geranylgeranylation-deRicient FBXO10(C953S) impairs mitochondria-driven myogenic differentiation in iPSCs and murine myoblasts.
(A) Geranylgeranylation-deEicient FBXO10(C953S) impairs myotube formation in iPSCs. Human iPSCs stably expressing FLAG-FBXO10, FLAG-FBXO10(C953S) and vehicle controls (EV) were differentiated for 20 days to myotubes (see protocol details in methods section). At the end point, the samples were fixed and immunostained with myosin heave chain (MyH) antibody conjugated to A488 fluorescent probe. Hoechst was added to stain nuclei prior to visualization by ZEISS LSM700 confocal microscopy. Scale bar: 20 μm. (B) Geranylgeranylation-deEicient FBXO10(C953S) blocks myotube formation in murine myoblasts C2C12. Murine C2C12 myoblasts stably expressing FLAG-FBXO10, FLAG-FBXO10(C953S) and vehicle controls (EV) were differentiated for 5 days to myotubes (see protocol details in methods section). At the end point, the samples were treated with Hoechst, and visualized by microscopy by live cell brightfield and florescence microscopy. Scale bar: 235.6 μm. (C) Myosin heavy chain positive myotube formation is blocked by geranylgeranylation-deEicient FBXO10(C953S). Murine C2C12 myoblasts stably expressing FLAG-FBXO10, FLAG-FBXO10(C953S) and vehicle controls (EV) were differentiated for 7 days to myotubes (see protocol details in methods section). At the end point, the samples were fixed and immunostained with myosin heave chain (MyH) antibody conjugated to A488 fluorescent probe. Hoechst was added to stain nuclei prior to visualization by ZEISS LSM700 confocal microscopy. Scale bar: 20 μm. (D) Geranylgeranyl-FBXO10, but not FBXO10(C953S), promotes myotube size increase. Indicated differentiated samples processed as in 5C were analyzed for myotube size measurements. Lengths and widths of MyH positive myotubes in EV and FBXO10 expressing samples were calculated using imageJ software and scatter plots were generated using GrapPad Prism software. FBXO10 (C953S) expressing samples were not analyzed (NA) because of non-detectable MyH positive myotubes (Myotube length: n=49 for EV and n=24 for FBXO10; Myotube width: n=20 for EV and n=25 for FBXO10). (E) Geranylgeranylation-deEicient FBXO10(C953S) promotes abnormal myotube formation and mitochondrial damage. Murine C2C12 myoblasts stably expressing FLAG-FBXO10, FLAG-FBXO10(C953S) and vehicle controls (EV) were differentiated for 8 days for myotube formation. At the end point samples were treated with MitoTraker Red, MitoView Green, and Hoechst to decorate mitochondria and nuclei. Representative images, captured by by ZEISS LSM700 confocal microscopy, show mitochondrial and myotube morphology. (Scale bar, 5 μm). (F) Persistent mitophagy promoted by geranylgeranylation-deEicient FBXO10(C953S). Mitophagy probe Mito-Kiema was stably co-expressed in murine C2C12 myoblasts expressing FLAG-FBXO10, FLAG-FBXO10(C953S) and vehicle controls (EV). As indicated, samples were differentiated for 7 days for myotube formation. At the end point samples were analyzed for mitophagy status by live cell confocal microscopy using 488 and 555 excitation lasers. Representative images, captured by ZEISS LSM700 confocal microscopy show mitochondria (green) and mitochondria/lysosomal(red) compartments. Red: indicates mitophagy positive. Green: indicates mitophagy negative.
Figure 6.
Figure 6.. FBXO10 loss impairs myogenic differentiation. PGAM5 is targeted for FBXO10 mediated degradation during myogenic differentiation.
(A) FBXO10 reconstitution rescues defective myotube formation. FBXO10 depletion was carried out with two independent shRNAs targeted to untranslated (3’UTR) and coding (CDS) regions in C2C12 myoblasts. In parallel, FLAG-FBXO10 expression was reconstituted in 3’UTR shRNA treated C2C12 myoblasts (sh3’UTR/FBXO10), as described in methods section. Control shRNA, FBXO10 depleted, and FBXO10 reconstituted C2C12 myoblasts were subjected to myogenic differentiation for 7 days to generate myotubes. At the end point, the samples were fixed and immunostained with myosin heave chain (MyH) antibody conjugated to A488 fluorescent probe to stain myotubes. Hoechst was added to stain nuclei prior to visualization by ZEISS LSM700 confocal microscopy. Number of properly formed myotubes was counted in indicated samples (N=7 control shRNA, N=10 shCDS, N=10 3UTR and N=15 sh3’UTR/FBXO10, where N represents the fields of view). Quantification of myotube formation is shown in the bargraph. p-values were calculated by student-T-test. Scale bar: 20 μm. (B) FBXO10 reconstitution rescues defective mitochondrial ATP production. FBXO10 depletion and reconstitution was carried out as in (A). Control shRNA, FBXO10 depleted, and FBXO10 reconstituted C2C12 myoblasts were subjected to myogenic differentiation for 7 days days. Measurement of mitochondrial ATP production was carried out by Seahorse XF Real-Time ATP Assay. Line graphs show oxygen consumption rate (OCR), and bar graph shows mitochondrial and glycolytic ATP production rate obtained from OCR and ECAR measurements. Bar graph represent quantification from 8 biological replicates. Error bars: SEM. (C) FBXO10 depleted myotubes show persistent mitophagy. Mito-Kiema, a mitochondria-specific mitophagy probe, was stably co-expressed in murine C2C12 myoblasts expressing control-shRNA, two independent shRNAs targeted to untranslated (3’UTR) and coding (CDS). As indicated, samples were differentiated for 7 days for myotube formation. At the end point samples were analyzed for mitophagy as in Fig. 5G. Red: indicates mitophagy positive. Green: indicates mitophagy negative. (D) PGAM5 speciEically interacts with FBXO10. Left: C2C12 myoblasts stably expressing FLAG-FBXO10, FLAG-FBXO10(C953S) and vehicle control (EV) were differentiated for 2 days. Post-2-day differentiation, samples were harvested and processed for whole cell lysate immunoprecipitation with ani-FLAG-resin. Immunoprecipitated complexes and WCLs were subject to SDS-PAGE and immunoblotting as indicated Shown is representative of three independent experiments. Right: FLAG-tagged FBXO10, indicated F-box family proteins and empty vector (EV) were expressed in HEK293T cells. Post cell harvesting anti-FLAG immunoprecipitations were performed with standard protocols. Subsequently, immunoprecipitated complexes were subject to SDS-PAGE and immunoblotting as indicated. Shown is representative of two independent experiments. (E) PGAM5 levels Eluctuate during myogenic differentiation. Myogenic differentiation in Parental C2C12 and CIRISPR/CAS9 deleted FBXO10 myoblast clone was carried out for up to 7 days before sample harvesting at indicated time points (see methods sections for details). Frozen cell pellets were lysed, and whole cell lysates were processed for SDS-PAGE followed by immunoblotting as indicated. (F) FBXO10, but not FBXO10, promotes PGAM5 polyubiquitylation. FLAG-tagged TR-TUBES, wild type and mutant, were expressed in HeLa cells as indicated. Immunoprecipitations from the prepared whole cell lysates were carried out with anti-FLAG resin. The immunopurified samples were subjected to SDS-FGAE followed by immunoblotting with the indicated antibodies. The ladder of bands corresponding to polyubiquitylated PGAM5 is marked by the bracket on the right. Immunoblot of TR-TUBEs expression is shown at the bottom. Shown is the representative of two independent experiments. (G) Crispr/Cas9-mediated FBXO10 deletion blocks myogenic differentiation. Parental C2C12 and two independent CIRISPR/CAS9 deleted FBXO10 clones (CRISPR#1 and CRISPR#2), as indicated, were differentiated for 7 days. At the endpoint, the samples were treated with Hoechst, and visualized by brightfield and immunofluorescence microscopy (Scale bar, 59.9 μm).

References

    1. Skaar J.R., Pagan J.K., and Pagano M. (2013). Mechanisms and function of substrate recruitment by F-box proteins. Nat. Rev. Mol. Cell Biol. 14, 369–381. 10.1038/nrm3582. - DOI - PMC - PubMed
    1. Petroski M.D., and Deshaies R.J. (2005). Function and regulation of cullin-RING ubiquitin ligases. Nat. Rev. Mol. Cell Biol. 6, 9–20. 10.1038/nrm1547. - DOI - PubMed
    1. Cox A.D., and Der C.J. (1992). Protein prenylation: more than just glue? Curr. Opin. Cell Biol. 4, 1008–1016. 10.1016/0955-0674(92)90133-w. - DOI - PubMed
    1. Berndt N., Hamilton A.D., and Sebti S.M. (2011). Targeting protein prenylation for cancer therapy. Nat. Rev. Cancer 11, 775–791. 10.1038/nrc3151. - DOI - PMC - PubMed
    1. Michaelson D., Silletti J., Murphy G., D’Eustachio P., Rush M., and Philips M.R. (2001). Differential localization of Rho GTPases in live cells: regulation by hypervariable regions and RhoGDI binding. J. Cell Biol. 152, 111–126. 10.1083/jcb.152.1.111. - DOI - PMC - PubMed

Publication types