[Preprint]. 2024 Apr 8:rs.3.rs-4165774.
doi: 10.21203/rs.3.rs-4165774/v1.

Activation of lysosomal iron triggers ferroptosis in cancer

Affiliations

Activation of lysosomal iron triggers ferroptosis in cancer

Raphaël Rodriguez et al. Res Sq. .

Update in

  • Activation of lysosomal iron triggers ferroptosis in cancer.
    Cañeque T, Baron L, Müller S, Carmona A, Colombeau L, Versini A, Solier S, Gaillet C, Sindikubwabo F, Sampaio JL, Sabatier M, Mishima E, Picard-Bernes A, Syx L, Servant N, Lombard B, Loew D, Zheng J, Proneth B, Thoidingjam LK, Grimaud L, Fraser CS, Szylo KJ, Der Kazarian E, Bonnet C, Charafe-Jauffret E, Ginestier C, Santofimia-Castaño P, Estaras M, Dusetti N, Iovanna JL, Cunha AS, Pittau G, Hammel P, Tzanis D, Bonvalot S, Watson S, Gandon V, Upadhyay A, Pratt DA, Freitas FP, Friedmann Angeli JP, Stockwell BR, Conrad M, Ubellacker JM, Rodriguez R. Cañeque T, et al. Nature. 2025 Jun;642(8067):492-500. doi: 10.1038/s41586-025-08974-4. Epub 2025 May 7. Nature. 2025. PMID: 40335696 Free PMC article.

Abstract

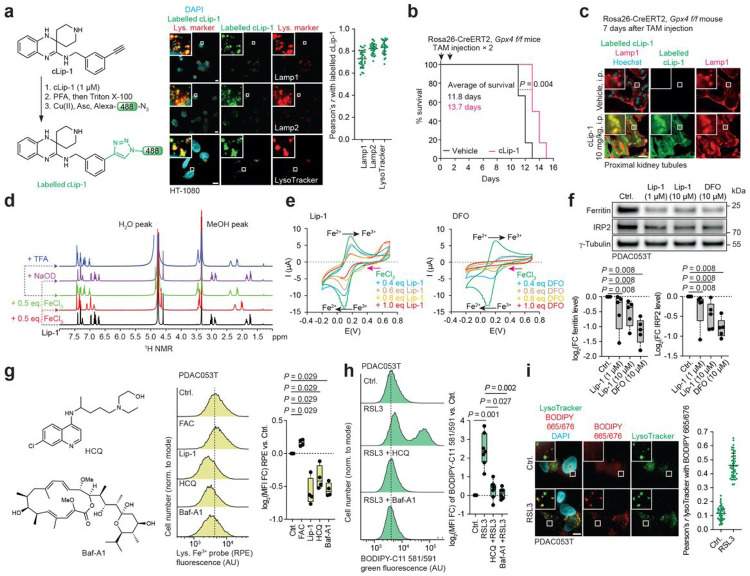
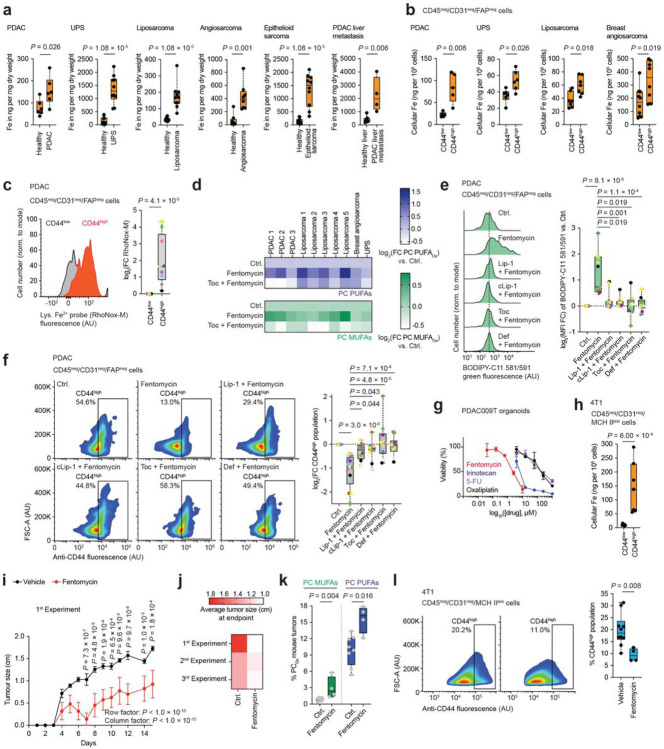
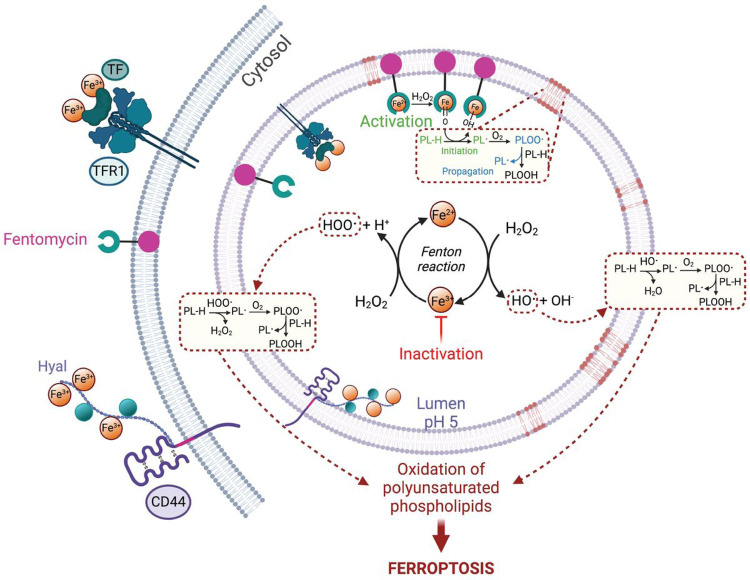
Iron catalyses the oxidation of lipids in biological membranes and promotes a form of cell death referred to as ferroptosis1-3. Identifying where this chemistry takes place in the cell can inform the design of drugs capable of inducing or inhibiting ferroptosis in various disease-relevant settings. Whereas genetic approaches have revealed underlying mechanisms of lipid peroxide detoxification1,4,5, small molecules can provide unparalleled spatiotemporal control of the chemistry at work6. Here, we show that the ferroptosis inhibitor liproxstatin-1 (Lip-1) exerts a protective activity by inactivating iron in lysosomes. Based on this, we designed the bifunctional compound fentomycin that targets phospholipids at the plasma membrane and activates iron in lysosomes upon endocytosis, promoting oxidative degradation of phospholipids and ferroptosis. Fentomycin effectively kills primary sarcoma and pancreatic ductal adenocarcinoma cells. It acts as a lipolysis-targeting chimera (LIPTAC), preferentially targeting iron-rich CD44high cell-subpopulations7,8 associated with the metastatic disease and drug resistance9,10. Furthermore, we demonstrate that fentomycin also depletes CD44high cells in vivo and reduces intranodal tumour growth in an immunocompetent murine model of breast cancer metastasis. These data demonstrate that lysosomal iron triggers ferroptosis and that lysosomal iron redox chemistry can be exploited for therapeutic benefits.


Conflict of interest statement

Additional Declarations: Yes there is potential Competing Interest. Institut Curie filed a patent application EP 24315029 related to LIPolysis-TArgeting Chimera to Induce Ferroptosis in Cancer. M.C. and B.P. hold patents for some of the compounds described herein, and are co-founders and shareholders of ROSCUE Therapeutics. B.R.S. is an inventor on patents and patent applications involving ferroptosis; co-founded and serves as a consultant to ProJenX, Inc. and Exarta Therapeutics; holds equity in Sonata Therapeutics; serves as a consultant to Weatherwax Biotechnologies Corporation and Akin Gump Strauss Hauer & Feld LLP.

Figures

Figure 1
Figure 1. Lysosomal iron triggers ferroptosis.
a, Experimental procedure for in-cell labelling of cLip-1 (1 μM, 1 h) by click chemistry and fluorescence microscopy of labelled cLip-1. Scale bars, 10 μm. At least 30 cells were quantified per condition. n = 3 independent experiments. Data are mean ± s.d. b, Kaplan-Meier survival curves of Rosa 26-CreERT2;Gpx4 f/f mice treated with cLip-1 (10 mg/kg/day; intraperitoneal injection; n = 6 mice per group). Mantel–Cox log-rank test. c, Fluorescence microscopy of cLip-1 labelled in renal proximal tubules of a Rosa 26-CreERT2, Gpx4 f/f mouse 7 days after tamoxifen injection. Scale bars, 10 μm. d, 1H NMR spectra of Lip-1 recorded at 310 K in methanol-d4. e, Cyclic voltammetry measurements towards reduction potentials (pink arrows) of an FeCl3 solution. Data recorded in the presence of Lip-1 or DFO. f, Representative western blots of iron homeostasis regulators in cells treated with iron chelators for 6 h (n = 5). FC, fold change. g, Molecular structure of lysosomal pH regulators and flow cytometry of the lysosomal Fe3+ probe RPE in cells treated for 1 h. AU, arbitrary unit. n = 4 independent experiments. FAC (100 μg/mL), Lip-1 (10 μM), HCQ (100 μM), Baf-A1 (75 nM). h, Flow cytometry of BODIPY-C11 581/591 in PDAC cells pre-treated with RSL3 for 7 h and treated with lysosomal pH regulators for 17 h. FC, fold change. Kruskal-Wallis test with Dunn’s post-test. RSL3 (200 nM), HCQ (10 μM), Baf-A1 (75 nM). i, Fluorescence microscopy of BODIPY 665/676 in PDAC cells treated for 1 h. Scale bars, 10 μm. At least 40 cells were quantified per condition. n = 3 independent experiments. Data are mean ± s.d. RSL3 (1 μM). f, g, Two-sided Mann–Whitney test. In all box plots in the main figures, boxes represent the interquartile range, centre lines represent medians and whiskers indicate the minimum and maximum values.
Figure 2
Figure 2. Development of a lipolysis-targeting chimera.
a, Chemical synthesis of fentomycin and production of the redox-active iron catalyst in situ. b, Oxidation rate of DOPC-forming liposomes in the presence of fentomycin. 2-way ANOVA. Mean values ± s.e.m. c, Fluorescence microscopy of fentomycin, marmycin A and CD44 in cells treated at 4 °C. 45 cells were quantified per condition. n = 3 independent experiments. Data are mean ± s.d. d, Fluorescence microscopy of fentomycin, marmycin A and cWhite-Chen ligand labelled in situ in cells treated at 37 °C. 45 cells were quantified per condition. n = 3 independent experiments. Data are mean ± s.d. e, Quantitative mass spectrometry-based lipidomics of oxidised phospholipids. n = 5 independent experiments. f, Representative western blot of ferroptosis regulators. n = 3 independent experiments. g, Flow cytometry of BODIPY-C11 581/591 in cells treated for 24 h. n = 7 independent experiments. Kruskal-Wallis test with Dunn’s post-test. h, Quantitative mass spectrometry-based lipidomics analysis of oxidised phospholipids in cells treated for 24 h. n = 5 independent experiments. i, Fluorescence of 4-HNE treated with Fentomycin for 1 h. 50 cells were quantified per condition. Two-sided unpaired t-test. Data are mean ± s.d. j, Representative western blot of lipases. n = 3 independent experiments. k, Quantitative mass spectrometry-based lipidomics of lysophospholipids in cells treated for 24 h. n = 10 independent experiments. l, Quantification of glycerol in cells treated for 24 h. Mean values ± s.e.m. m, LDH release from cells pre-treated for 2 h with inhibitors, then treated with 10 μM fentomycin for 6 h. n = 4 independent experiments. Fer-1, ferrostatin-1; Toc (tocopherol), DFO, deferoxamine; DFX, deferasirox; Def, deferiprone. The following concentrations were used unless stated otherwise: Fentomycin (1 μM), erastin (10 μM), RSL3 (100 nM), iFSP1 (10 μM), Toc (100 μM), Def (100 μM), Lip-1 (1 μM) and cLip-1 (1 μM). Scale bars, 10 μm. e, h, k-m, Two-sided Mann–Whitney test.
Figure 3
Figure 3. Pharmacological activation of lysosomal iron induces ferroptosis in drug-tolerant cancer cells.
a, ICP-MS of iron in human healthy and cancer tissues. n = 4–10 technical replicates. b, ICP-MS of iron in cancer cells of dissociated human tumors. n = 5–10 technical replicates. c, Flow cytometry of the lysosomal Fe2+ turn-on probe RhoNox-M in cancer cells of dissociated human PDAC. n = 9 patients. d, Quantitative mass spectrometry-based lipidomics of oxidised phospholipids in dissociated human tumors pre-treated with Toc for 2 h, then co-treated with fentomycin for 24 h. n = 10 patients. e, Flow cytometry of BODIPY-C11 581/591 in cancer cells of dissociated human PDAC pre-treated with ferroptosis inhibitors for 2 h and then co-treated with fentomycin for 24 h. n = 11 patients. f, Flow cytometry of CD44 in cancer cells of dissociated human PDAC pre-treated with ferroptosis inhibitors for 2 h and then co-treated with fentomycin for 24 h. n = 13 patients. g, Cell viability in human PDAC-derived organoid treated with fentomycin or standard-of-care chemotherapy for 72 h. h, ICP-MS of iron in mouse 4T1 breast tumour cells. n = 4–8 technical replicates. i, Tumour growth in 4T1-tumour bearing mice treated with fentomycin (0.003 mg per animal every-other-day). Vehicle: n = 10 mice, fentomycin: n = 5 mice. 2-way ANOVA. Mean values ± s.e.m. j, Size of tumours in 4T1-tumour-bearing mice of n = 3 independent experiments. 1st experiment vehicle: n = 10 mice, fentomycin: n = 5 mice; 2nd experiment vehicle: n = 10 mice, fentomycin: n = 10 mice; 3rd experiment vehicle: n = 5 mice, fentomycin: n = 5 mice. k, Quantitative mass spectrometry-based lipidomics of oxidised phospholipids in 4T1 tumours treated in vivo for 15 days. n = 4–8 mice. l, Flow cytometry of CD44 in dissociated 4T1 tumour cancer cells. The following concentrations were used unless stated otherwise: Fentomycin (1 μM), Toc (100 μM), Def (100 μM), Lip-1 (1 μM) and cLip-1 (1 μM). a-c, h, k, l, Two-sided Mann–Whitney test. e, f, Kruskal-Wallis test with Dunn’s post-test. c, e, f, each coloured dot represents a tumour of an individual patient for a given panel.
Figure 4
Figure 4. Mechanisms of ferroptosis initiation and blockade.
Iron is internalised by endocytosis. Lysosomal iron catalyses the production of oxygen-centred radicals from hydroperoxides under acidic conditions. These radicals can abstract a hydrogen from reactive phospholipids to produce carbon-centred radicals leading to oxidation products and ferroptosis. Inactivation of lysosomal iron protects cells against iron-redox chemistry. Activation of lysosomal iron triggers oxidation of membrane lipids and ferroptosis.

References

    1. Seiler A. et al. Glutathione peroxidase 4 senses and translates oxidative stress into 12/15-lipoxygenase dependent- and AIF-mediated cell death. Cell Metab. 8, 237–248 (2008). - PubMed
    1. Yang W.S. & Stockwell B.R. Synthetic lethal screening identifies compounds activating iron-dependent, nonapoptotic cell death in oncogenic-RAS-harboring cancer cells. Chem. Biol. 15, 234–245 (2008). - PMC - PubMed
    1. Dixon S.J. et al. Ferroptosis: an iron-dependent form of nonapoptotic cell death. Cell 149, 1060–1072 (2012). - PMC - PubMed
    1. Friedmann Angeli J.P et al. Inactivation of the ferroptosis regulator Gpx4 triggers acute renal failure in mice. Nat. Cell Biol. 16, 1180–1191 (2014). - PMC - PubMed
    1. Doll S. et al. FSP1 is a glutathione-independent ferroptosis suppressor. Nature 575, 693–698 (2019). - PubMed

Publication types

LinkOut - more resources